Team:BYU Provo/Modeling
From 2011.igem.org

|
Contents |
Overview
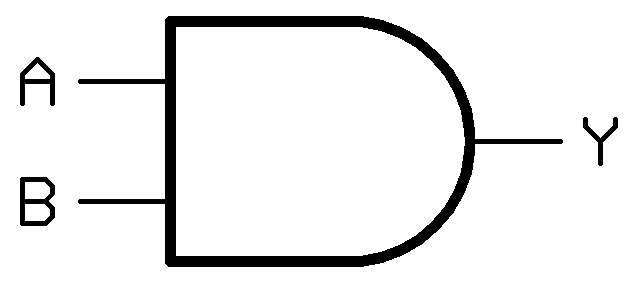
In other fields such as electrical or software engineering, logic gates form the foundation of decision-making circuits. Our project was to build a simple logic gate in E. coli from modular molecular parts. This year we built an [http://en.wikipedia.org/wiki/AND_gate AND gate]. An AND gate works by only producing an output in the presence of two inputs. In the figure to the right, "A" and "B" are the inputs, and "Y" is the output. In this case, If either "A", "B", or both inputs are missing, then "Y" will not be expressed.
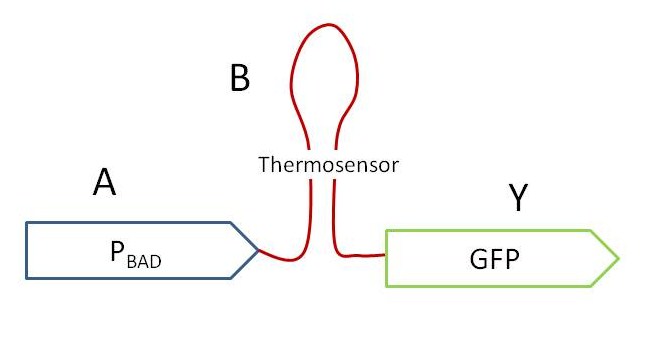
Our molecular AND gate works by the same principle as conventional AND gates. Input "A" in our construct can be any regulated promoter. In testing our construct we used two promoters: Pbad (a common, arabinose-inducible promoter) and PsoxS (a naturally occurring, reactive oxygen species-inducible promoter). Input "B" in our construct is a temperature dependent RNA switch or "thermosensor". Ouput "Y" can be any reporter gene. We have alternately used lacZ (turns blue in presence of X-gal), Superfolder GFP (fluoresces green), and an iGEM enzyme that produces [http://partsregistry.org/wiki/index.php?title=Part:BBa_J45270 banana smell].
Modeling the AND gate is similar for any combination of parts. To simplify this discussion, assume the Pbad promoter (an "arabinose" sensor"), the wild-type Lysteria thermosensor (a "heat" sensor), and GFP (our reporter or "output").
The most obvious use of a molecular AND gate is to create dual-input biosensors. A possible application is in detecting colon cancer. Colon cancer polyps produce high amounts of reactive oxygen species (ROS) and are higher in temperature than the surrounding colon tissue. A sensor for either of these inputs alone would be confounded by normal physiological variation in temperature and ROS. A dual-input sensor can effectively "ignore" this variation, and would only express a reporter molecule in the presence of both heat and ROS, significantly increasing the chances of finding actual polyps.
Molecular AND Gate Function
The figure above displays a simplified molecular AND gate. Input "A" in this case is arabinose, which induces downstream transcription from the Pbad promoter. The thermosensor and reporter gene are transcribed, and complimentary sequences in the resulting RNA bind together to fold into the thermosensor. The ribosomal binding site and start codon are embedded in the thermosensor structure. As long as the thermosensor is folded, it prevents translation of the reporter gene. Input "B" is heat. When the ambient temperature crosses a threshold (in this case, 37 degrees C), the complimentary sequences within the thermosensor melt apart and allow translation of the reporter gene. Output "Y" is GFP. If GFP is present, we can conclude that the AND gate was exposed to both inputs - arabinose and heat.
In modeling this system, it is important to note that input "A" controls transcription, and input "B" controls translation.
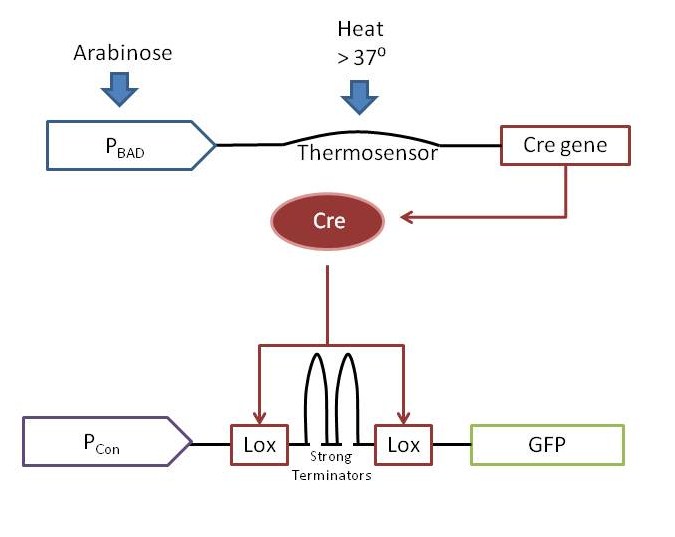
Our full AND gate contains one extra function more than the simple model described above. We use a [http://en.wikipedia.org/wiki/Cre-Lox_recombination Cre/Lox] system in order to achieve a sustained (constitutive) level of output "Y" after possibly transitory levels of inputs "A" and "B". To accomplish constitutive reporter expression, we put our reporter under the control of a constitutive synthetic promoter. As can be seen in the above figure, inputs "A" and "B" allow transcription and translation of the Cre protein. Cre is a site-specific recombinase that loops out any DNA between two identical 34 base sites called Lox sites. In our final construct, we cloned two Lox sites that sandwiched two transcriptional terminators in between the constitutive promoter and the reporter. While the Lox sites containing the double-terminators are present, the reporter is silent. When the AND gate allows transcription of cre, Cre removes the Lox sites and the double-terminator, allowing the reporter to be constitutivley expressed from that point on.
Modeling Input A: The Promoter
<math>
\documentclass{article}
\usepackage{amsmath} \usepackage{amssymb} \usepackage{latexsym} \usepackage{amsfonts} \usepackage{psfrag}
\title{iGEM Modelling Equations}
\begin{document}
\maketitle
\section{oxyR dynamics}
Model describing the transcription process without regulation.
let $m_p$ represents the concentration of mrna
$M$ represents the concentration of active mrna
$\alpha_{p}$ represents the rate of production of mrna
$\mu$ represents the growth rate for the cell (accounting for dilution)
$\gamma_p$ represents the rate at which mrna is being degraded
$\tau_p^{m}$ represents time delay constant which accounts processes such as transport of the mrna.
The change in mrna concentration can be modelled as follows:
\[ \frac{dm_p}{dt} = \alpha_{p,0} - \mu*m_p - \gamma_{p}*m_p \]
therefore the total concentration of active mrna can be described as follows:
\[ M(t) = e^{-\mu \tau_p^{m}} m_p(t - \tau_p^{m}) \]
However, in most instances the time delay indicated in the above equation is usually negligible compared to the overall time scale in which the change in concentration of the mrna is being observed. This means the time delay can be ignored in most cases.
Now for the oxyR case:
A simple model of the transcription process wich takes into account the regulatory action of the promoter due to the presence of other proteins can be described through the use of a Hill function. In this particular case:
Consider the regulation of the of a protein $A$ with concentration $P_a$ and a corresponding mRNA concentration $m_a$. Let B be a second protein with concentration $P_b$ that activates the production of protein A through transcriptional regulation.
The resulting change in the concentration of mrna, $m_a$, can be written as
\[ \frac{dm_a}{dt} = \frac{\alpha_{ab}k_{ab}P_{b}^{n_ab}}{1 + k_{ab}P_{b}^{n_ab}} + \alpha_{a, 0} - \gamma_{a}m_a\]
and
The change in the concentration of Protein $P_a$ can be described as:
\[ \frac{dP_a}{dt} = \gamma_am_a - \delta_aP_a \]
where
$n_ab$ = Hill coefficient that describes the cooperativity of the promoter
$\alpha_{a,0}$ = describes the leakiness" of the promoter
$\gamma_a$ = degradation rate of mrna a
$\alpha_{ab}$ = transcription rate where the total transcription rate is $\alpha_{a,0} + \alpha_{ab}$
$\beta_a$ = rate of translation of protein
$\delta_a$ = rate of degradation of the protein
For the oxyR system being described,
$P_b$ is the concentration of the OxyR protein that activates the transcription process when there are reactive oxygen species are present.
$m_a$ is the mrna produced in the presense of reactive oxygen species
let $P_b$ = $P_oxyr$
therefore equation # becomes:
\[ \frac{dm_a}{dt} = \frac{\alpha_{ab}k_{ab}P_{oxyr}^{n_ab}}{1 + k_{ab}P_{oxyr}^{n_ab}} + \alpha_{a, 0} - \gamma_{a}m_a\]
The equation above therefore describes the the overall change in the mrna concentration.
\section{RNA Thermosensor}
Equation (#) describes the change in concentration of the mrna which serves as a sensor that gets translated into a reporter protein when the temperature of the environmental temperature is above 37 degrees.
Without inhibition, a sample equation that describes the behavior of the thermosensor is as follows:
\[ \frac{dP_{rp}}{dt} = \frac{VT^{m}}{T^{m} + K^{m}} - K_{d}[P_{rp}] + K_{d}\]
at steady state the change in concentration of the protein
Solving the above equation at steady state for the concentration of reporter protein gives:
\[ [P_{rp}] = \alpha \frac{T^{m}}{T^{m} + K^{m}} + 1 \]
where
$P_{rp}$ represents the concentration of the reporter protein $T$ represents temperature
Parameters $m$, $\alpha$ and $K$ can be estimated from reporter assay results for any specific thermosensor to be modeled. It should be noted that $\alpha$ represents a normalized constant which takes into account the mrna concentration, translation rate and the protein degradation rate.
\end{document}
</math>
Modeling Input B: The Thermosensor
Modeling the AND Gate: Putting It All Together
Acknowledgements
Modeling was performed by Julius Adebayo. One very useful resource was the book [http://www.cds.caltech.edu/~murray/amwiki/index.php/Main_Page "Feedback Systems: An Introduction for Scientists and Engineers"] by [http://www.cds.caltech.edu/~murray/amwiki/index.php/Karl_J._%C3%85str%C3%B6m Karl J. Åström] and [http://www.cds.caltech.edu/~murray/amwiki/index.php/Richard_M._Murray Richard M. Murray].
 "
"


