Team:Cambridge/Experiments/Squid Dissection and Tissue Sample
From 2011.igem.org
Contents |
Amplification of Reflectin Genes from Squid Genomic DNA
Before we could begin with the rest of our project, we needed the reflectin coding region. [http://en.wikipedia.org/wiki/Loligo Loligo] tissue was sourced from fishing bait suppliers and culinary wholesalers in order to attempt genomic DNA extraction. Our literature search indicated that the reflectin gene from E. scolopes contains no introns, so genomic DNA should be suitable for expression in E.coli.
Summary
We aimed to extract DNA from dissected squid tissue, amplify the relevant gene by PCR and perform gel electrophoresis to verify that we had successfully extracted reflectin.
Our literature search suggested that (for reasons unknown) cephalopod DNA is difficult to isolate and clone from. Since we did not have any other way of getting our reflectin gene, we tried two different DNA extraction protocols, in the hope that one would work successfully. One extraction protocol appeared to work, while the other left us with DNA which was pink – a sure sign that it was heavily contaminated.
We proceeded with PCR on the successful extraction. By designing multiple sets of primers for each different DNA sample, it was hoped that we would see some successful amplification. However, by running gel electrophoresis we found that none of our samples had been successfully amplified.
Whether this was due to our DNA extraction or due to a PCR problem soon became a moot point, as we were kindly sent synthetic reflectin genes by Wendy Crookes-Goodson, author of many of the papers on reflectin.
Detail
Squid Dissection
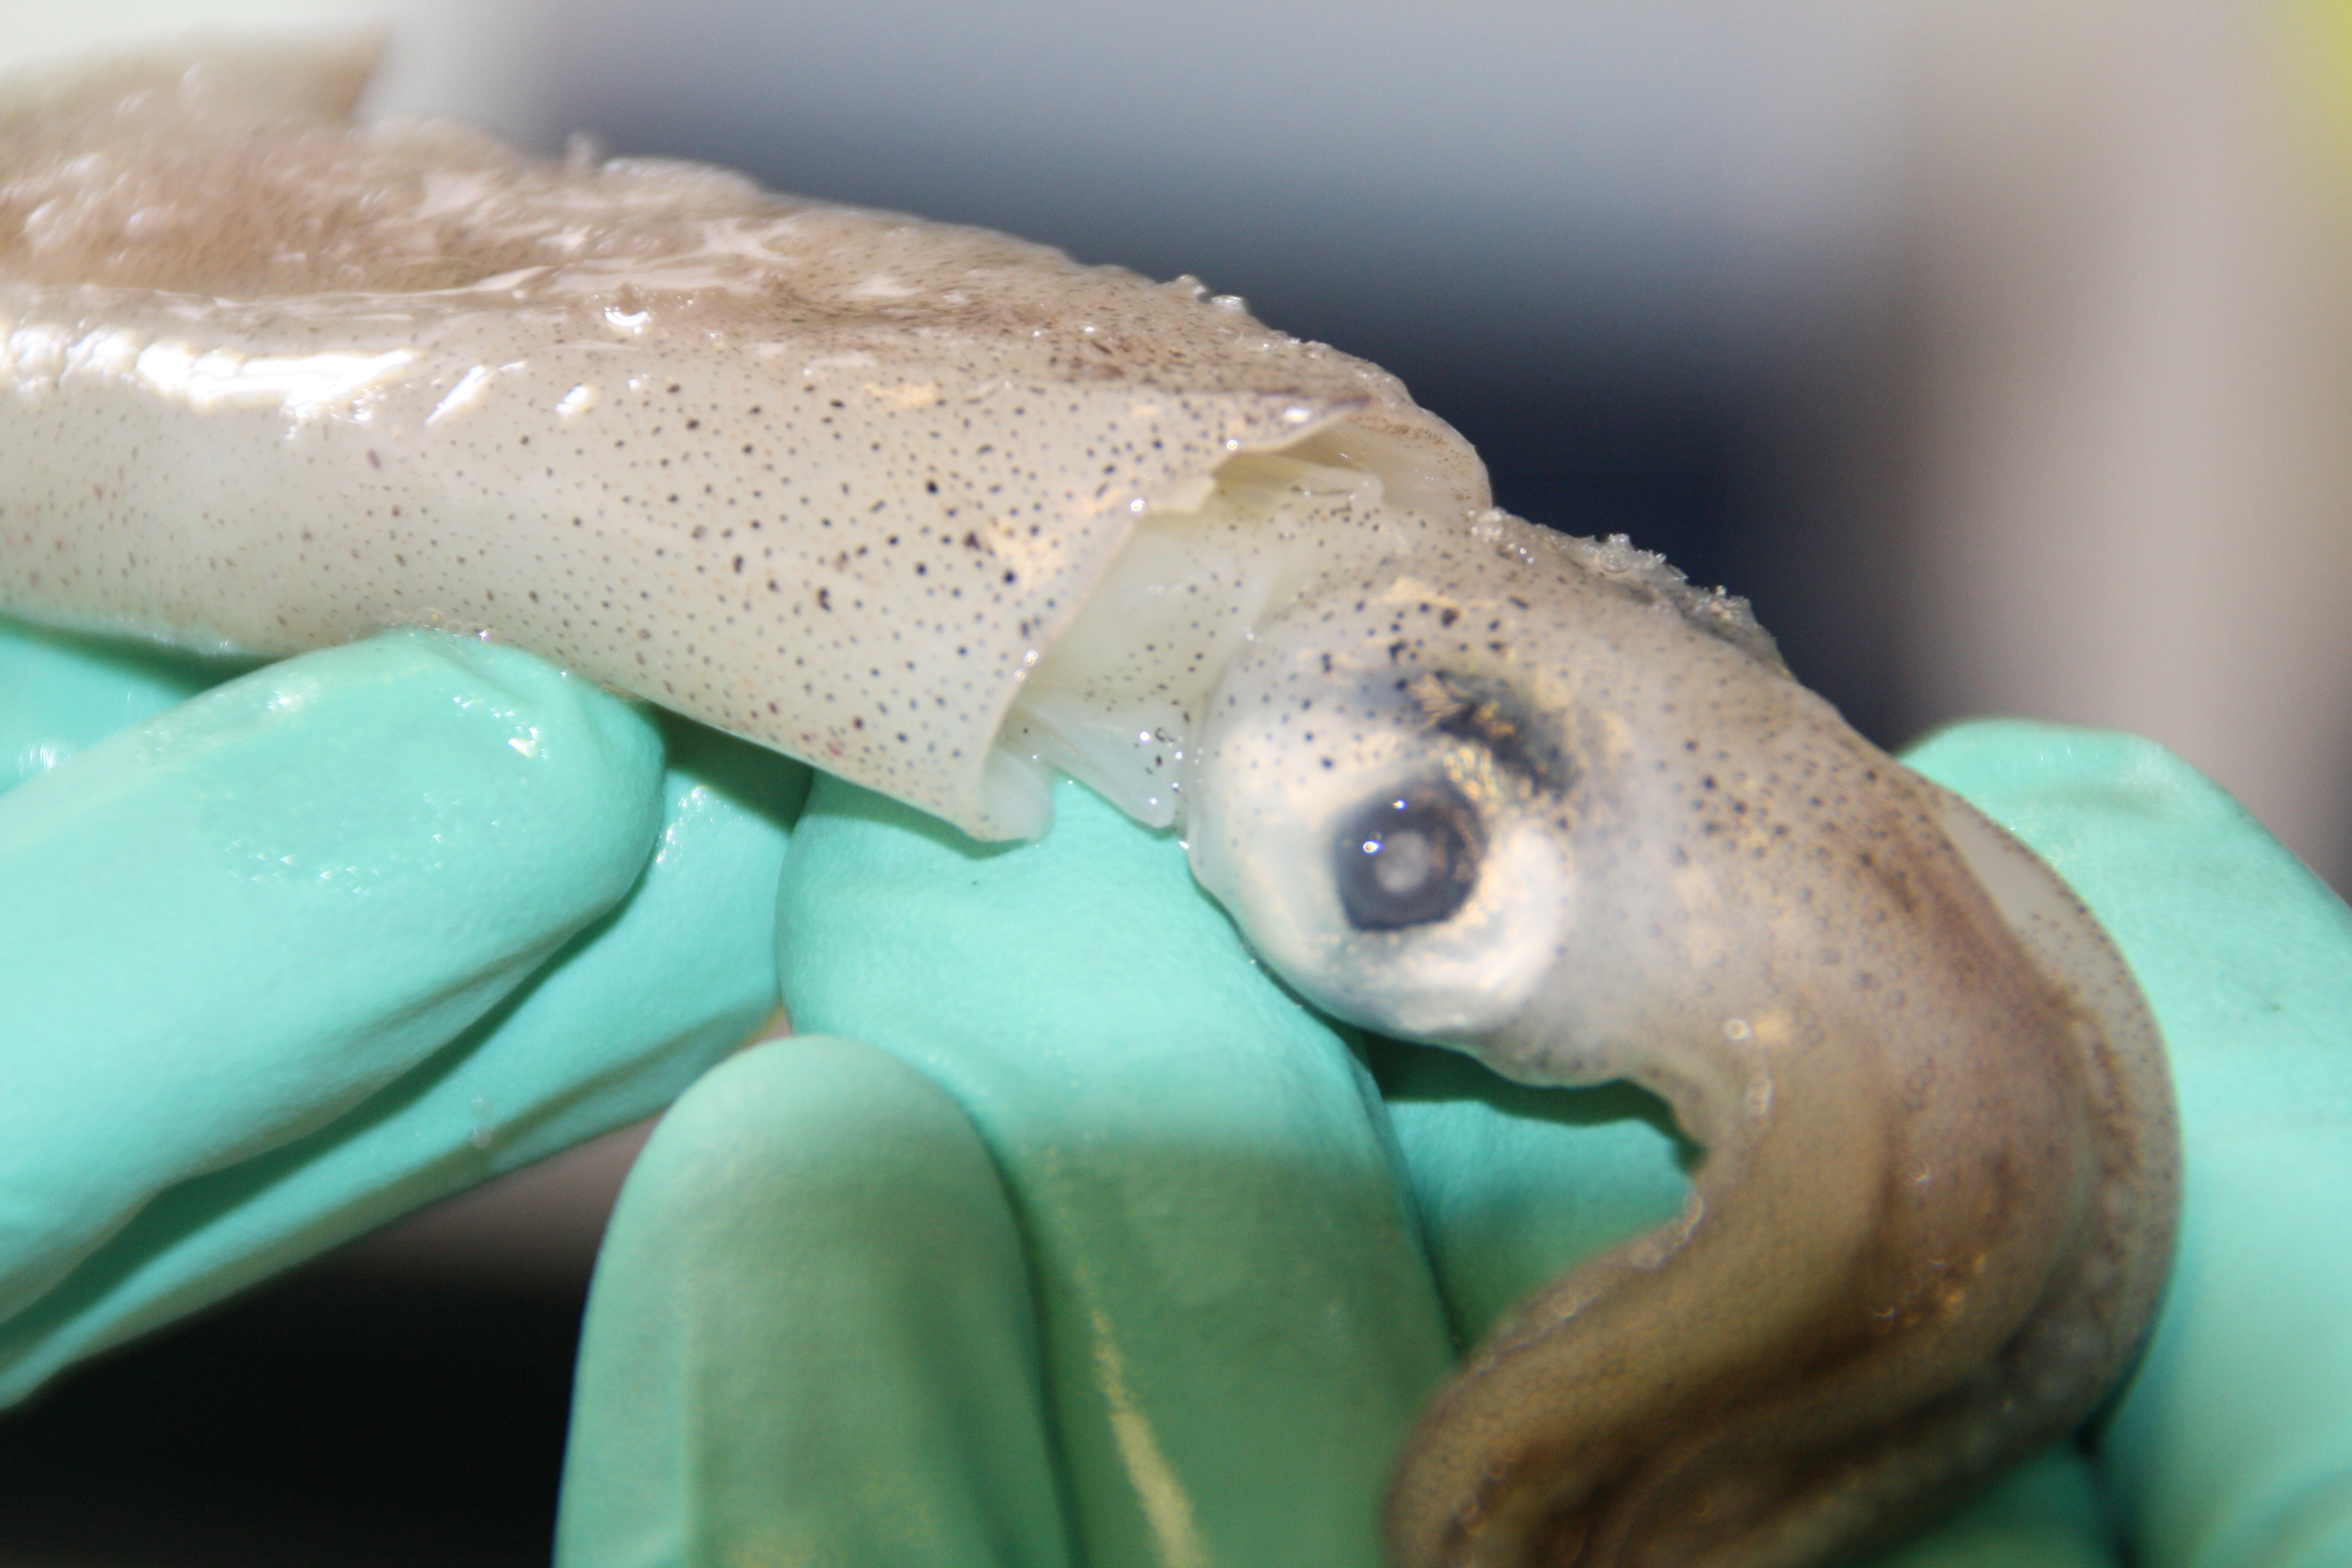
Specimens of what we identified as [http://www.marlin.ac.uk/speciesinformation.php?speciesID=3718 Loligo vulgaris] and [http://en.wikipedia.org/wiki/Opalescent_Inshore_Squid Loligo opalescens] were dissected for examination. Samples of skin tissue and eye cups were taken from L. vulgaris for further imaging. No obvious iridescence was seen in the skin sample under a dissection microscope or by confocal microscopy, (though this is known to require the neurotransmitter acetyl choline in order to be activated). In accordance with [http://rsif.royalsocietypublishing.org/content/early/2011/02/14/rsif.2010.0702.full Holt et al], we found clearly visible static iridescence in the tissue surrounding the eye lens in the form of the silvery tissue exhibiting a sheen of colours from across the visible spectrum.
DNA Extraction
To isolate squid genomic DNA as a template for PCR, samples of squid tissue were cut from representative specimens. Internal organs and tissue were dissected with the aim of minimizing external contamination. L. vulgaris specimens were obtained from two different sources, so samples were taken from both.
A DNA extraction protocol was followed to isolate genomic DNA from tissue.
Design of Primers
We decided to perform PCR in order to isolate and amplify reflectin coding sequences from genomic DNA of Loligo vulgaris and Loligo opalescens. As no reflectin gene sequences from the two species that we worked with are known, we designed primers relying on the published sequences of A1, A2 and B1 reflectin mRNAs from Loligo pealei.
The assumptions that we made and the way of our reasoning are the following:
1. Because of close evolutionary relationship and an important role of reflectin proteins in the animal physiology and survival, we expect other squids from the Loligo genus to express the same, or very similar, set of reflectin proteins.
- Although the phylogeny of the loliginid squids has not been fully revealed yet, a fairly consistent picture of evolutionary relationships within the taxon has emerged from several studies, which included:
- comparison of sequences of two mitochondrial genes (the 16S rRNA and the cytochrome c oxidase subunit I genes) between members of 19 loliginid species and several outgroups (Anderson, 2000 [1]);
- comparison of multiple data sets, such as morphology, allozymes and DNA seqence data for the two mitochondrial genes (Anderson, 2000 [2]);
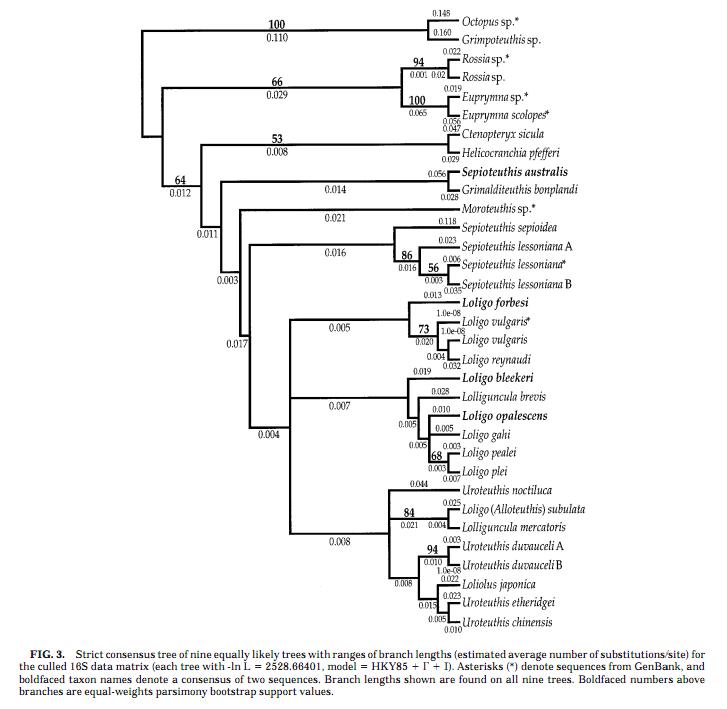
- The fairly reliable phylogenetic tree of the loliginid squids is presented below:
- According to the phylogenetic tree, L. pealei is fairly closely related to L. opalescens, and L. vulgaris shows close evolutionary relationship with L. forbesi, whose sequence of reflectin-like protein mRNA is also published in the GenBank database. However, the exact evolutionary history of the two taxons is not resolved yet.
2. As the amino acid sequence of proteins is generally more conserved than nucleotide sequence, we considered designing degenerate primers, using [http://www.kazusa.or.jp/codon/cgi-bin/spsearch.cgi?species=loligo&c=i codon usage tables] to maximize the likelihood of amplifying L. opalescens and L. vulgaris reflectin genes.
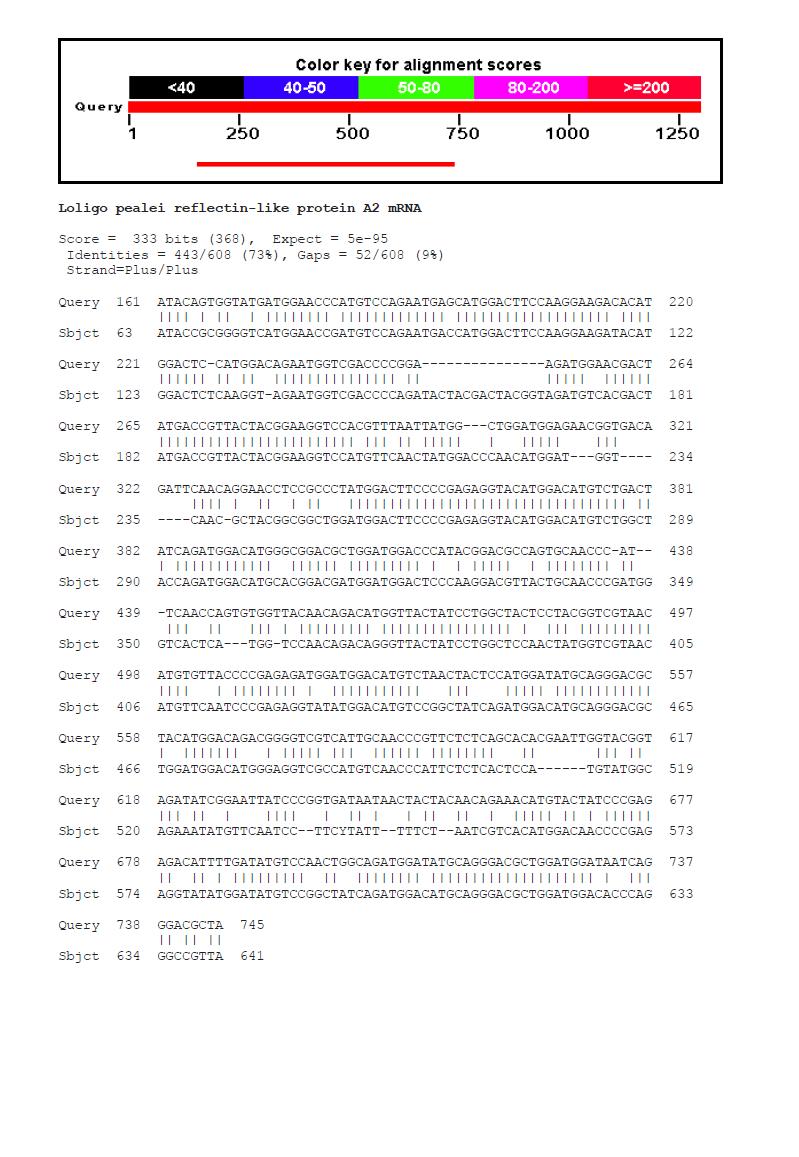
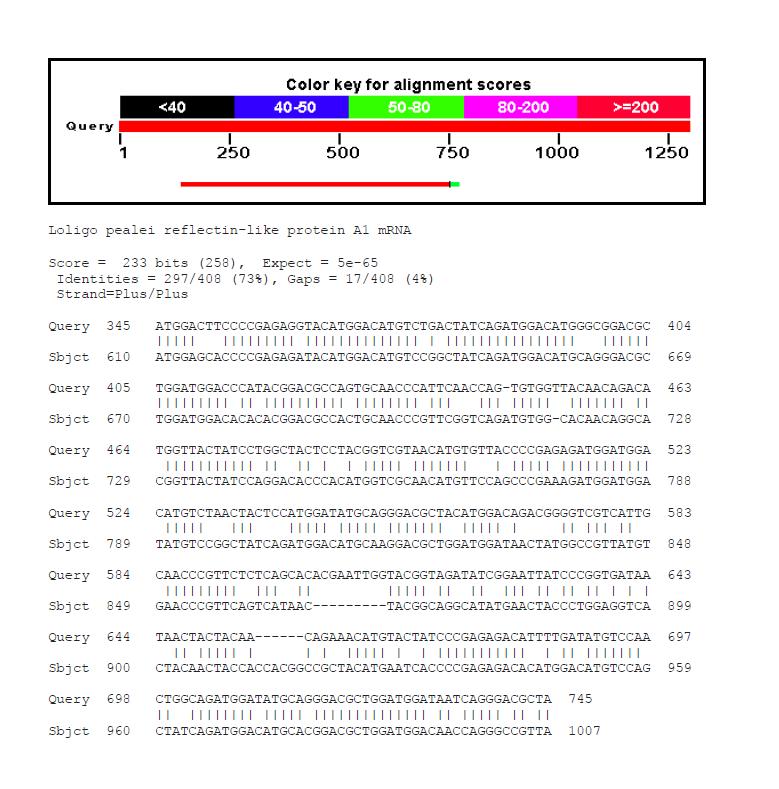
- However, comparison of reflectin mRNA sequences of Loligo pealei and reflectin-like methionine-rich repeat protein 1 mRNA sequence from Loligo forbesi showed quite high conservation of the nucleotide sequence.
- We performed BLAST analysis using the methionine-rich repeat protein as a query and comparing it to A1 and A2 reflectin sequences from Loligo pealei.
- After that, we analysed conservation of nucleotide sequences of the highly conserved protein regions.
Consequently, we decided not to take codon bias into consideration and design primers complementary to terminal sequences of reflectin mRNAs from L. pealei, so that they would allow us to amplify the entire coding sequence, from the START to the STOP codon.
| Primer | Reflectin A1 | Reflectin A2 | Reflectin B1 |
|---|---|---|---|
| Forward | 5’ ATGAATCGAT ATCTGAATCG 3’ | 5’ ATGAATCGCT ACATGATGAG 3’ | 5’ ATGTCTTCTT TTATGGATCC 3’ |
| Reverse | 5’ TTAATACATG TGATAGTCGT 3’ | 5’ CTAATACCAA GAATTGTAAT 3’ | 5’ TTAGGCTGAA TCTGTGAGCT 3’ |
It is worth emphasizing that the published sequences are mRNA sequences, giving us no information about endogenous promoters or 5'UTR and 3'UTR regions. Additionally, they do not provide any information about the presence and position of introns either.
- However, according to the literature (Crookes, 2004), the bobtail squid reflectin genes do not contain introns, and thus, assuming the common evolutionary origin, reflectin genes from other squid species are likely not to include introns as well.
- Thus, high deviation of PCR products from the expected length will give us a clue about the presence of intro sequences, although this might be also caused by other factors, such as:
- interspecific variation
- misannealing and amplification of other sequences than reflectin genes
PCR Reaction
The next step involved PCR reaction with Phusion Hot Start II DNA Polymerase, according to the following protocol. We chose a modified version of PCR - gradient PCR, which allowed us to test different annealing temperatures. As we did not expect the primers to show complete fidelity to the coding sequences of the analyzed species, different conditions of annealing would ensure that we would amplify the most matching sequences from the genomic DNA template.
We prepared 72 PCR reactions:
| genomic DNA template from three different squids: two L. vulgaris individuals and one L. opalescens individual | × | three sets of primers: A1, A2 and B1 | × | eight different annealing temperatures ranging from 72°C to 50°C |
Gel Electrophoresis
We performed gel electrophoresis of the products of PCR reaction in order to check:
- how effective the reaction of amplification was,
- if the size of PCR products roughly matched the length of reflectin mRNAs from Loligo pealei, and
- how successful the DNA extraction protocol was.
Samples run on the first gel included:
| Well | 1 | 2 | 3 | 4 | 5 | 6 |
|---|---|---|---|---|---|---|
| Sample | HyperLadder I | L. opalescens A1 primers 72.0°C | L. opalescens A1 primers 68.9°C | L. opalescens A1 primers 65.7°C | L. opalescens A1 primers 62.6°C | L. opalescens A1 primers 59.4°C |
| 7 | 8 | 9 | 10 | 11 | 12 | 13 |
| L. opalescens A1 primers 56.3°C | L. opalescens A1 primers 53.1°C | L. opalescens A1 primers 50.0°C | HyperLadder I | L. opalescens A2 primers 72.0°C | L. opalescens A2 primers 68.9°C | L. opalescens A2 primers 65.7°C |
| 14 | 15 | 16 | 17 | 18 | 19 | 20 |
| L. opalescens A2 primers 62.6°C | L. opalsecens A2 primers 59.4°C | L. opalescens A2 primers 56.3°C | L. opalescens A2 primers 53.1°C | L. opalescens A2 primers 50.0°C | HyperLadder I | L. opalescens genomic DNA |
Note: HyperLadder I is a set of molecular weight markers that allow for quantification and size determination within the 200bp - 10,000bp range.
As we can see from the picture of the gel:
- no bands are visible in the lanes loaded with the PCR products, and surprisingly neither primers nor template DNA can be detected as well
- there is no trace of DNA in the last lane (numer 20) which was loaded with the supernatant obtained during the squid DNA extraction process
These observations suggest low efficiency of the extraction method. To check if this problem was unique to DNA from Loligo opalescens, we ran a second gel which included genomic DNA from the two Loligo vulgaris individuals as well as an array of PCR reactions conducted at different temperatures (65.7°C and 56.3°C) and with different sets of primers.
| Well | 1 | 2 | 3 | 4 | 5 | 6 |
|---|---|---|---|---|---|---|
| Sample | HyperLadder I | L. vulgaris lf genomic DNA | L. vulgaris ba genomic DNA | L. opalescens B1 primers 65.7°C | L. vulgaris lf A1 primers 65.7°C | L. vulgaris lf A2 primers 65.7°C |
| 7 | 8 | 9 | 10 | 11 | 12 | 13 |
| L. vulgaris lf B1 primers 65.7°C | L. vulgaris ba A1 primers 65.7°C | L. vulgaris ba A2 primers 65.7°C | L. vulgaris ba B1 primers 65.7°C | HyperLadder I | L. opalescens B1 primers 56.3°C | L. vulgaris lf A1 primers 56.3°C |
| 14 | 15 | 16 | 17 | 18 | 19 | 20 |
| L. vulgaris lf A2 primers 56.3°C | L. vulgaris lf B1 primers 56.3°C | L. vulgaris ba A1 primers 56.3°C | L. vulgaris ba A2 primers 56.3°C | L. vulgaris ba B1 primers 56.3°C | HyperLadder I | L.opalescens genomic DNA |
Note: L. vulgaris lf stands for the Loligo squid obtained from fishing bait suppliers, while L. vulgaris ba stands for the Loligo squid bought from the local culinary wholesaler.
We could see a similar pattern in the second gel:
- no products of PCR reactions, as well as primers and template DNA were visible,
- no smear of genomic DNA from L. opalescens and L. vulgaris ba was detected,
- however, we noticed a thin faint band of genomic DNA from L. vulgaris lf, but the detectable amount of the template DNA did not improve the efficiency of corresponding PCR reactions.
We concluded that the DNA extraction protocol applied in this experiment was not very efficient and that this was the main reason why we failed to obtain any amplified reflectin or reflectin-related genes. We decided to repeat the experiment using other DNA extraction protocols.
References
- Anderson F.E. (2000) Phylogeny and historical biogeography of the loliginid squids (Mollusca: Cephalopoda) based on mitochondrial DNA sequence data. Molecular Phylogenetics and Evolution, 15: 191-214.
- Anderson F.E. (2000) Phylogenetic relationships among loliginid squids (Cephalopoda: Myopsida) based on analyses of multiple data sets. Zoological Journal of the Linnean Society, 130: 603–633.
- Crookes W.J., Ding L., Huang Q.L., Kimbell J.R., Horwitz J., McFall-Ngai M.J. (2004) Reflectins: the unusual proteins of squid reflective tissues. Science, 303: 235–238.
 "
"


