Team:Cambridge/Experiments/Synthetic Reflectin PCR and Construction of GA1 to 6
From 2011.igem.org
Contents |
Synthetic Gene Amplification & Plasmid Construction
Synopsis
The synthetic genes were extracted from the filter paper on which they were sent, and amplified by PCR.
Six plasmids were then constructed, named GA 1-6, as shown below. Each puts reflectin expression under the control of pBAD promoter, an arabinose inducible promoter. HIS tags were included on some of the constructs in order to purify the protein for in vitro work. In addition, we put both reflectin A2 and 1B in a low expression plasmid.
| Name | Description | ||
|---|---|---|---|
| GA1 | Reflectin A1 | on PSB1A2 (high copy) | pBAD promoter + B0015 terminator |
| GA2 | Reflectin A1 | on PSB3K3 (low copy) | pBAD promoter + B0015 terminator |
| GA3 | Reflectin A1 + HIS tag | on PSB1A2 (high copy) | pBAD promoter + B0015 terminator |
| GA4 | Reflectin A1 + HIS tag | on PSB3K3 (low copy) | pBAD promoter + B0015 terminator |
| GA5 | Reflectin A2 | on PSB3K3 (low copy) | pBAD promoter + B0015 terminator |
| GA6 | Reflectin 1B | on PSB3K3 (low copy) | pBAD promoter + B0015 terminator |
These constructs were grown up in E.coli and verified by colony PCR. The plasmids were then miniprepped and stored at -20°C.
Extraction & Amplification
The plasmids with the reflectin gene were first extracted from filter paper, and then used to transform competent E. coli cells. A standard miniprep was used to recover the plasmid DNA from the overnight culture of the transformed bacteria in LB. The purpose of this procedure was to amplify and store the plasmid DNA.
<! -- Cut out a portion of the plasmid-containing filter paper (half of the blot), and apply 50 μl elusion buffer (QIAGEN) in an eppendorf tube.
- Spin in the micro centrifuge for 1 min to elute the DNA from the paper.
- Add 250 μl of SOC to a 1.5 ml eppendorf tube of OD600 competent cells and transform with 1 μl of the plasmid DNA. When pipetting the plasmid, use the pipette tip to squeeze some fluid off the filter paper if necessary. At this point, the eluted DNA (with paper) was then stored in the freezer.
- Plate out 10 μl and 100 μl on LB agar plates
Miniprep extraction
- Transfer some bacteria from the colonies to liquid culture, and incubate for a further 16 hours.
- Perform a standard miniprep.
Healthy colonies of transformed E. coli were observed after incubation in LB agar, indicating the success of the amplification procedure. -->
Construct Design
For the assembly of the required plasmids, we amplified desired components by PCR and then joined them using Gibson Assembly procedure.
We used three different DNA templates:
- [http://partsregistry.org/Part:BBa_I13520 I13520]:[http://partsregistry.org/Part:pSB1A3 pSB1A3], which contains mRFP gene under the control of pBAD promoter. It provided high copy number plasmid backbone and elements required for the expression of the gene of interest, such as pBAD/araC promoter [http://partsregistry.org/Part:BBa_I0500 I0500], ribosome binding site [http://partsregistry.org/Part:BBa_B0034 B0034] and terminator [http://partsregistry.org/Part:BBa_B0015 B0015].
- [http://partsregistry.org/Part:BBa_J69511 J69511]:[http://partsregistry.org/Part:pSB3K3 pSB3K3], which contains GFP under the control of [http://partsregistry.org/wiki/index.php?title=Part:BBa_R0011 R0011] promoter that allows for strong constitutive expression unless it is repressed by LacI. It provided low copy number plasmid backbone and terminator [http://partsregistry.org/Part:BBa_B0015 B0015].
- a plasmid with reflectin A1/A2/1B coding region
The his tag present in GA3 and GA4 constructs was included in primers.
We created high copy number plasmids GA1 and GA3 by replacing mRFP coding region of pSB1A2:I13520 with reflectin A1 coding region.
In the case of low copy number plasmids, GA2 and GA4-6, the respective reflectin coding region was joined to a part of pSB1A2 upstream, carrying pBAD/araC and RBS, and was attached to a part of the pSB3K3 downstream, contributing a terminator and a backbone. We managed to join pBAD/araC promoter and B0015 ribosome binding site with the low copy number plasmid backbone using a pair of primers complementary to the region around the standard annealing site, included in every standard biobrick backbone.
Sequences of the primers used in the experiment and their predicted melting temperatures are the following: 1 2 3 4 5 6 1-his 4-his 1-a2 2-a2 3-a2 4-a2 1-1b 2-1b 3-1b 4-1b
The pictures below give an overview of the assembly of the plasmids:
Assembly of GA1, GA2, GA3 and GA4 - First Attempt
PCR
In the first round of PCR, we amplified fragments required for the assembly of GA1, GA2, GA3 and GA4 constructs.
- We performed PCR using Phusion Hot Start DNA Polymerase in 20 μl reaction volume.
- Time profile used in the PCR machine was the following:
| Hold | 95°C | 2 min | |
| Cycling ×30 | Denaturing | 95°C | 10 s |
| Annealing | 55°C | 20 s | |
| Elongation | 72°C | 150 s |
We decided to use the 55°C annealing temperature, although the predicted temperature for most primers is 5-10°C higher, because of a low annealing temperature of the VF2 primer.
- Primers and template DNA provided by our supervisor Paul served as a positive control, but eventually we did not detect any products on the gels.
The pictures below present results of the gel electrophoresis of PCR products.
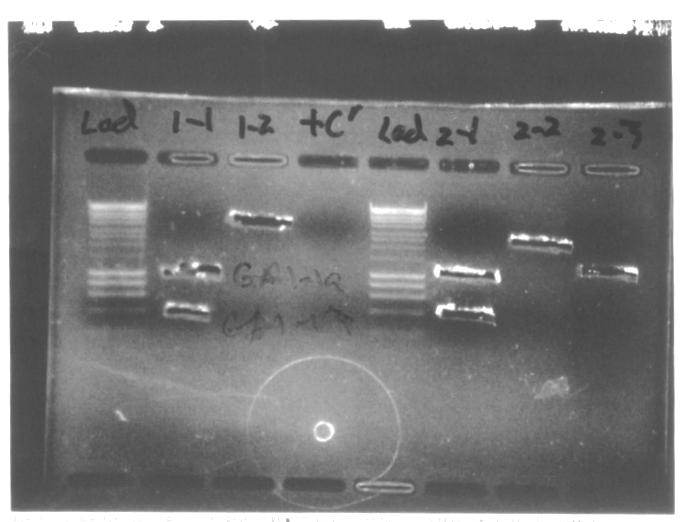
- In most cases position of a band matches the expected length of DNA fragment. The only exception are GA1-2 and GA3-2 products. According to the position on the gel the length of these DNA fragments is 4-5kb, whereas the predicted length is 3.5kb. Our hypothesis is that we were provided [http://partsregistry.org/Part:pSB1AK3 pSB1AK3] backbone instead of [http://partsregistry.org/Part:pSB1A3 pSB1A3] backbone.
- For GA1-1, GA2-1, GA3-1 and GA4-1 we obtained two bands: 1000bp and 400bp, with the latter resulting from non-specific priming most probably. We extracted the two bands for GA1-1, GA2-1 and GA4-1 products, labelling the 1000kb and 400bp fragments GAX-1a and GAX1-b respectively.
- The molecular weight marker that we used in all gels is HyperLadder I, which produces regularly spaced bands ranging from 200 to 10,000bp.
For the gel extraction of DNA we followed the protocol, assuming that one slice of gel is 100μl.
Gibson Assembly
We conducted Gibson Assembly of GA1, GA2, GA3 and GA4 constructs according to the protocol. The volumes of Master Mix and solutions of amplified DNA were the following:
| GA1 | GA2 | GA3 | GA4 |
|---|---|---|---|
| 15µl Master Mix | 15µl Master Mix | 15µl Master Mix | 15µl Master Mix |
| 2.5µl GA1-1a | 1.67µl GA2-1a | 2.5µl GA3-1 | 1.67µl GA4-1a |
| 2.5µl GA1-2 | 1.67µl GA2-2 | 2.5µl GA3-2 | 1.67µl GA4-2 |
| 1.67µl GA2-3 | 1.67µl GA4-3 |
Transformation
We transformed competent E.coli cells according to the following protocol. We cultured each class of transformants on four different plates.
| GA1 and GA3 | GA2 and GA4 | ||
| Plate 1 non-induced | (10μl of cell suspension) | LB + ampicillin | LB + kanamycin |
| Plate 2 non-induced | (100μl of cell suspension) | LB + ampicillin | LB + kanamycin |
| Plate 3 induced | (10μl of cell suspension) | LB + ampicillin + arabinose | LB + kanamycin + arabinose |
| Plate 4 induced | (100μl of cell suspension) | LB + ampicillin + arabinose | LB + kanamycin + arabinose |
After overnight incubation at 37°C of transformed E.coli cells, we could see colonies on only some of our plates. We examined successful plates under a fluorescence microscope to check if the cells had been transformed with a carry-through of the template DNA used in the initial PCR reactions. The risk of contaminating Gibson Assembly reactions with template DNA was fairly high because circular DNA of around 4kb was likely to co-localize with the linear PCR products.
| Type of plasmid | Expected phenotype of transformed colonies | |
| LB + Antibiotic | LB + Antibiotic + Arabinose | |
| Reflectin A1 expression plasmid desired product | No fluorescence | No fluorescence |
| I13520:pSB1A3 plasmid template DNA | No fluorescence | RFP red fluorescence |
| J69511:pSB3K3 plasmid template DNA | GFP green fluorescence | GFP green fluorescence |
These are the results of the examination of transformants:
| GA1 | one culture on LB + ampicillin 10μl plate | no fluorescence detected |
| GA2 | no colonies observable | - |
| GA3 | colonies on all plates | no fluorescence detected |
| GA4 | colonies on all plates | green fluorescence on induced and non-induced plates |
Colony PCR
We decided to conduct colony PCR of E.coli transformed with GA1 and GA3 constructs in order to confirm successful assembly of the plasmids.
- We prepared overnight liquid cultures of GA3 and GA1 transformants, both in LB + amplicillin and LB + amplicillin + arabinose medium. We picked 6 colonies, labelled a-f, from GA3 LB + ampicillin 100μl plate, and one colony, labelled x, from GA1 LB + ampicillin 10μl plate.
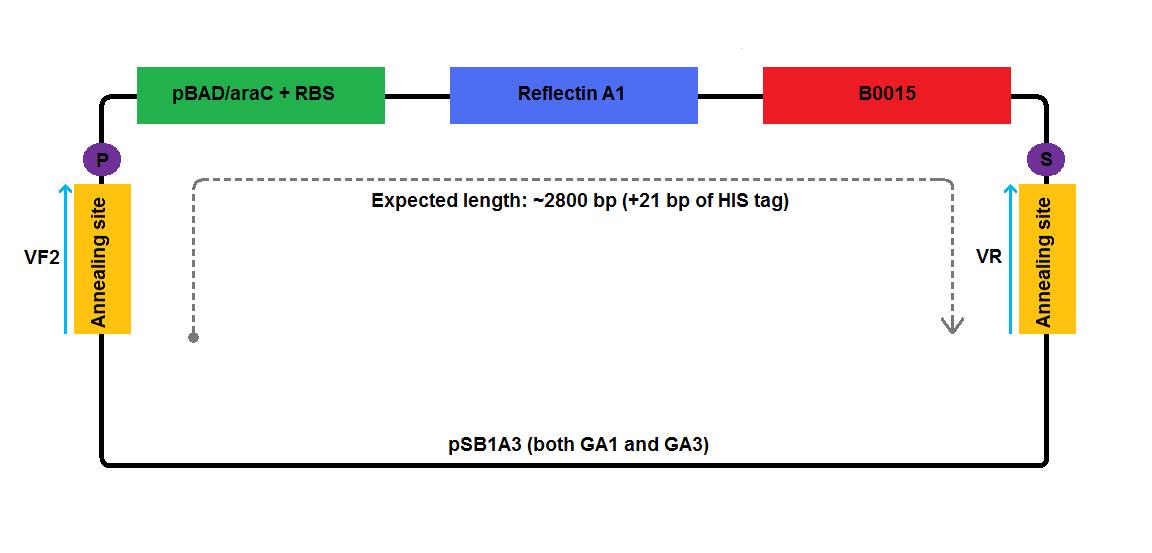
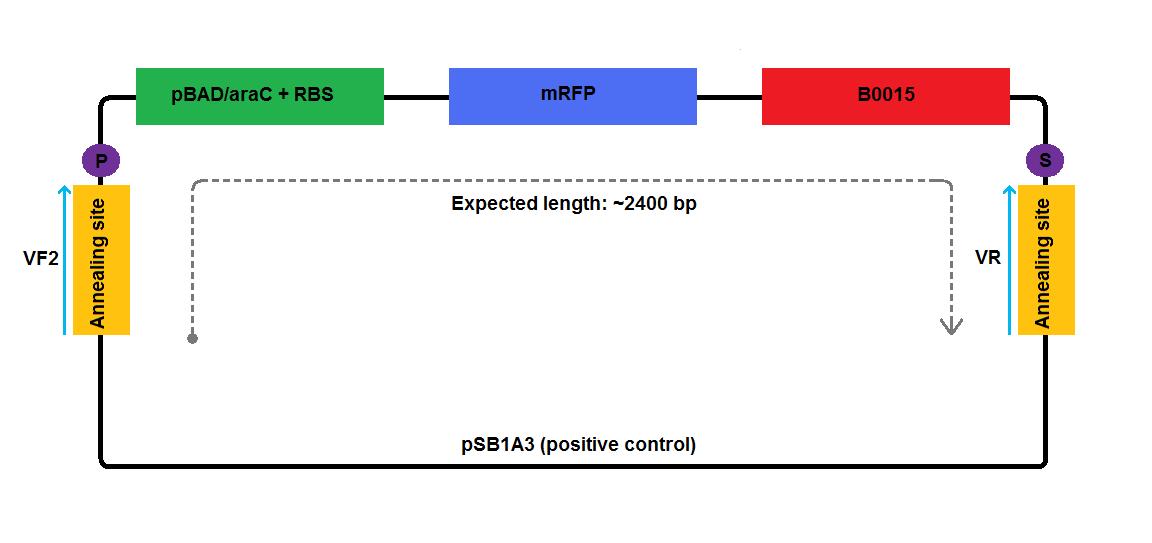
- We performed colony PCR using Taq polymerase according to the following protocol, using I13520:pSB1A3 plasmid as a positive control. We used standard [http://partsregistry.org/Part:BBa_G00101 VR] and [http://partsregistry.org/Part:BBa_G00100 VF2] primers, as indicated on the diagrams below:
| Expected lengths of products: | |
| Positive control | ~2400 bp |
| GA1 insert | ~2800 bp |
| GA3 insert | ~2800 bp |
- Time profile used in the PCR machine:
| Hold 1 | 95°C | 6 min | |
| Cycling ×30 | Denaturing | 98°C | 10 s |
| Annealing | 55°C | 30 s | |
| Elongation | 72°C | 180 s | |
| Hold 2 | 72°C | 5 min |
- As we can see from the picture of the agarose gel, c-f and x colonies carried correctly assembled plasmids. We decided to extract plasmids from and prepare glycerol stocks of these successful transformants.
- We also ran a gel with products of MiniPrep procedure to measure its effectiveness and also check if there were any differences in yield between induced and non-induced liquid cultures.
The order of samples is the following and we can clearly see that induced cultures gave smaller yield than those non-induced. This proves that replication of multi-copy plasmids acts as a burden for proliferating cells, giving lower densities of liquid cultures.
| Well | 1 | 2 | 3 | 4 | 5 | 6 | 7 |
| Sample | Hyperladder I | GA3-c | GA3-d | GA3-e | GA3-f | GA1-x | Hyperladder I |
| Culture of origin | induced | induced mixed with non-induced | induced | induced | non-induced |
pSB1AK3 or pSB1A3 backbone?
As a side experiment, we decided to determine whether constructs with pSB1A3 backbone also carry a gene for kanamycin resistance. When preparing glycerol stocks of successful transformants, we cultured GA1x and GA3c bacteria in LB + kanamycin liquid medium in addition to LB + ampicillin medium. After 4 hour incubation at 37° the turbidity of both cultures was the same.
This suggests that GA1 and GA3 contructs carry genes for both ampicillin and kanamycin resistance, which means that we were working with [http://partsregistry.org/Part:pSB1AK3 pSB1AK3] instead of [http://partsregistry.org/Part:pSB1A3 pSB1A3] backbone.
Diagnostics
In addition, we performed a series of tests to identify the cause of the low efficiency of transformation. The proposed sources of error included:
- Low efficiency of DNA gel extraction
- Unsuccessful Gibson Assembly
- Low viability of competent E.coli cells
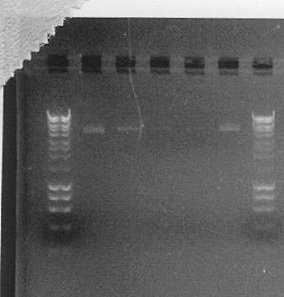
In order to check if gel extraction of DNA was successful, we ran a 1% agarose gel with samples of purified products of the initial PCR reactions. Although we could see distinct, fairly thick bands on the first gels, from which components of Gibson constructs were purified, bands on the diagnostic gel are very faint, even missing in some lanes.
This indicates that the yield of our extraction procedure was very low and probably that was the main reason why the performed transformation was fairly unsuccessful. Therefore, we decided to repeat PCR reactions, this time at higher 50μl volume, and try different conditions of the gel extraction procedure.
Assembly of GA1, GA2, GA3, GA4, GA5 and GA6 - second attempt
PCR
In the second round of PCR, we amplified fragments required for the assembly of GA1, GA2, GA3, GA4, as well as GA5 and GA6 constructs.
- We performed PCR using Phusion Hot Start DNA Polymerase in 50 μl reaction volume.
- The time profile used in the PCR machine was the following, the same as the one used before:
| Hold | 95°C | 2 min | |
| Cycling ×30 | Denaturing | 95°C | 10 s |
| Annealing | 55°C | 20 s | |
| Elongation | 72°C | 150 s |
We ran PCR products on a 1% agarose gel to separate amplified products from template DNA and primers, as well as to check how efficient and specific the amplification process was.
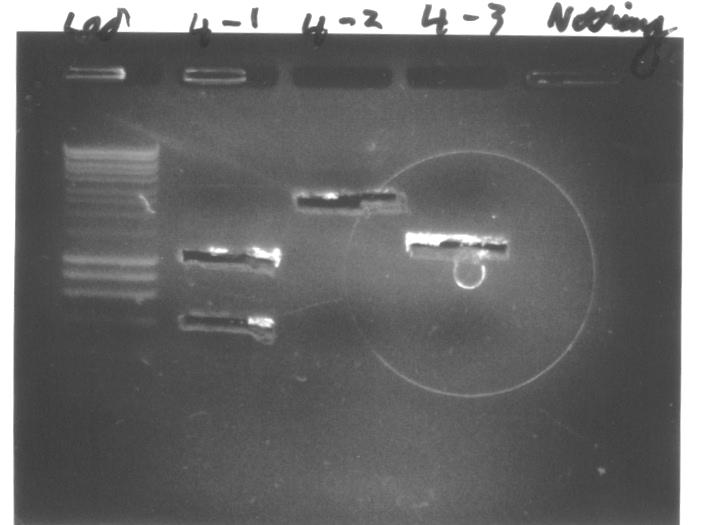
- In most cases position of a band matches the expected length of DNA fragment. The only exception are again 4-5kb GA1-2 and GA3-2 products, although the predicted length is 3.5kb.
- This time we obtained single bands on lanes with amplified reflectin, whereas we observed some additional bands on almost all lanes with amplified backbones of plasmids to be constructed. Most probably these were products of non-specific annealing, which we did not detect on the first gel due to low concentration of these additional products in 25μl reaction. Moreover, these differences emphasize the fact that the amount of non-specific products of DNA amplification can vary greatly between reactions depending on the timing of random mis-annealing events.
- All components of GA5 and GA6 constructs produced clear fairly thick bands with positions matching expected lengths. No non-specific bands on GA5-1 (Reflectin A2) and GA6-1 (Reflectin 1B) lanes were observed.
- The molecular weight marker that we used in all gels is HyperLadder I, which produces regularly spaced bands ranging from 200 to 10,000bp.
We also ran a gel with products of extraction to check how efficient the procedure was.
- We obtained clear distinct bands on each lane loaded with components of GA5 and GA6 Gibson Assembly constructs.
Gibson Assembly
We conducted Gibson Assembly of GA1, GA2, GA3, GA4, GA5 and GA6 constructs according to the protocol. The total reaction volume was 20μl.
Transformation
We transformed competent E.coli cells according to the following protocol. We cultured each class of transformants on four different plates.
| GA1, GA3 and positive control | GA2, GA4, GA5 and GA6 | ||
| Plate 1 non-induced | (10μl of cell suspension) | LB + ampicillin | LB + kanamycin |
| Plate 2 non-induced | (100μl of cell suspension) | LB + ampicillin | LB + kanamycin |
| Plate 3 induced | (10μl of cell suspension) | LB + ampicillin + arabinose | LB + kanamycin + arabinose |
| Plate 4 induced | (100μl of cell suspension) | LB + ampicillin + arabinose | LB + kanamycin + arabinose |
As a positive control, we transformed cells with BBa_13520_pSB1A3 plasmid, expecting to detect RFP fluorescence on induced plates. As a negative control, we plated non-transformed heat-shocked competent cells on LB + kanamycin and LB+ampicillin plates.
After overnight incubation at 37°C we examined plates under a fluorescence microscope to check if the cell had been also transformed with the template DNA used in the initial PCR reactions. The table presents expected phenotype of cells transformed with the correct Gibson Assembly construct or two template DNA plasmids.
| Type of plasmid | Expected phenotype of transformed colonies | |
| LB + Antibiotic | LB + Antibiotic + Arabinose | |
| Reflectin A1 expression plasmid desired product | No fluorescence | No fluorescence |
| I13520:pSB1A3 plasmid template DNA | No fluorescence | RFP red fluorescence |
| J69511:pSB3K3 plasmid template DNA | GFP green fluorescence | GFP green fluorescence |
We observed colonies on all plates except for the negative control:
| GA1 | no fluorescence detected |
| GA2 | green fluorescence of some colonies on LB + kanamycin + arabinose plates (both 100μl and 10μl) |
| GA3 | no fluorescence detected |
| GA4 | green fluorescence of some colonies on both induced and non-induced plates |
| GA5 | green fluorescence of some colonies on both induced and non-induced plates |
| GA6 | green fluorescence of some colonies on both induced and non-induced plates |
| +ve control | red fluorescence on LB + ampicillin + arabinose plate (as expected) |
Colony PCR
We conducted colony PCR of E.coli transformed with GA1 - GA6 constructs in order to confirm successful assembly of these plasmids.
- We prepared overnight liquid cultures of transformants - GA1 and GA3 in LB + ampicillin medium, while GA2, GA4, GA5 and GA6 in LB + kanamycin medium. For each class of E.coli we picked four colonies that did not show fluorescence on induced LB + antibiotic + arabinose plates.
- We performed colony PCR using Taq polymerase according to the following protocol, but we did not include any positive control. We used standard [http://partsregistry.org/Part:BBa_G00101 VR] and [http://partsregistry.org/Part:BBa_G00100 VF2] primers, as indicated on the diagrams below:
| Expected lengths of products: | |
| GA1 insert | ~2800 bp |
| GA2 insert | ~2800 bp |
| GA3 insert | ~2800 bp |
| GA4 insert | ~2800 bp |
| GA5 insert | calculate! |
| GA6 insert | calculate! |
- Time profile used in the PCR machine was the following:
| Hold 1 | 95°C | 6 min | |
| Cycling ×30 | Denaturing | 98°C | 10 s |
| Annealing | 55°C | 30 s | |
| Elongation | 72°C | 180 s | |
| Hold 2 | 72°C | 5 min |
- We obtained distinct bright bands on a majority of lanes loaded with products of colony PCR, and their position on the gel corresponds to the predicted sizes of these DNA fragments. This suggests that most colonies, except for GA3-3, GA4-3, GA6-1 and GA6-4 carried correctly assembled plasmids. Therefore, we decided to extract plasmids from and prepare glycerol stocks of successful transformants.
 "
"

