Team:Bielefeld-Germany/Modell
From 2011.igem.org

Modelling of intracellular bisphenol A degradation
To model the BPA degradation by E. coli carrying BioBricks for BPA degradation (<partinfo>K123000</partinfo> and <partinfo>K123001</partinfo>) the cell growth has to be described first. The observed growth of E. coli on (our) LB medium was [http://en.wikipedia.org/wiki/Diauxie diauxic] with two different growth phases. Cell growth is a [http://en.wikipedia.org/wiki/First_order_kinetics#First-order_reactions first-order reaction] and is mathematically described as
dX/dt = µ * X
with the specific growth rate µ and the cell count X. The specific growth rate is dependent on the concentration of the growth limiting substrate (e.g. glucose) and can be described as
µ = µmax S / (KS + S)
with the substrate concentration S, the Monod constant KS and the maximal specific growth rate µmax. Because LB medium is a complex medium we cannot measure the substrate concentration so we have to assume an imaginary substrate concentration. Due to the diauxic growth two different substrates with different Monod constants and consumption rates are necessary to model the cell growth. The amount of a substrate S can be modelled as follows
dS/dt = qS * X
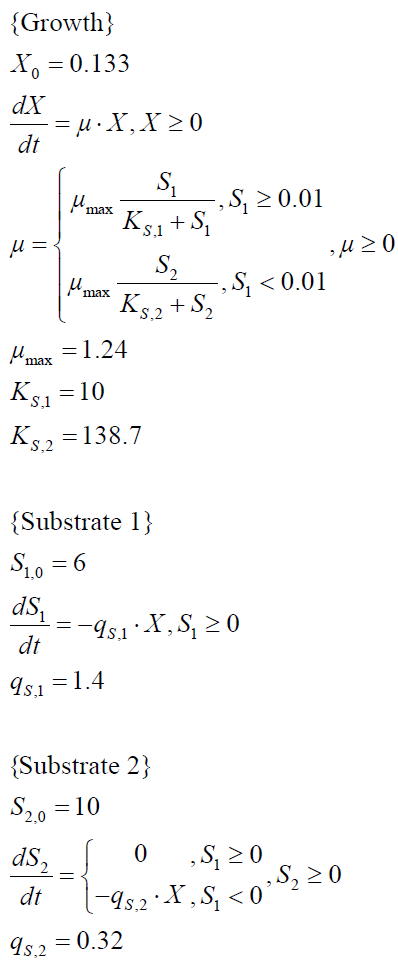
with the specific substrate consumption rate per cell qS. The whole model for the diauxic growth of E. coli on LB medium with two not measurable (imaginary) substrates looks like:
{Growth}
init x = x0
x0 = 0.133
dX/dt = µ * X
µ = if S1 >= 0.01 then µmax * S1 / (KS,1 + S1) else µmax * S2 / (KS,2 + S2)
µmax = 1.24
KS,1 = 10
KS,2 = 138.7
limit µ >= 0
limit X >= 0
{Substrate 1}
init S1 = S1,0
S1,0 = 6
dS1/dt = -qS,1 * X
qS,1 = 1.4
limit S1 >= 0
{Substrate 2}
init S2 = S2,0
S2,0 = 10
dS2/dt = if S1 >= 0.01 then 0 else -qS,2 * X
qS,2 = 0.32
limit S2 >= 0
The specific BPA degradation rate per cell qD is modelled with a Michaelis-Menten like kinetics. In the beginning of the cultivations, when E. coli growths on the "good" imaginary substrate S1, there is no BPA degradation observed. When this substrate is consumed, the BPA degradation starts so the model looks like as follows:
{BPA degradation}
init BPA = BPA0
BPA0 = 0.53
dBPA/dt = if S1 >= 0.01 then 0 else -qD * X
qD = qD,max * BPA / (KBPA + BPA)
qD,max = 0.013
KBPA = 1.6e-8
limit BPA >= 0
The modelling was done with the software [http://www.berkeleymadonna.com/ Berkeley Madonna] using [http://en.wikipedia.org/wiki/Runge–Kutta_methods#Common_fourth-order_Runge.E2.80.93Kutta_method common fourth-order Runge-Kutta] method to solve the equations. The model was fitted to the measured data by the function "curve fit" in Berkeley Madonna to calculate the constants etc.
 "
"

