Team:ETH Zurich/Modeling/Microfluidics
From 2011.igem.org

Contents |
Reaction-Diffusion Model
In our first spatiotemporal model, we wanted to find out if a toxic molecule gradient would be formed at all. The idea was to generate it as an equilibrium of toxic molecule diffusion out of the reservoir into our channel and toxic molecule degradation by the cells in it. In order to answer this question, we modeled a spatiotemporal reaction-diffusion system in 3D with COMSOL Multiphysics.
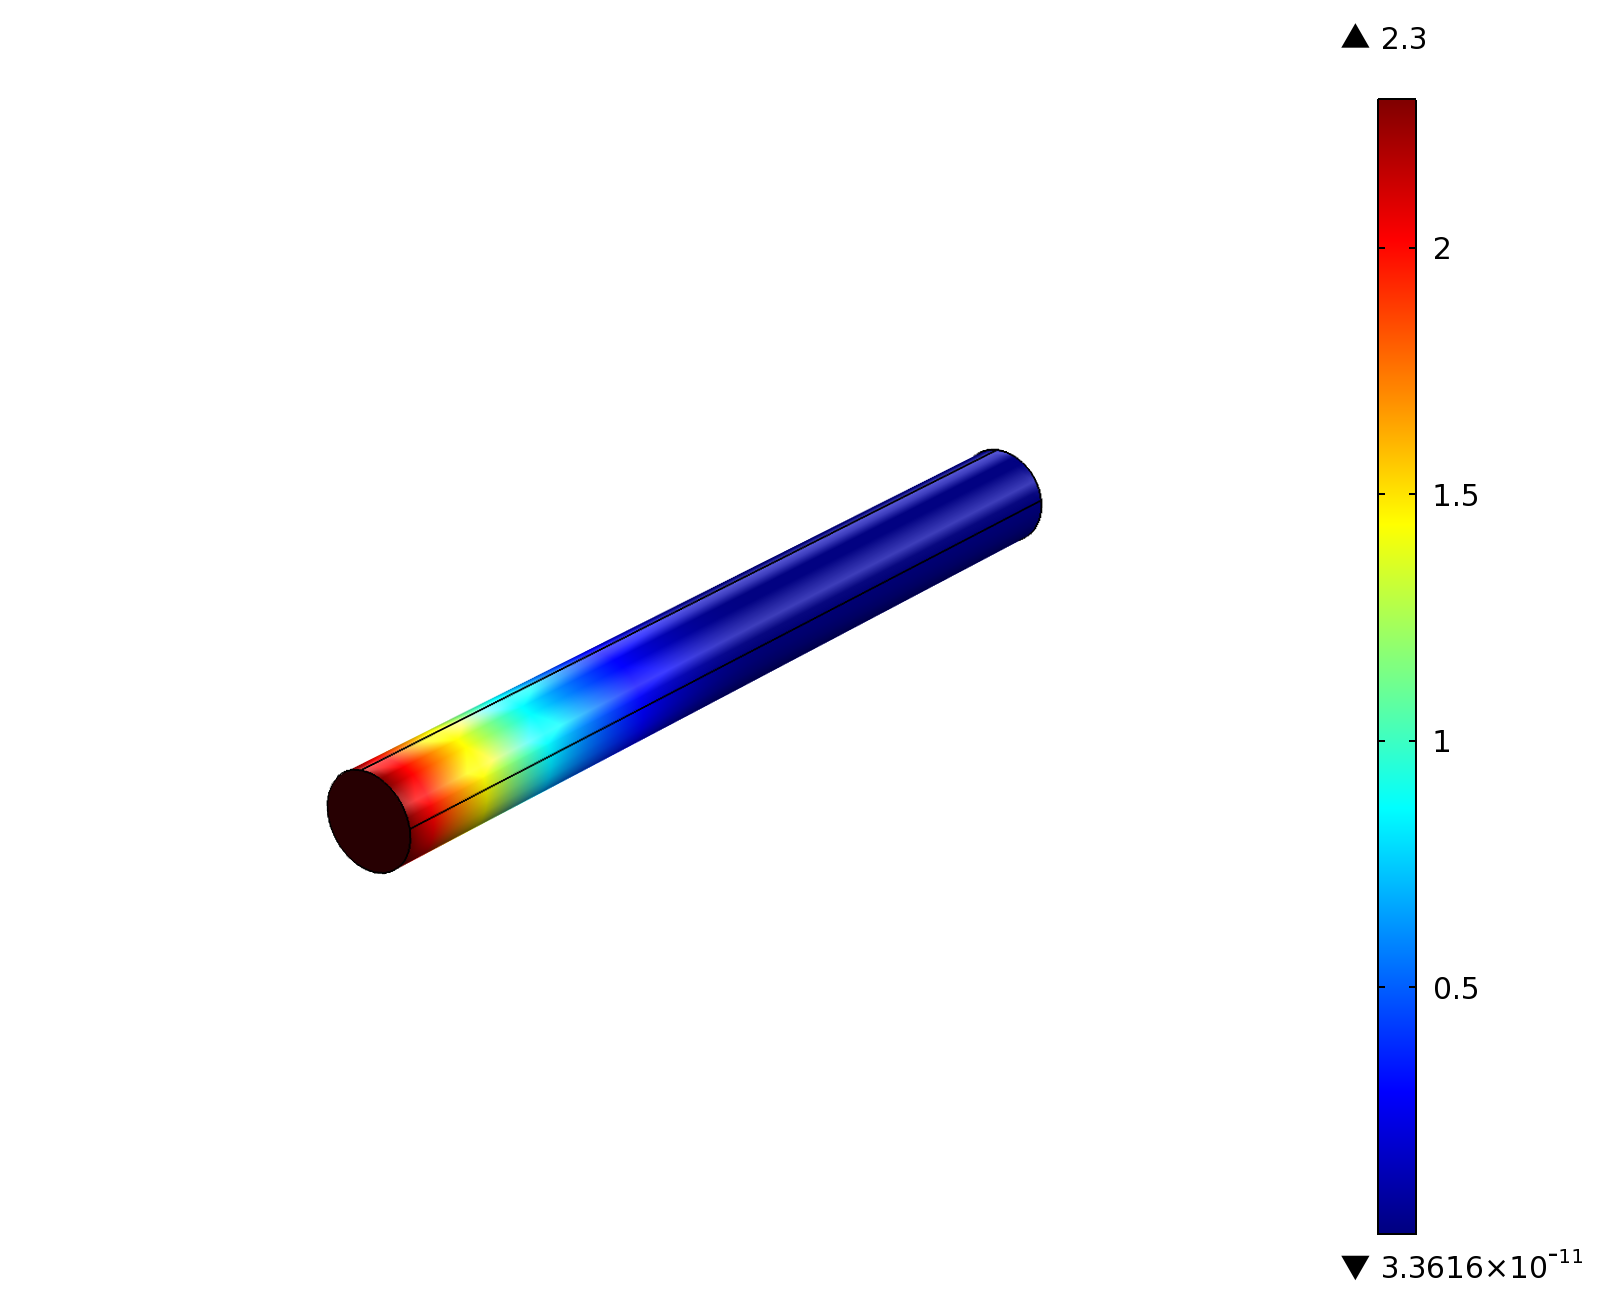
In essence, the model suggests that we indeed can create a useful gradient that goes to steady state after only 6 hours:
|
|
Read on to see how we derived the partial differential equation that is the basis for this model and how we simulated it.
Overview
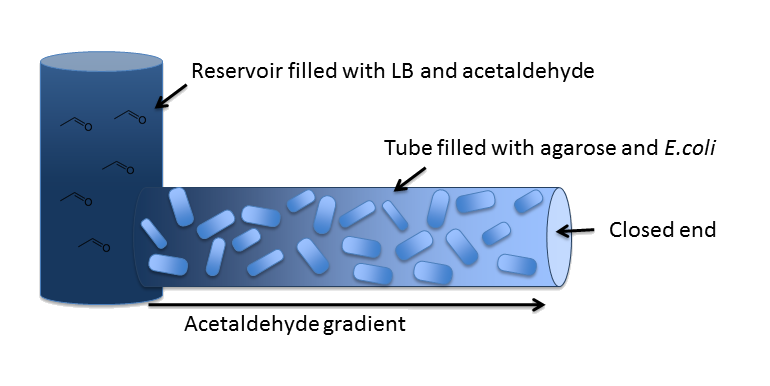
In our inital model, we chose a zend = 5 cm long cylindrical channel with a radius of RChannel = 1 mm (or equivalently 2 mm diameter). This channel is connected to a reservoir filled with medium and the toxic molecule. For the purpose of modeling the diffusion and degradation of the toxic molecule in the channel, we assumed that the reservoir has constant toxic molecule concentration (or equivalently has infinite size).
In our system, we degrade a toxic substance diffusing from a reservoir into a block of E. coli cells immobilized in agarose in order to generate a toxic substance gradient. The two substances we consider in our model are acetaldehyde and xylene. In our first microfluidics model we conducted a feasibility study and thus only investigated acetaldehyde degradation.
Reaction-Diffusion Equation
In general, an acetaldehyde-based reaction-diffusion system for our uniformly SmoColi-filled channel has the following form:
Diffusion
First of all, we have to model diffusion of acetaldehyde from the reservoir to the closed end of the microfluidics channel. The relevant diffusive term is the one for isotropic diffusion, i.e. diffusion that is uniform in all directions:
We assume that the experiment is conducted at pH 7 and 25°C. The relevant diffusion parameter, DAcAl, is for acetaldehyde diffusion in water at 25°C. However, since the diffusion in our system happens in agarose, we scaled the diffusion constant by a factor CAgarose.
Note: For parameter values and references click on a parameter or see the microfludics model section on the parameters page.
Degradation
Cell Density
In order to able to determine how much acetaldehyde our smoColi cells are able to degrade, we first need to determine the cell density of the immobilized cells in agarose. For this calculation, we assume we have a cell culture with OD600 with which we fill the channel. Parameter-wise, to determine the relative cell density in the channel voume, we need to know:
- the mean cell density in [cells/volume] at OD600=1, cdOD600, undiluted, and
- the mean cell volume of a single cell, VeColi.
A parameter we can choose suitably is the dilution of the cells in agarose, cDilution. Then we can calculate the relative cell density cdRelOD600, diluted in the smoColi-agarose-filled microfluidics channel:
Enzymatic Degradation
Now that we know what the cell concentration in the channel is, we can model the degradation of the toxic molecule by the cell culture in agarose. This process, together with diffusion of more toxic molecules from the reservoir, will finally generate the toxic molecule gradient. From here on, we will assume that under laboratory conditions in a closed reservoir, acetaldehyde is stable and thus there is not extracellular degradation of it. It is important to note that this assumption only holds for closed reservoirs, as acetaldehyde evaporates easily and would escape an open reservoir.
In our enzymatic degradation model, we assume diffusion into the cells is fast compared to the degradation process. The degradation process then is modeled using Michaelis-Menten enzyme reaction kinetics:
The constants are the usual ones for Michaelis-Menten-type reactions:
- vmax,AcAl is the maximum reaction rate, i.e. the rate the toxic molecule degradation reaction occurs with at saturation point, and
- KM,AcAl is the Michaelis Menten constant, i.e. the acetaldehyde concentration at which the reaction rate is half of vmax,AcAl
However, we have to scale the reaction according to the cell density cdOD600, diluted, as not the entire space is filled with cells.
Estimation of vmax,AcAl
For the degradation of acetaldehyde we only had direct literature values for KM,AcAl, but not for vmax,AcAl. However, we did find values for the specific activity Kcat,AcAl of acetaldehyde dehydrogenase in E. coli, which we used to estimate vmax,AcAl with the following equation:
Here, [E]T is the total enzyme concentration of acetaldehyde dehydrogenase. This value we derived from the concentration of acetaldehyde dehydrogenase in cell extract, which we in turn calculated by estimating the number of acetaldehyde dehydrogenase enyzmes nADH in a single E. coli cell.
The number of acetaldehyde dehydrogenase enzymes nADH in a single E. coli cell was estimated from diluted cell-free extract with dilution ratio dilExtract and diluted concentration of [ADH]Extract.
Model
Now that we have values for all of the parameters, we can finally combine both the diffusive term and the local reaction term into the spatiotemporal reaction-diffusion (or in our case, degradation-diffusion) system:
Note that in our geometry, the channel extends in z-direction, i.e. the third component of z = ( x, y, z ).
However, we are still missing the initial condition at t=0 and the boundary conditions for both the constant acetaldehyde concentration at the reservoir and the channel walls. We start with the initial condition, which is that there is no acetaldehyde in the agarose-filled channel initially at t=0:
The first boundary condition we consider is the one that enforces constant acetaldehyde at the reservoir, which is located at z = 0 ([http://en.wikipedia.org/wiki/Dirichlet_boundary_condition Dirichlet Boundary Condition]):
Next, we enforce that no transport of acetaldehyde occurs across the channel walls along the channel's axis ([http://en.wikipedia.org/wiki/Neumann_boundary_condition Neumann Boundary Condition]):
Finally, we enforce that no transport of acetaldehyde occurs across the wall at the channel's end ([http://en.wikipedia.org/wiki/Neumann_boundary_condition Neumann Boundary Condition]):
Results: Simulation
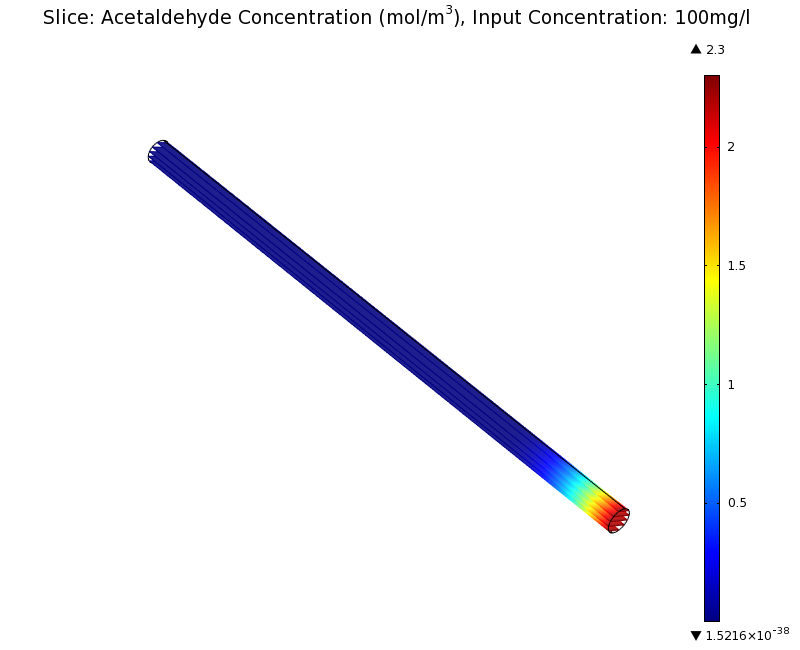
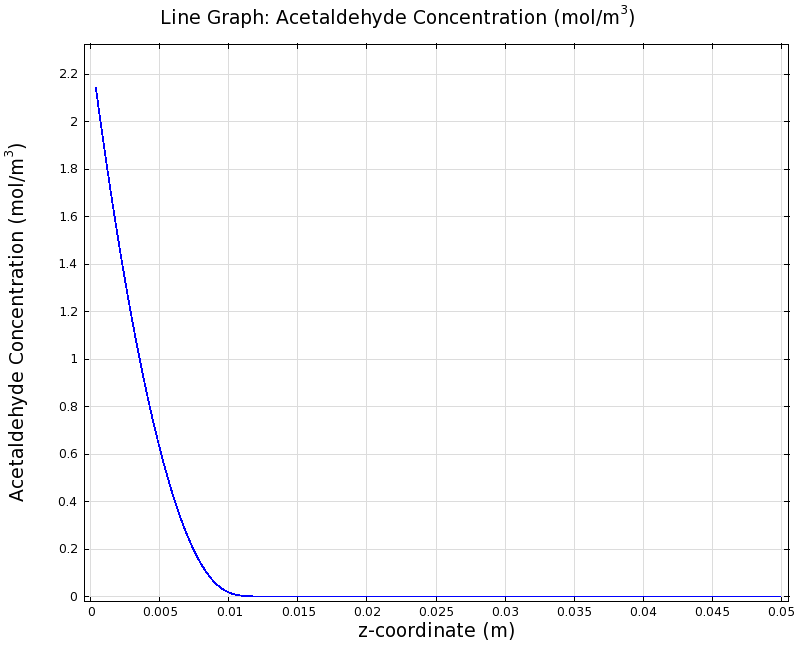
To see if we can indeed create an acetaldehyde gradient, we first solved for the gradient steady state in the channel. We chose an acetaldehyde concentration of 100 mg/l for the reservior in these simulations.
Steady State
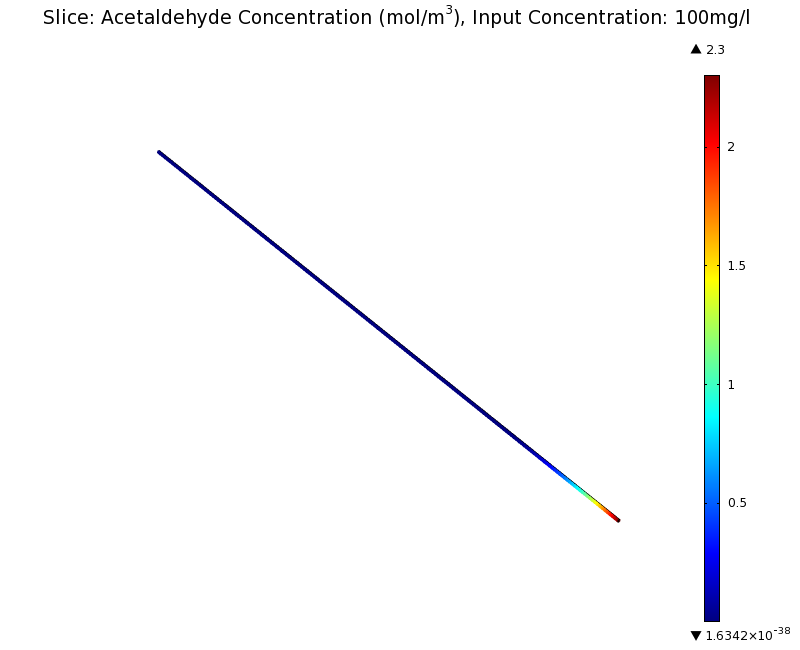
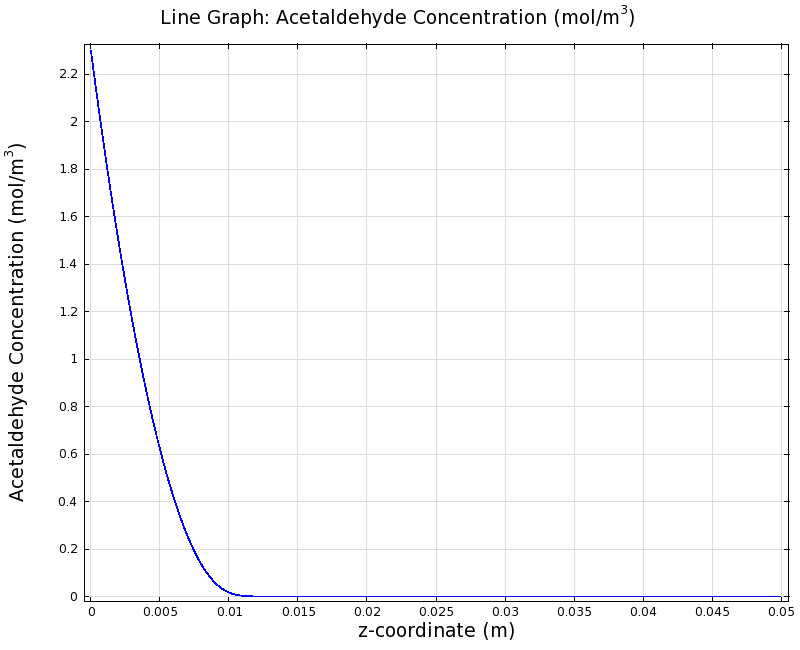
Simulation for 100 mg/l of acetaldehyde, standard channel diameter (2mm)
Indeed our SmoColi cells in the model are able to generate a gradient by working (degrading acetaldehyde) against diffusion (which brings in more acetaldehyde). Close to the acetaldehyde input, the degradation mechanism is operating around saturation point, thus the close-to-linear gradient near the input. As more acetaldehyde is degraded further away, the gradient levels off as the degradation mechanism is not running at saturation point anymore.
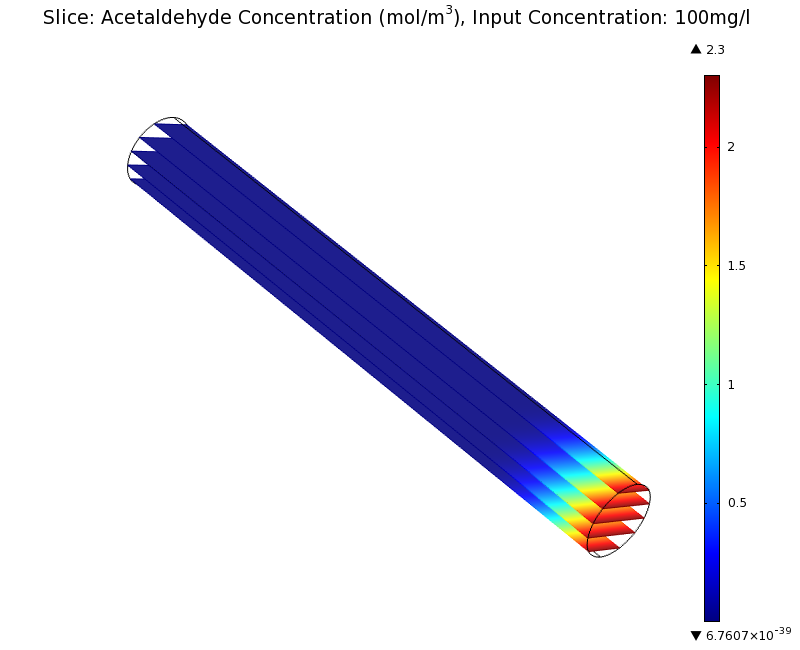
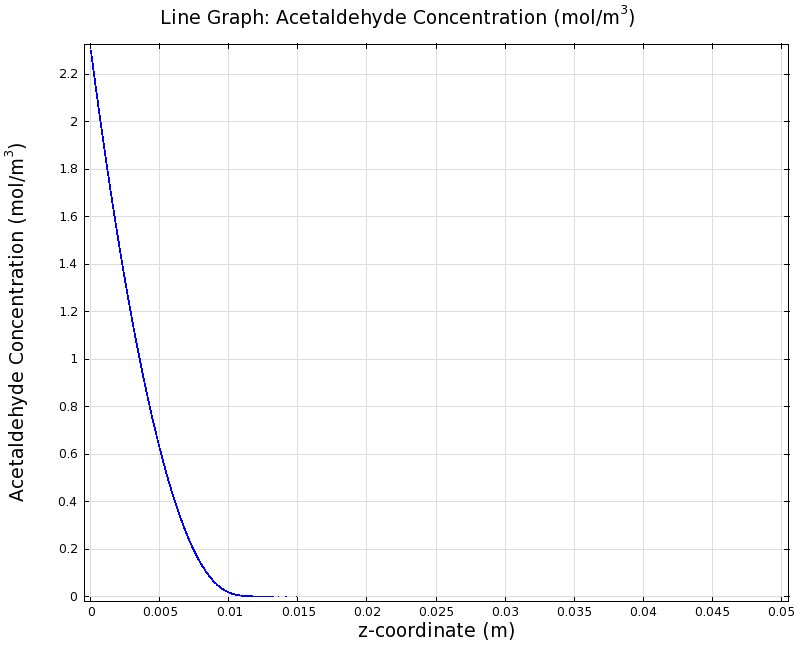
Our belief was that the channel diameter should not change the position of the GFP peak, i.e. that the produced gradient should remain the same for different channel diameters. To verify our intuition, we simulated the steady state of the acetaldehyde gradient in channels with different diameters:
Simulation for 100 mg/l of acetaldehyde, 0.1x standard channel diameter (200μm)
Simulation for 100 mg/l of acetaldehyde, 3x standard channel diameter (6mm)
We can see that the diameter indeed does not influence the mean dynamics of the acetaldehyde gradient (observant readers will notice that the concentration at the end of the channel is not exactly the same - this effect is a result of numerical imprecision). We note that there may be irregular behavior for very thin channels, since there will be only very few cells and their local concentration may vary. For the channel diameters we chose above, a mean field approximation should be sufficient though, as the amount of cells involved in the degradation is sufficiently high.
Dynamics
We were also interested in finding out the time scale which is needed to create the gradient. Therefore we also analyzed the dynamics in a spatiotemporal reaction (degradation) - diffusion simulation. As we can see above for the chosen acetaldehyde concentration of this simulation, the gradient primarily is formed in the first 1.5 centimeters of the channel. Therefore, we zoomed in on this part to get a closer look at the dynamics.
We simulated the system for 8 hours in total and now take a look at how long it takes for the gradient to form:
 Video 2: 1D gradient formation profile over 8 hours, starting from zero acetaldehyde in the channel, zoomed in on z = [0cm, 1.5cm]. 1D surface-averaged acetaldehyde concentration in z-axis direction, in mol/m3. Channel width: 2 mm, reservoir acetaldehyde concentration: 100 mg/l Press play to start video! |
We can clearly see that the gradient converges to steady state after 8 hours and that it only changes very slowly anymore in the last 2 to 3 hours. Thus we deemed diffusion speed of acetaldehyde to not be a limiting factor for experimental design.
Updated Model
In the single-cell model, we noticed that the upper range of detection of our circuit might be toxic to our cells. This lead us to reassess the parameters we assumed in the model. After careful consideration we adjusted some of them to reflect more realistic assumptions as detailed in the toxicity and parameter tuning section of the single-cell model (also see the parameter page).
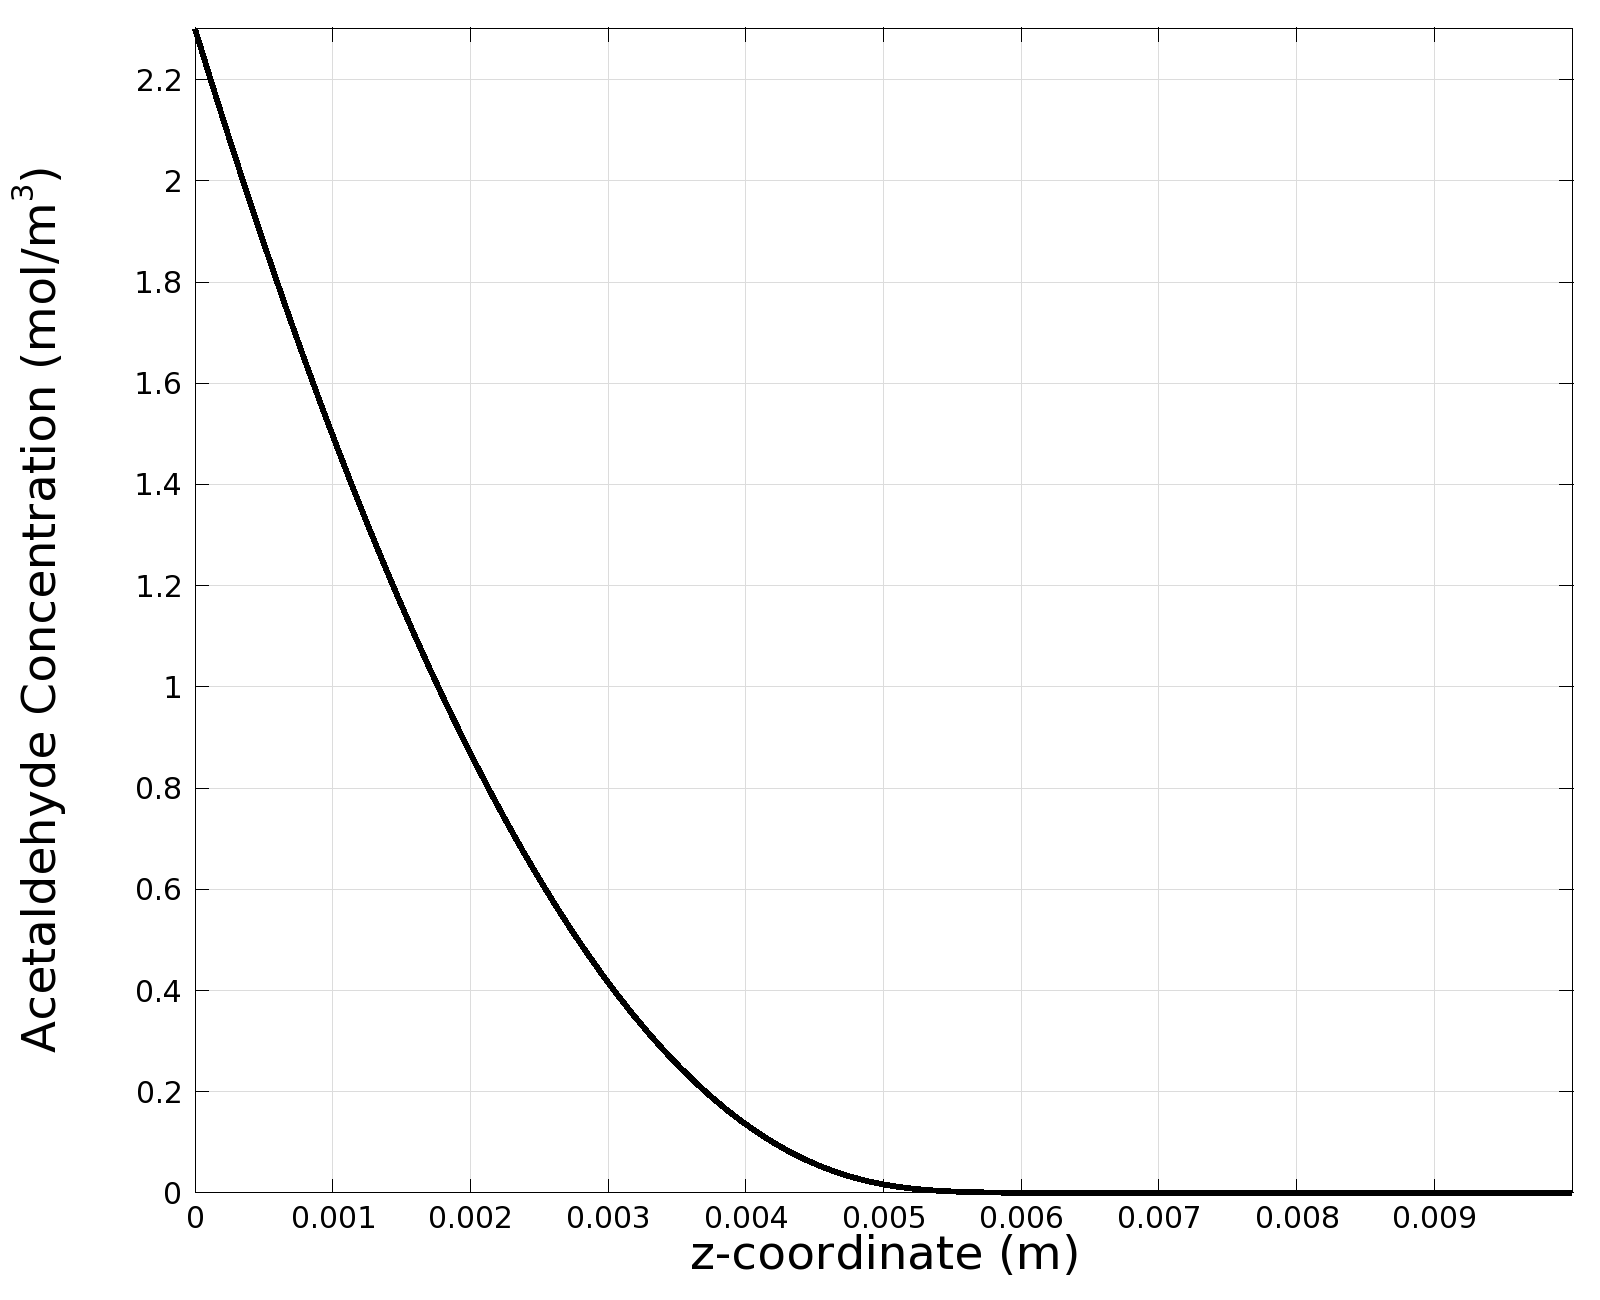
This means that the band is created by the bandpass for lower concentrations. However, the degradation mechanism is still the same, thus to avoid toxic concentrations at the input we also should shorten the channel, in our case to 1cm. In order to keep a reasonable detection range, we increased cell density to an OD600 of around 0.5. We then re-ran the simulation of the reaction-diffusion model for the updated geometry, as seen below:
Steady State Simulation
Simulation for 100 mg/l of acetaldehyde, new channel length (1cm) and diameter (1mm)
We can see clearly from Figures 7 and 8 that even with the shorter channel, we can still create a meaningful gradient. This is due to the higher concentration of cells within the channel. Here we also note that if more problems due to toxicity arise, they may be alleviated by decreasing cell density. This in turn then decreases the steepness of the gradient.
Dynamics Simulation
 "
"

