Team:Bielefeld-Germany/Results/S-Layer/CspB CH
From 2011.igem.org


Contents |
CspB from Corynebacterium halotolerans
CspB without TAT-sequence and lipid anchor
Cultivation and protein expression
For characterization, PS2 also named CspB [http://partsregistry.org/Part:BBa_K525222 (K525222)] was fused with a monomeric RFP [http://partsregistry.org/Part:BBa_E1010 (BBa_E1010)] using Gibson assembly.
The mRFP|CspB fusion protein was overexpressed in E. coli KRX after induction of T7 polymerase by supplementation of 0.1 % L-rhamnose using the autoinduction protocol.
Identification and localization

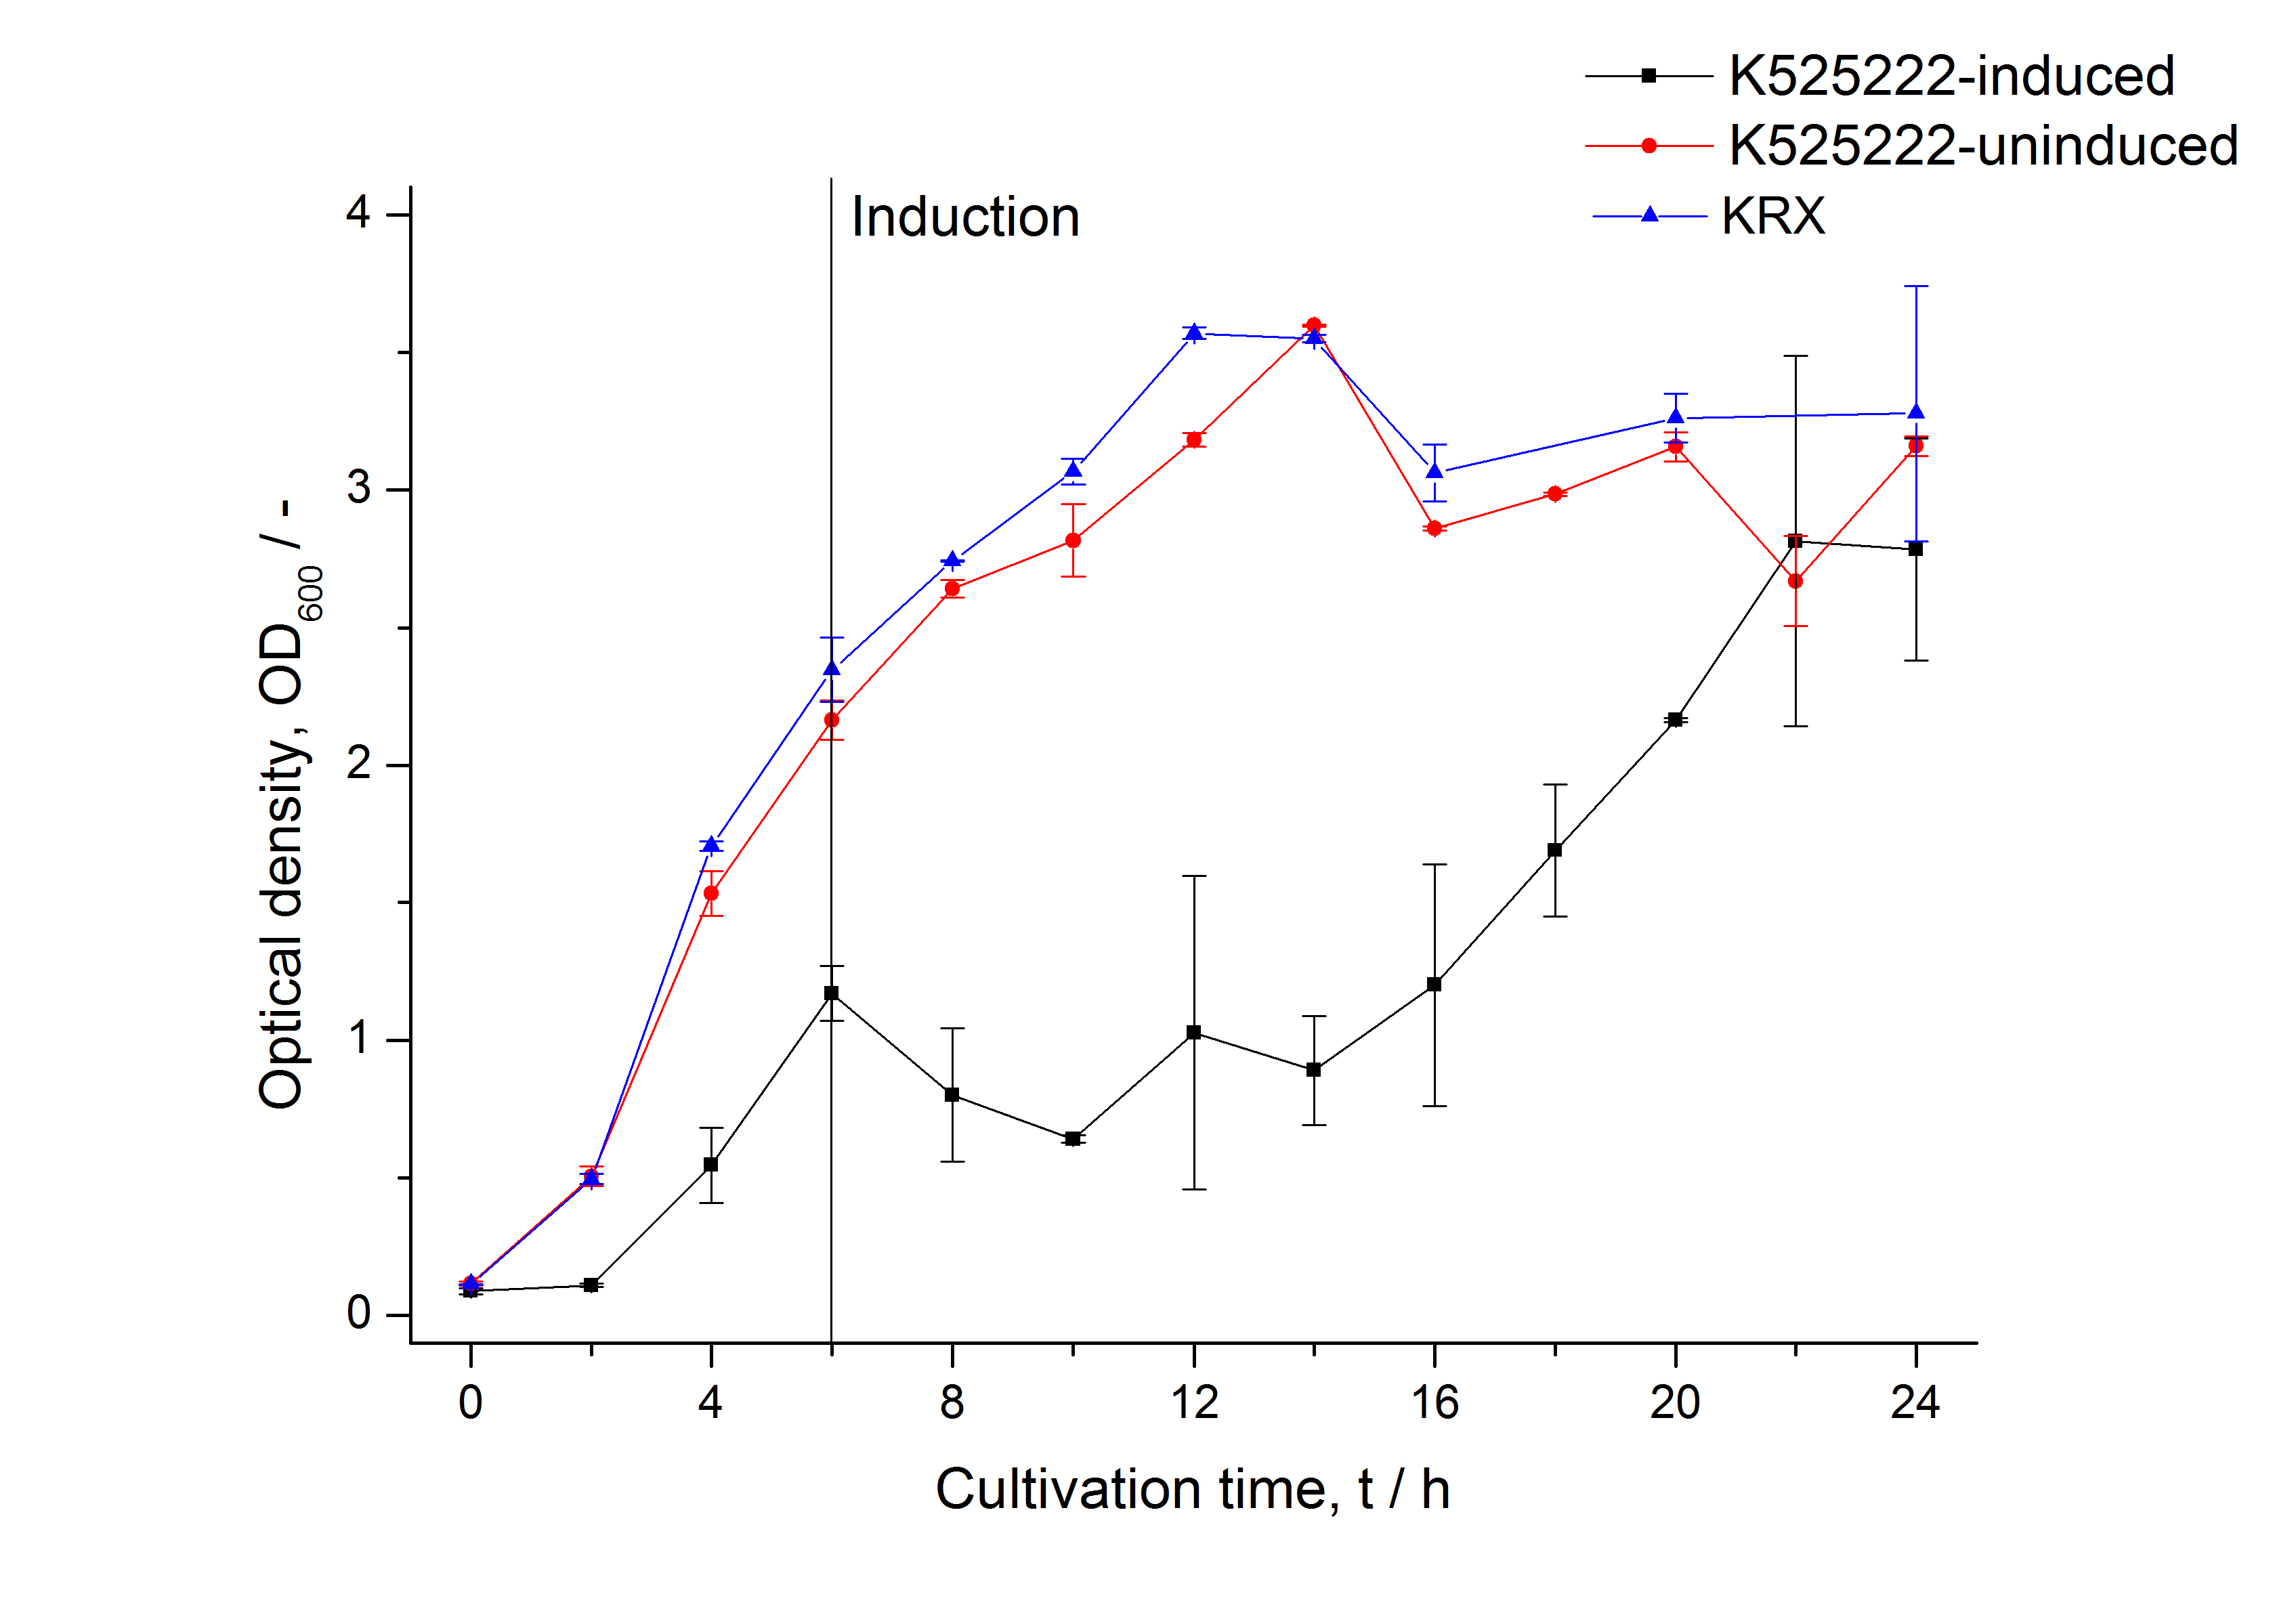
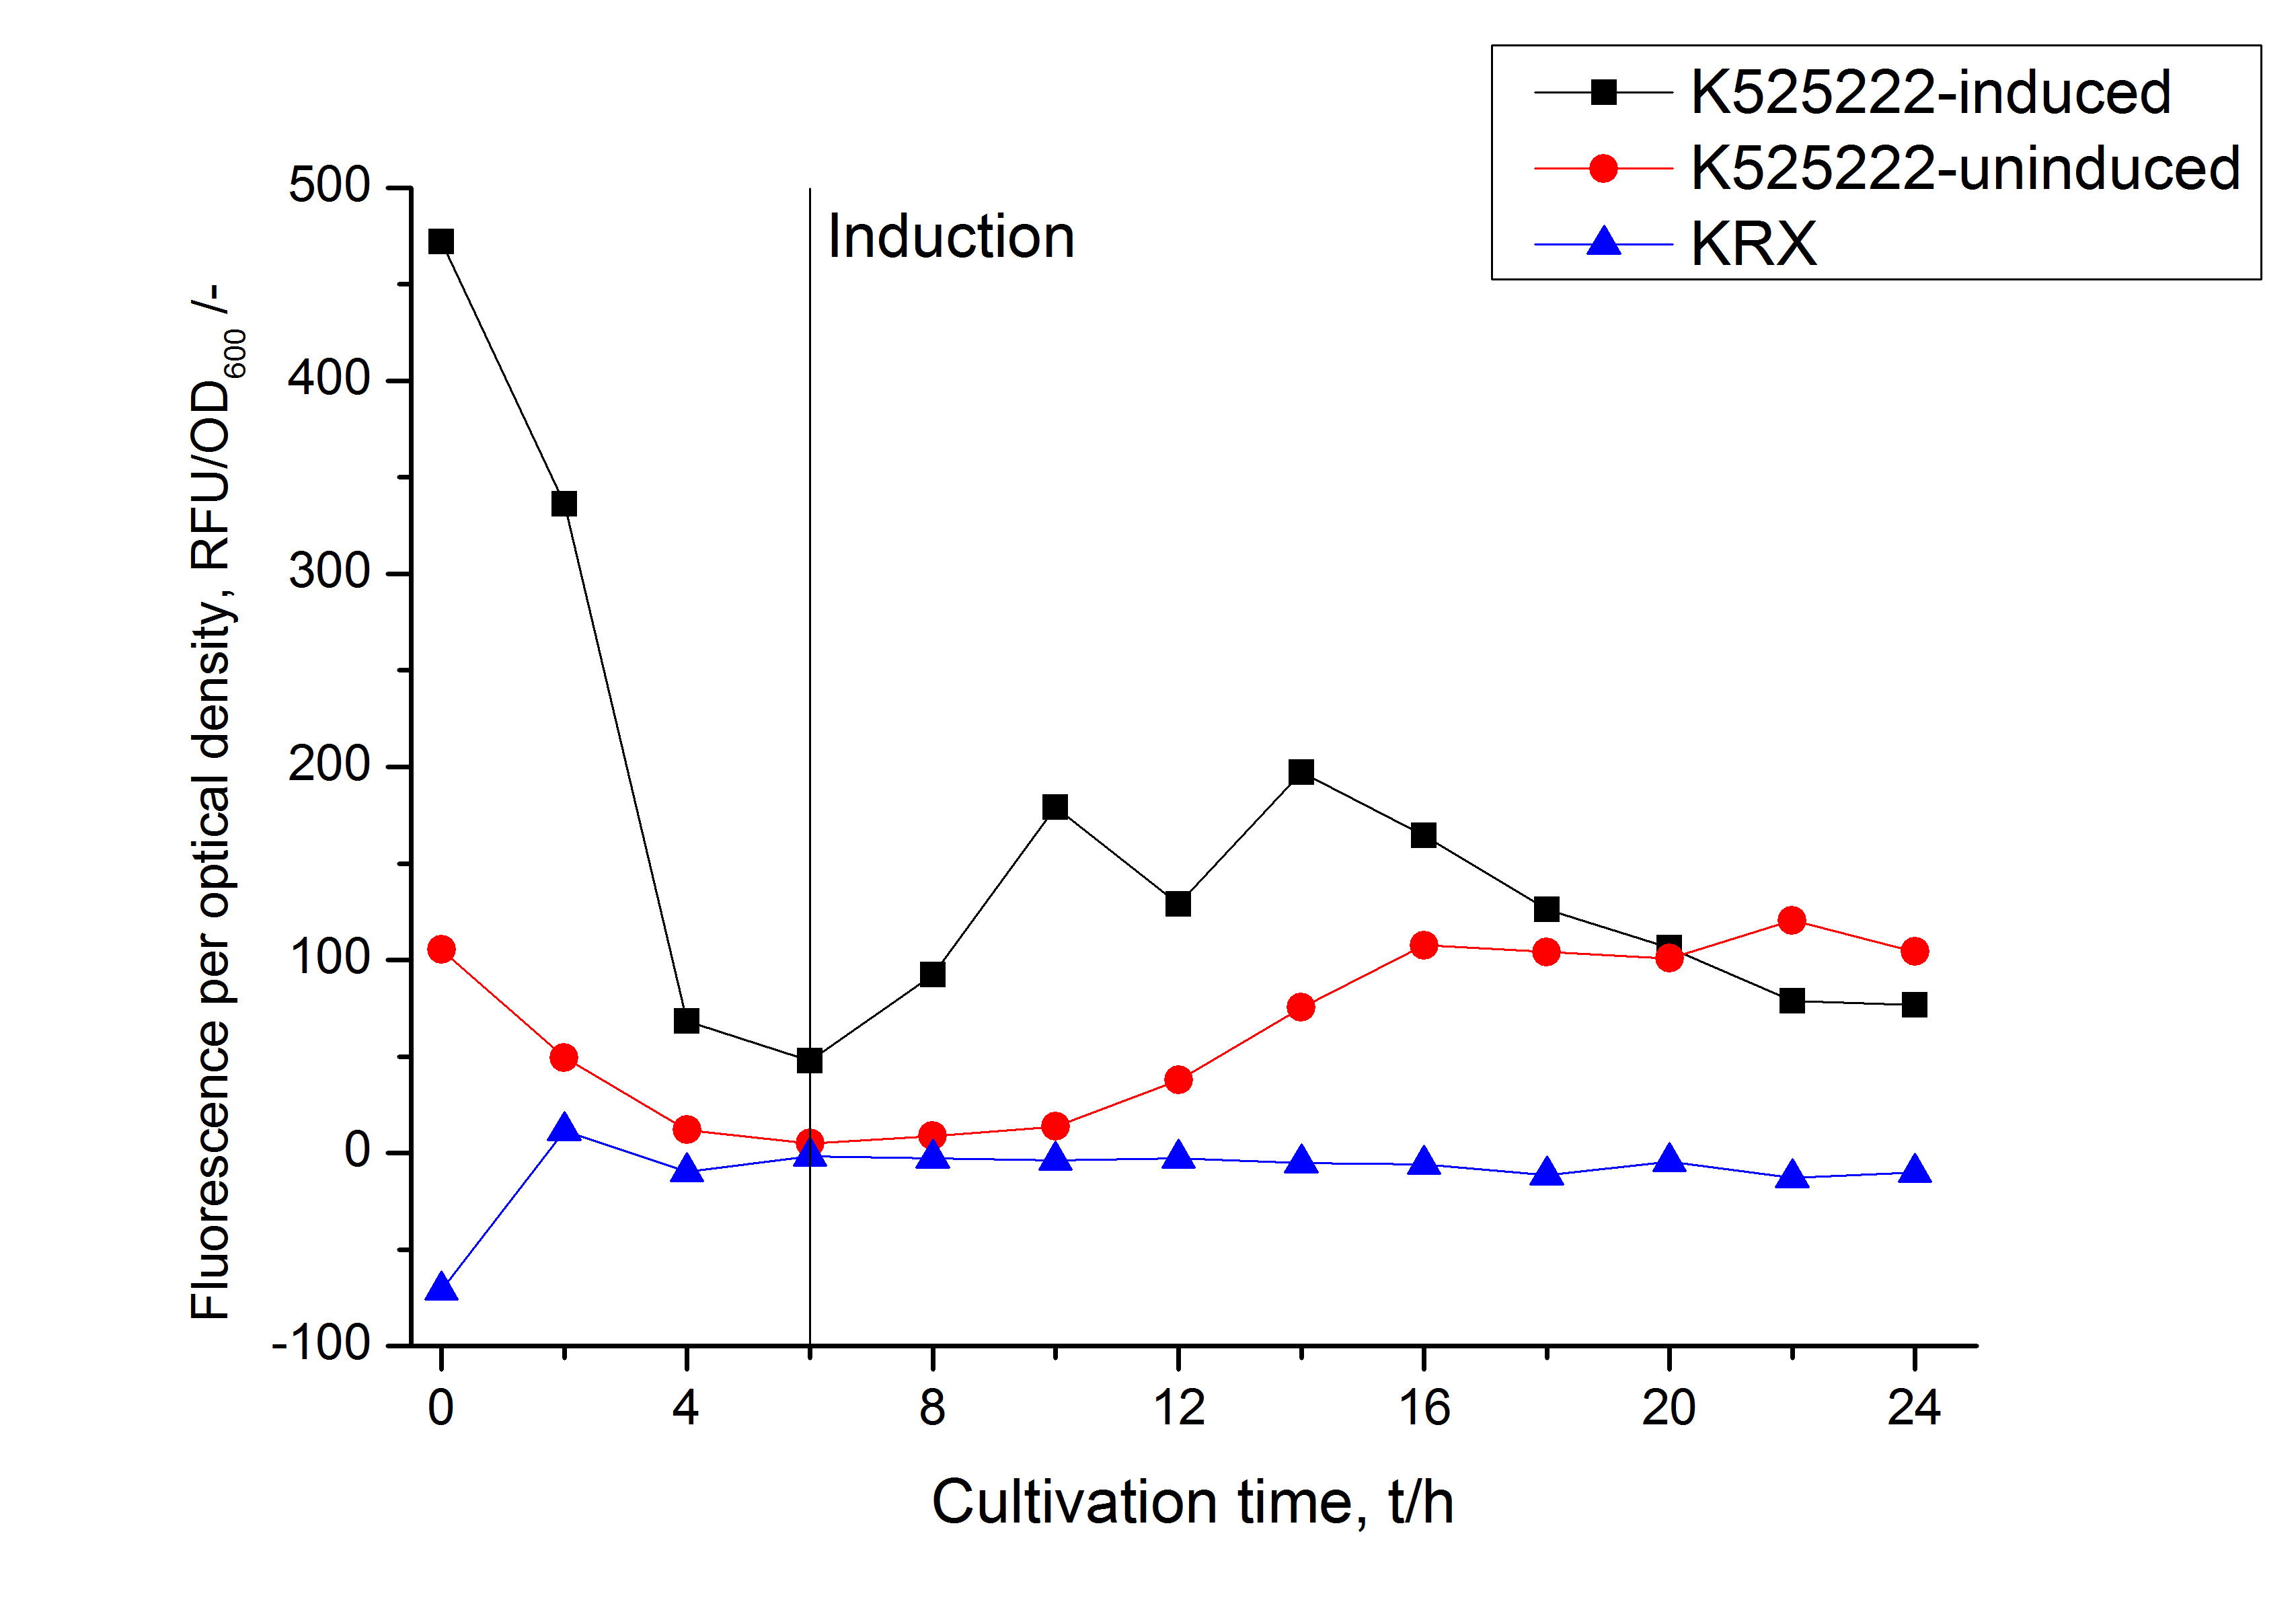
After a cultivation time of 18 h the mRFP|CspB fusion protein was localized in E. coli KRX. Therefore a part of the produced biomass was mechanically disrupted and the resulting lysate was washed with ddH2O. Then the lysate was treated with ionic, nonionic and zwitterionic detergents to release the mRFP|CspB out of the membranes, if it integrates. The periplasm was detached of a part of the biomass by using an osmotic shock. The fluorescence in all cultivation fractions, the fluorescence in the lysis and wash fraction show that the fusion protein is water soluble and does not sediment during centrifugation. Together with the absence of fluorescence in the detergent fractions this verifies that the fusion protein is not integrated into the cell membrane (Fig. 3) and is not forming inclusion bodies. In comparison with the mRFP fusion protein of <partinfo>K525224</partinfo>, which has a TAT-sequence, a minor relative fluorescence in all cultivation and detergent fractions was detected (Fig. 3). Together with the decreasing RFU after 14 h of cultivation (Fig. 2) this result indicates the postive effect of the TAT-sequence on the protein stability. This could be due to a digestion of <partinfo>K525222</partinfo> by proteases in the cytoplasm.
MALDI-TOF analysis was used to identify the location of the fusion protein in different fractions. Fractions of medium supernatant after cultivation, periplasmatic isolation, cell lysis and following denaturation in 6 M urea were loaded onto a SDS-PAGE. After denaturation with 6 M urea the remaining pellet (after centrifuging 15,000 g for 30 min) was washed with 2 % (v/v) Triton X-100, 2 % SDS (w/v). This fraction was also loaded onto the SDS-PAGE and fragments of the gel were measured with MALDI-TOF.

The following table shows the sequence coverage (in %) of our measurable gel samples with the amino acid sequence of fusion protein CspB/mRFP [http://partsregistry.org/Part:BBa_E1010 (BBa_E1010)].
| number of gel sample | sequence coverage (%) | |
|---|---|---|
| 1 | 0.0 | |
| 2 | 0.0 | |
| 3 | 0.0 | |
| 4 | 0.0 | |
| 5 | 0.0 | |
| 6 | 0.0 | |
| 7 | 0.0 | |
| 8 | 0.0 | |
| 9 | 0.0 | |
| 10 | 0.0 | |
| 11 | 0.0 | |
| 12 | 14.6 | |
| 13 | 9.3 | |
| 14 | 6.3 | |
| 15 | 0.0 | |
| 16 | 0.0 | |
| 17 | 0.0 | |
| 18 | 0.0 | |
| 19 | 0.0 | |
| 20 | 1.0 | |
| 21 | 0.0 | |
| 22 | 0.0 | |
| 23 | 0.0 | |
| 24 | 0.0 | |
| 25 | 0.0 |

Fig. 5 shows these data. The gel samples were arranged after estimated molecular mass cut out from the gel. As expected, no sequence coverage was found in the periplasmatic fraction, due to absent TAT-sequence located at the amino-terminus. Little sequence coverage was found in the fraction of supernatant of the media, indicating that the protein can not be transported to the periplasm and thus secretion into the medium does not take place. The denaturation fraction and the Triton X-100 fraction show no or very few sequence coverage, however the lysis fraction shows significant higher sequence coverage. Both results indicate that the fusion protein is solely present in the cytoplasm and thus only identified in the lysis fraction. Fig. 5 and Fig. 6 show that the protein can be found mainly in the lysis fraction, but in smaller amounts in the periplasmatic and the media fraction as well, which can be explained due to the absence of the lipid anchor. The anchor normally binds to the cell membrane, so no protein is found in other fractions than the lysis fraction.
To obtain more specific informations about the location of the S-layer fusion protein, after comparison with same treated fraction of E. coli KRX all gel bands in a defined size area were cut out of the gel and analysed with MALDI-TOF. Results are shown in Fig. 6.

MALDI-TOF measurement shows sequence coverage in the supernatant fraction of the cultivation, the periplasmatic fraction and the lysis fraction, indicating that the fusion protein of <partinfo>K525222</partinfo> and [http://partsregistry.org/Part:BBa_E1010 BBa_E1010] without TAT-sequence and lipid anchor is not only found in the cytoplasm. The periplasmatic isolation does destroy a few complete cells, which could lead to the sequence coverage found in the periplasmatic fraction. The gel lanes in the periplasmatic fraction are clearly less intense, the protein concentration is very low compared to the lysis fraction. Sequence coverage in the media fraction shows, that the protein is probably secreted into the media. Cell lysis could lead to this effect. The sequence coverage in a MALDI-TOF analysis does not automatically correlate with protein concentrations. Small amounts of proteins can give the same results when cutted out of a clean protein band of a single protein. When looking at the intensity of the analysed gel pieces it can be summarized, that there is some CspB found in the periplasm and the culture supernatant but most of the protein stays in the cytoplasm which was the expected result. No fluorescence and sequence coverage was found in the cell membrane fractions, giving another proof that the lipid anchor from Corynebacterium binds to the cell membrane of E. coli.
CspB without TAT-sequence and with lipid anchor
Cultivation and protein expression
For characterization the modified CspB [http://partsregistry.org/Part:BBa_K525223 (K525223)] gen was fused with a monomeric RFP ([http://partsregistry.org/Part:BBa_E1010 BBa_E1010]) using Gibson assembly.
The fusion protein was overexpressed in E. coli KRX after induction of T7 polymerase by supplementation of 0,1 % L-rhamnose using the auinduction protocol.
Identification and localization
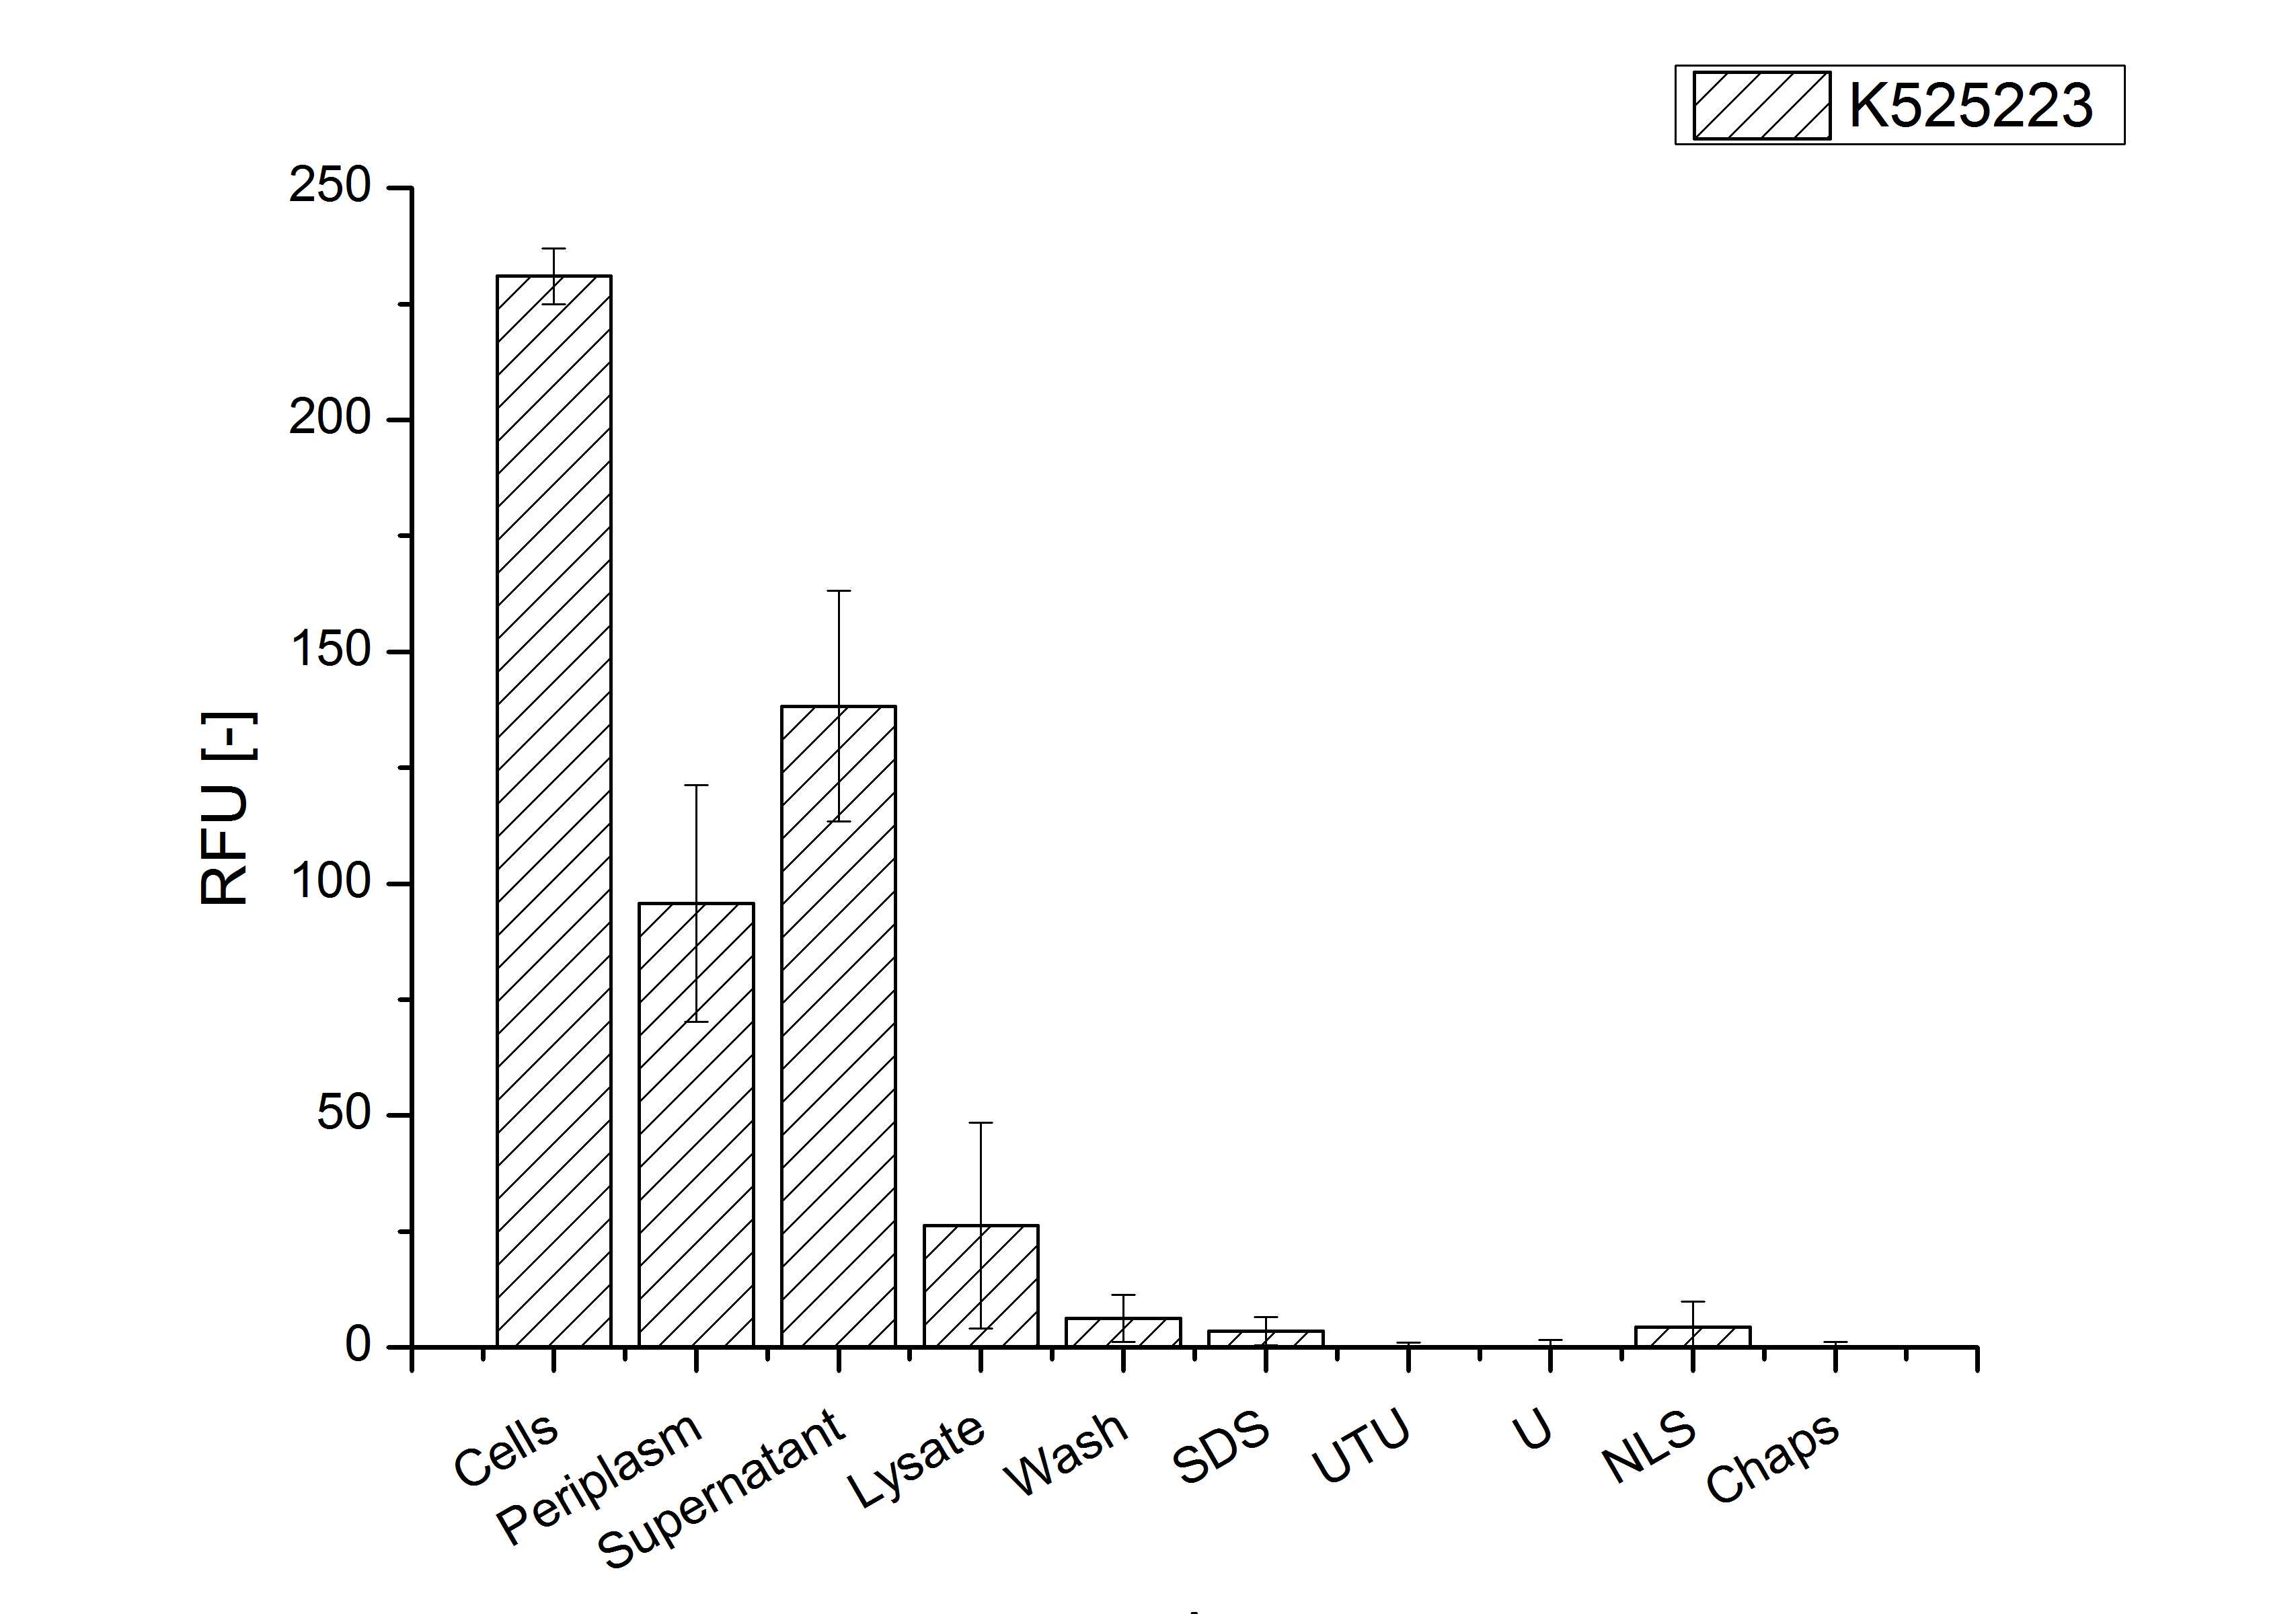
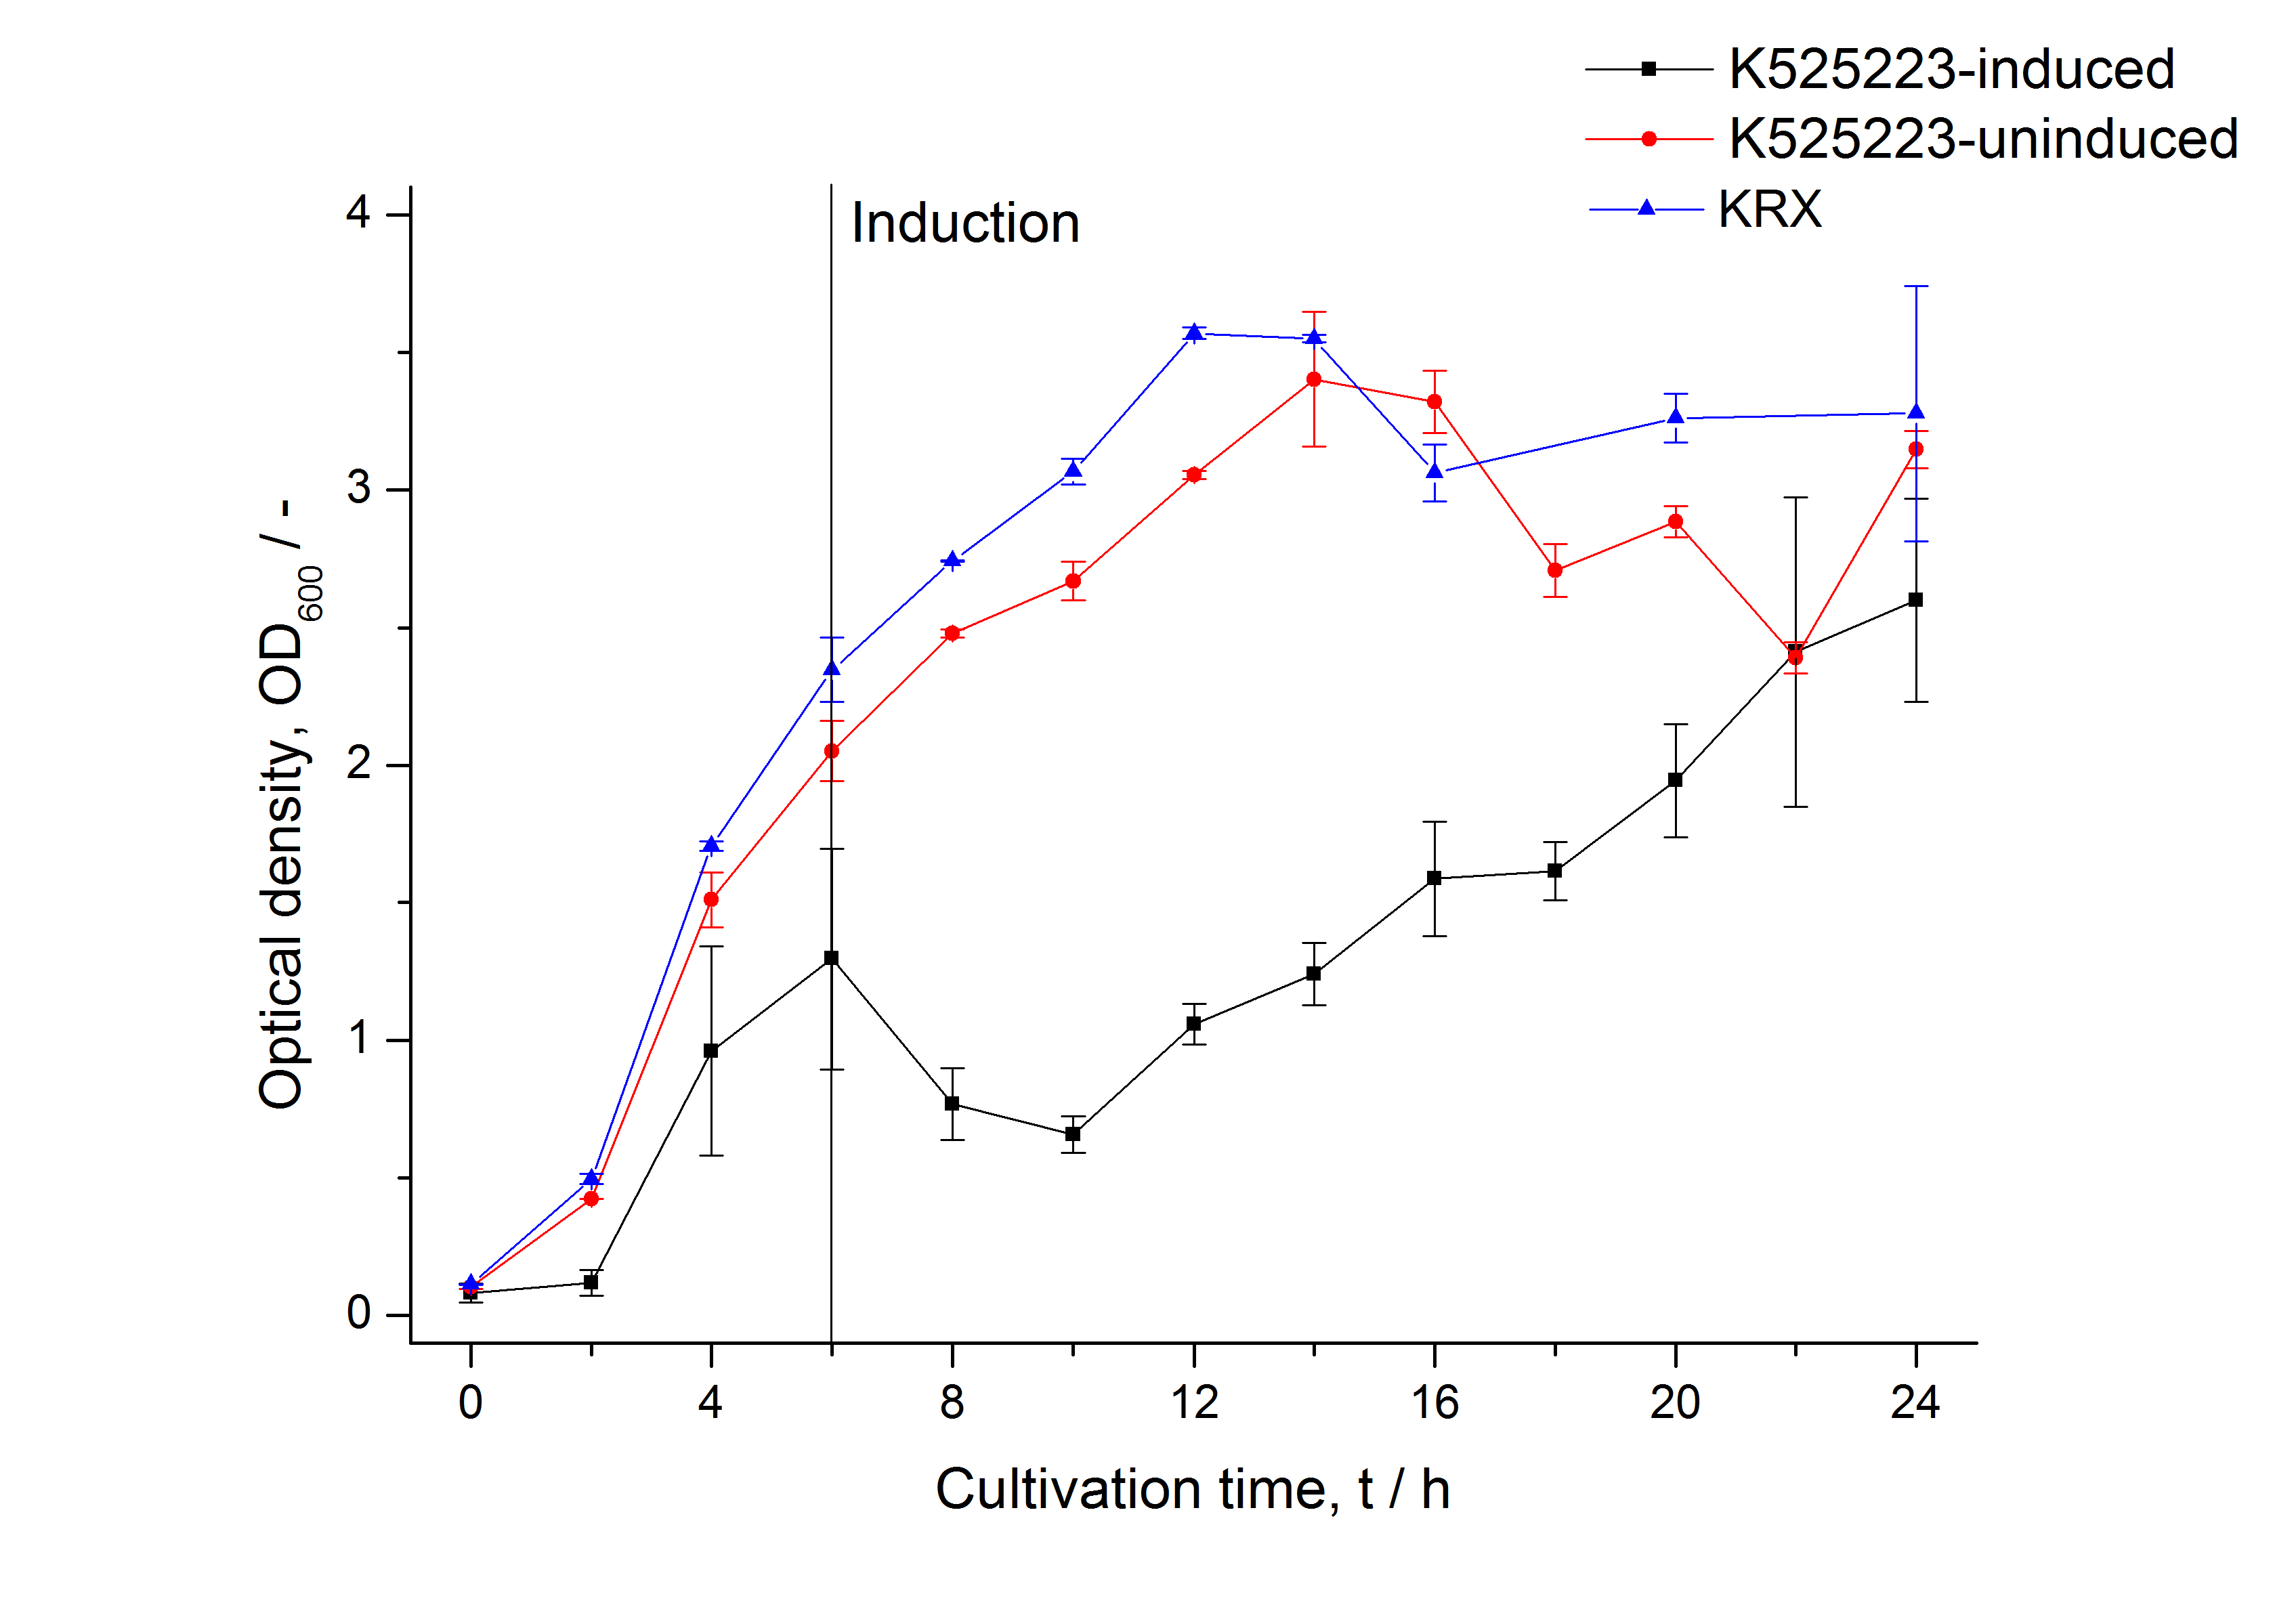
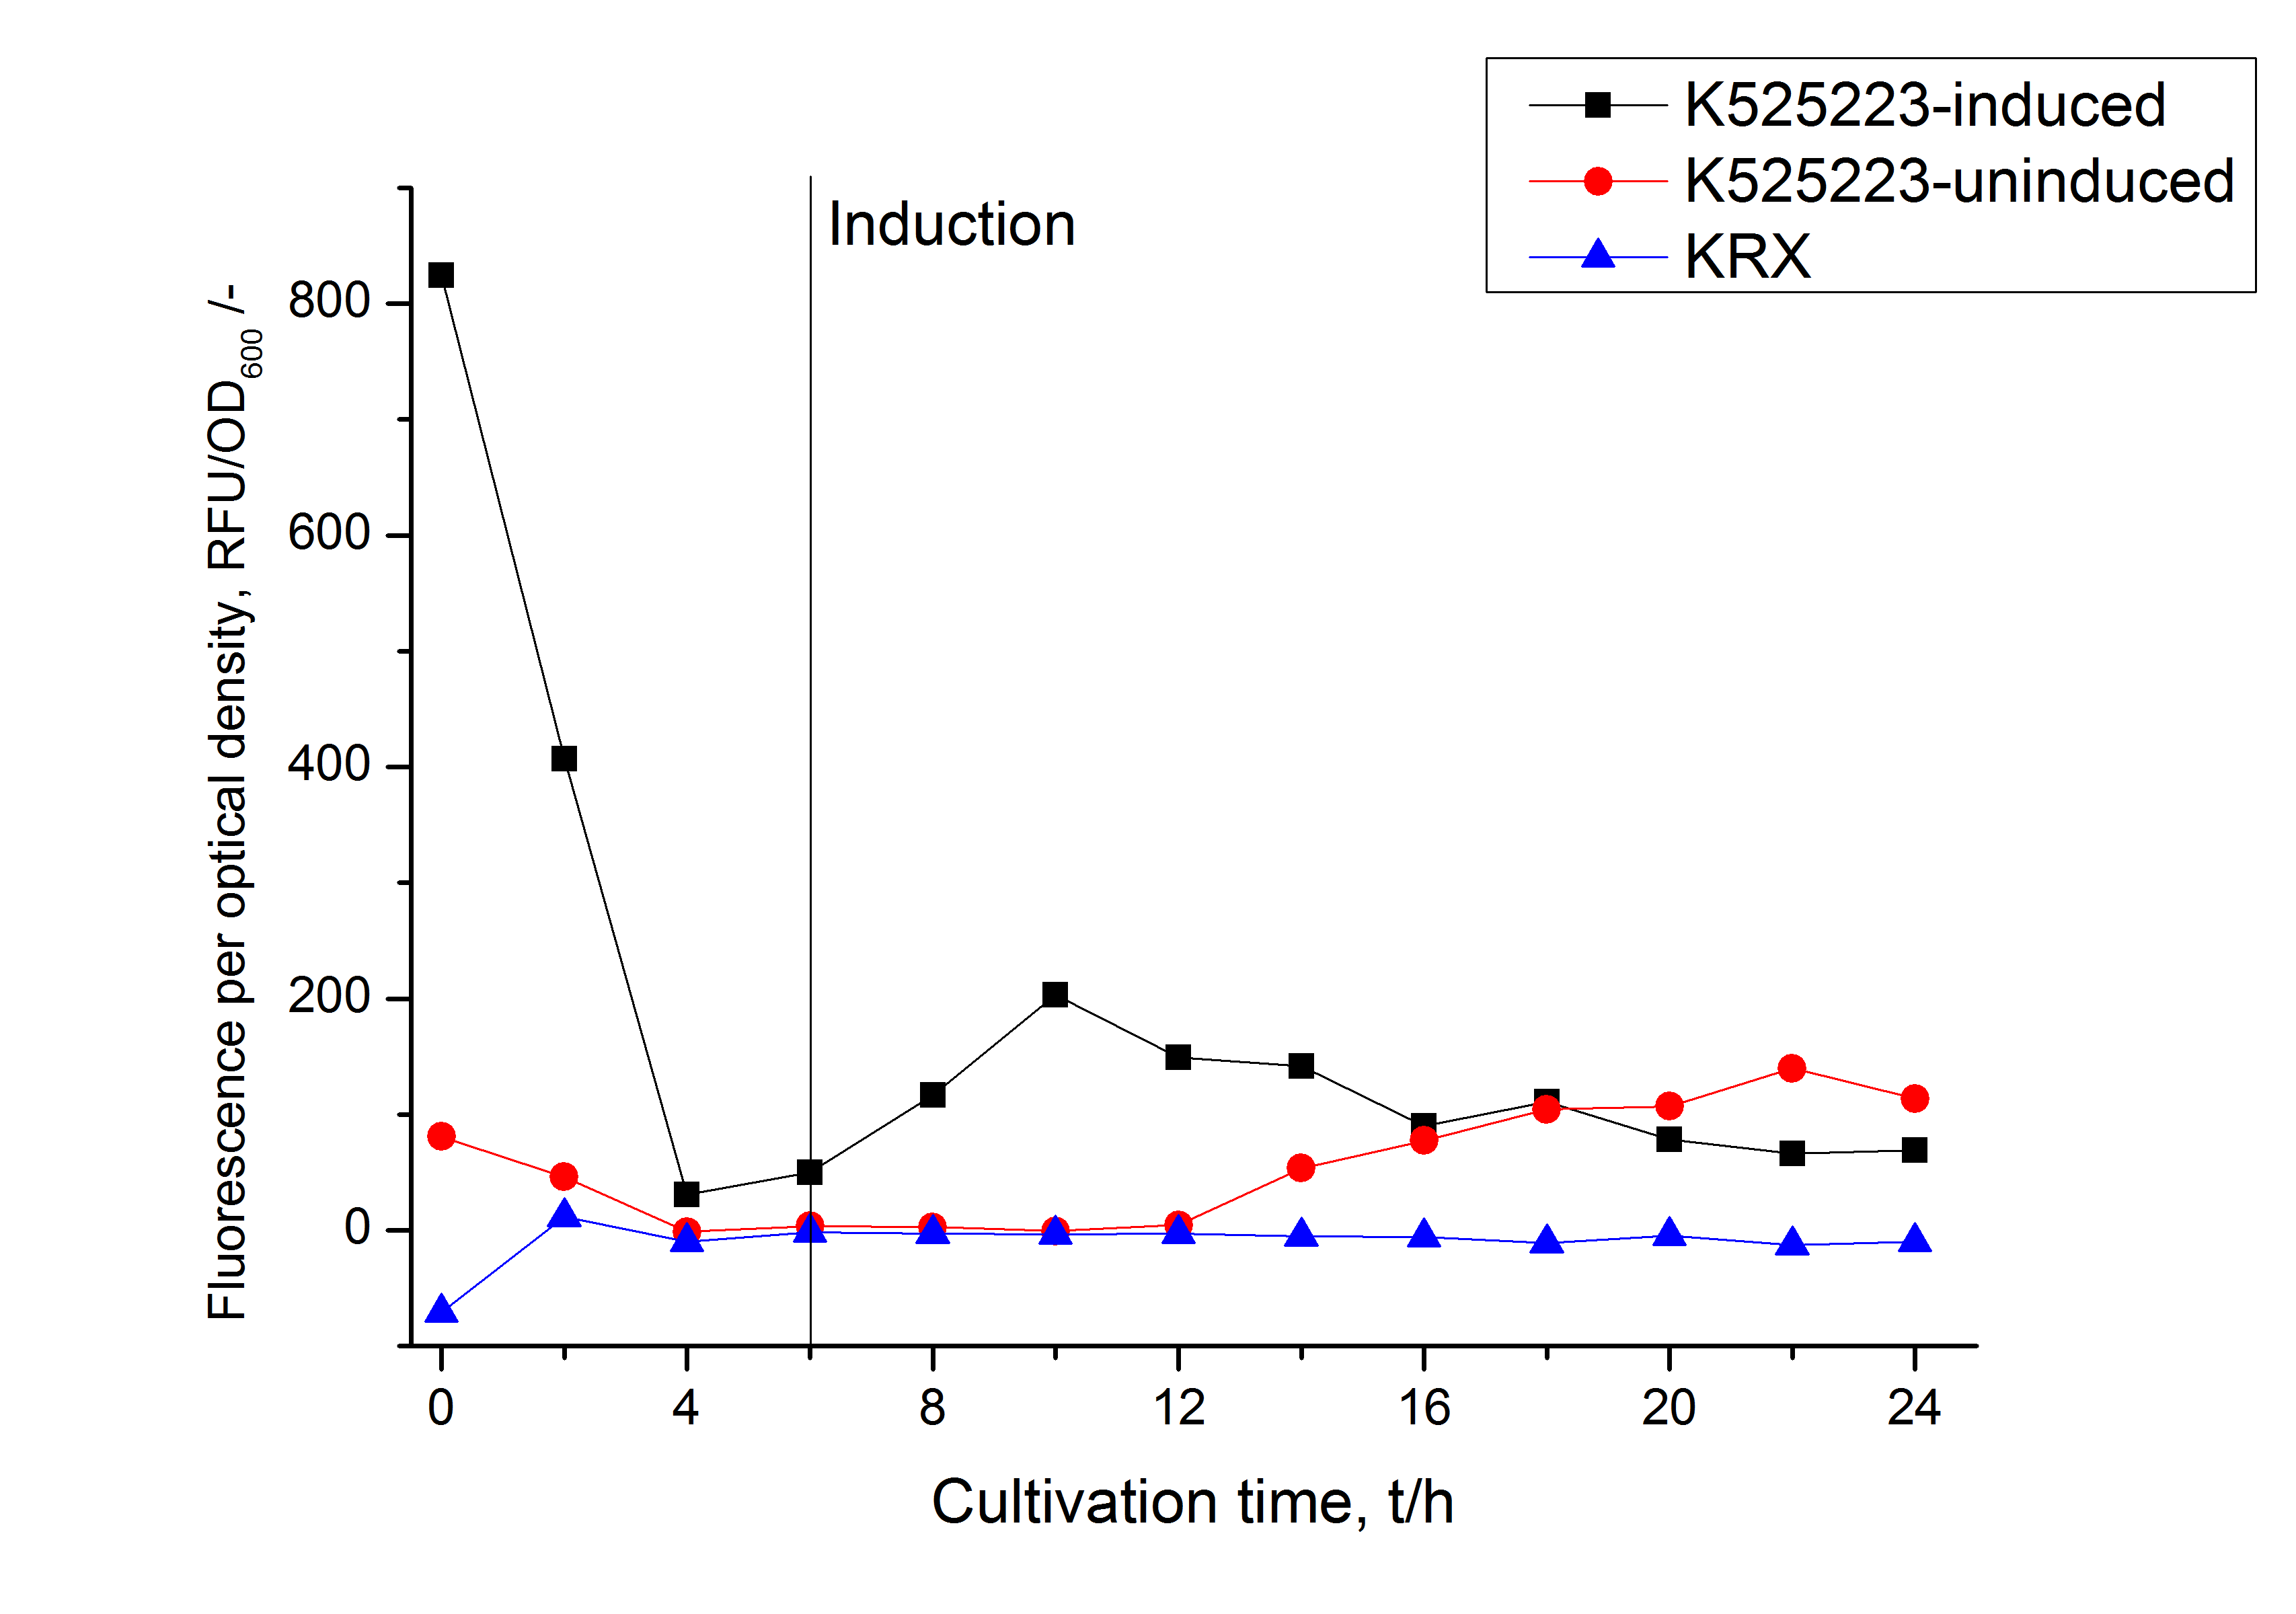
After a cultivation time of 18 h the mRFP|CspB fusion protein was localized in E. coli KRX. Therefore a part of the produced biomass was mechanically disrupted and the resulting lysate was washed with ddH2O. From the other part the periplasm was detached by using an osmotic shock. The S-layer fusion protein could not be found in the polyacrylamide gel after a SDS-PAGE of the lysate. This indicated that the fusion protein integrates into the cell membrane with its lipid anchor. For testing this assumption the washed lysate was treated with ionic, nonionic and zwitterionic detergents to release the mRFP|CspB out of the membranes. The existance of fluorescence in two of the detergent fractions (10 % SDS and 10 % N-lauroyl sarcosine) and the low fluorescence in the wash fraction confirm the hypothesis of an insertion into the cell membrane (Fig. 9). An insertion of these S-layer proteins might stabilize the membrane structure and increase the stability of cells against mechanical and chemical treatment. A stabilization of E. coli expressing S-layer proteins was described by [http://www.ncbi.nlm.nih.gov/pubmed/20829284 Lederer et al., (2010)]. An other important fact is, that there is actually mRFP fluorescence measurable in such high concentrated detergent solutions. The S-layer seems to stabilize the biologically active conformation of mRFP. In comparison with the mRFP fusion protein of [http://partsregistry.org/Part:BBa_K525224 K525224], which has a TAT-sequence, a minor relative fluorescence in all cultivation and detergent fractions was detected (Fig. 9). Together with the decreasing RFU after 9 h of cultivation (Fig. 7/ Fig. 8) this results indicate a postive effect of the TAT-sequence on the protein stability. This could be due to a digestion of <partinfo>K525223</partinfo> by proteases in the cytoplasm.
To obtain more specific information about the location of the S-layer fusion protein, after comparison with same treated fraction of E. coli KRX all gel bands in a defined size area were cut out of the gel and analysed with MALDI-TOF. Results are shown in Fig. 10. The fusion protein CspB/mRFP [http://partsregistry.org/Part:BBa_E1010 (BBa_E1010)] features a lipid anchor at the carboxy-terminus, but no amino-terminal TAT-sequence. In accordance with other protein variants with and without this features, the protein should be located mainly in the cytoplasm as inclusion bodies or incooperated with its lipid anchor into the cell membrane. Thus, the fraction with 10 % (v/v) SDS as detergent to disintegrate the protein from the cell wall was measured with MALDI-TOF. Results are shown in Fig. 10.

Fig. 10 shows, that the protein could be identified in all measured gel bands. The results indicate, that the protein is incorperated into the cell membrane. No fluoresence could be detected in the fractions using urea as detergent (see Fig. 9), thus the protein probably does not form inclusion bodies. The fact that there is a comparable low overall fluorescence in the cells is a strong indication that the protein is degraded by E. coli proteases. The fluorescence in the periplasm and the supernatant is probably due to cell lysis during the periplasm isolation and the cultivation because the measured fluorescence values are comparable low, too.
CspB with TAT-sequence and without lipid anchor
Cultivation and protein expression
For characterization the modiefied CspB [http://partsregistry.org/Part:BBa_K525224 (K525224)] gene was fused with a monomeric RFP ([http://partsregistry.org/Part:BBa_E1010 BBa_E1010]) using Gibson assembly.
The fusion protein was overexpressed in E. coli KRX after induction of T7 polymerase by supplementation of 0,1 % L-rhamnose using the auinduction protocol.


Identification and localisation

After a cultivation time of 18 h the mRFP|CspB fusion protein was localized in E. coli KRX. Therefore a part of the produced biomass was mechanically disrupted and the resulting lysate was washed with ddH2O. Then the lysate was treated with ionic, nonionic and zwitterionic detergents to release the mRFP|CspB out of the membranes, if it integrates. From the other part of the cells the periplasm was detached by using an osmotic shock. The existance of fluorescene in the periplasm fraction, showed in Fig. 13, indicates that C. halotolerans TAT-signal sequence is at least in part functional in E. coli KRX.
Specific for <partinfo>K525224</partinfo> fused with mRFP is the proportional to the mRFP fusion proteins of [http://partsregistry.org/Part:BBa_K525222 K525222] and [http://partsregistry.org/Part:BBa_K525223 K525223] high fluorescence in the culture supernatant. This indicates that the fusion protein is secreted into the periplasm via the TAT-pathway and partly released into the culture medium. Because there is no known release pathway for S-layer proteins in E. coli the periplasm might burst in consequence of the overexpression. The fluorescence in all cultivation fractions plus the fluorescence in the lysis und wash fraction shows that the fusion protein is water soluble and does not sediment during centrifugation. The absence of fluorescence indicates that the expressed fusion protein does not form inclusion bodies during cultivation.
To obtain specific information about the location of the S-layer fusion protein, after comparison with same treated fraction of E. coli KRX all gel bands in a defined size area were cut out of the gel and analysed with MALDI-TOF. Results are shown in Fig. 14.

Sequence coverage could be identified in the supernatant of the media, in the periplasmatic fraction and in the cell lysis fraction, indicating that the TAT-sequence is working and that the protein is furthermore secreted into the media. This covers with the fluorescence measurements of the different fractions. A high fluorescence has been measured in the supernatant of the media, which is a remarkable characteristic because normally E. coli is only limited capable for secretion.
The influence of other detergents to disintegrate the S-layer fusion protein was tested after disrupting the cells with a ribolyser. The cell pellet was incubated in 10 % (v/v) Sodium dodecyl sulfate (SDS), in 7 M urea and 3 M thiourea (UTU), in 10 M urea (U) in 10 % (v/v) n-lauroyl sarcosine (NLS) and in 2 % CHAPS (C). Samples of the incubations with these detergents were loaded onto a SDS-PAGE prior to measurement with MALDI-TOF (see Fig. 15).

Altough most of the protein should be transported to the periplasm or secreted proteins should be found in the detergent fractions. So the SDS fraction was measured with MALDI TOF, because SDS is able to solubilize nearly every protein. In the fractions of SDS sequence coverage over 20 % could be identified, indicating that a considerable amount of the fusion protein is located in the cytoplasm.
Purification
After the localisation of the S-layer protein in E. coli, different methods for purification were tested. The results of these methods are shown in Fig. 16. The CspB protein does not form inclusion bodies in E. coli and most of the protein is transported out of the cell into the periplasm and a lot of protein is even secreted into the medium (all fractions were concentrated by filtration and precipitation, respectively). The secretion into the culture medium is very interesting because the purification is much faster (no cell disruption necessary).
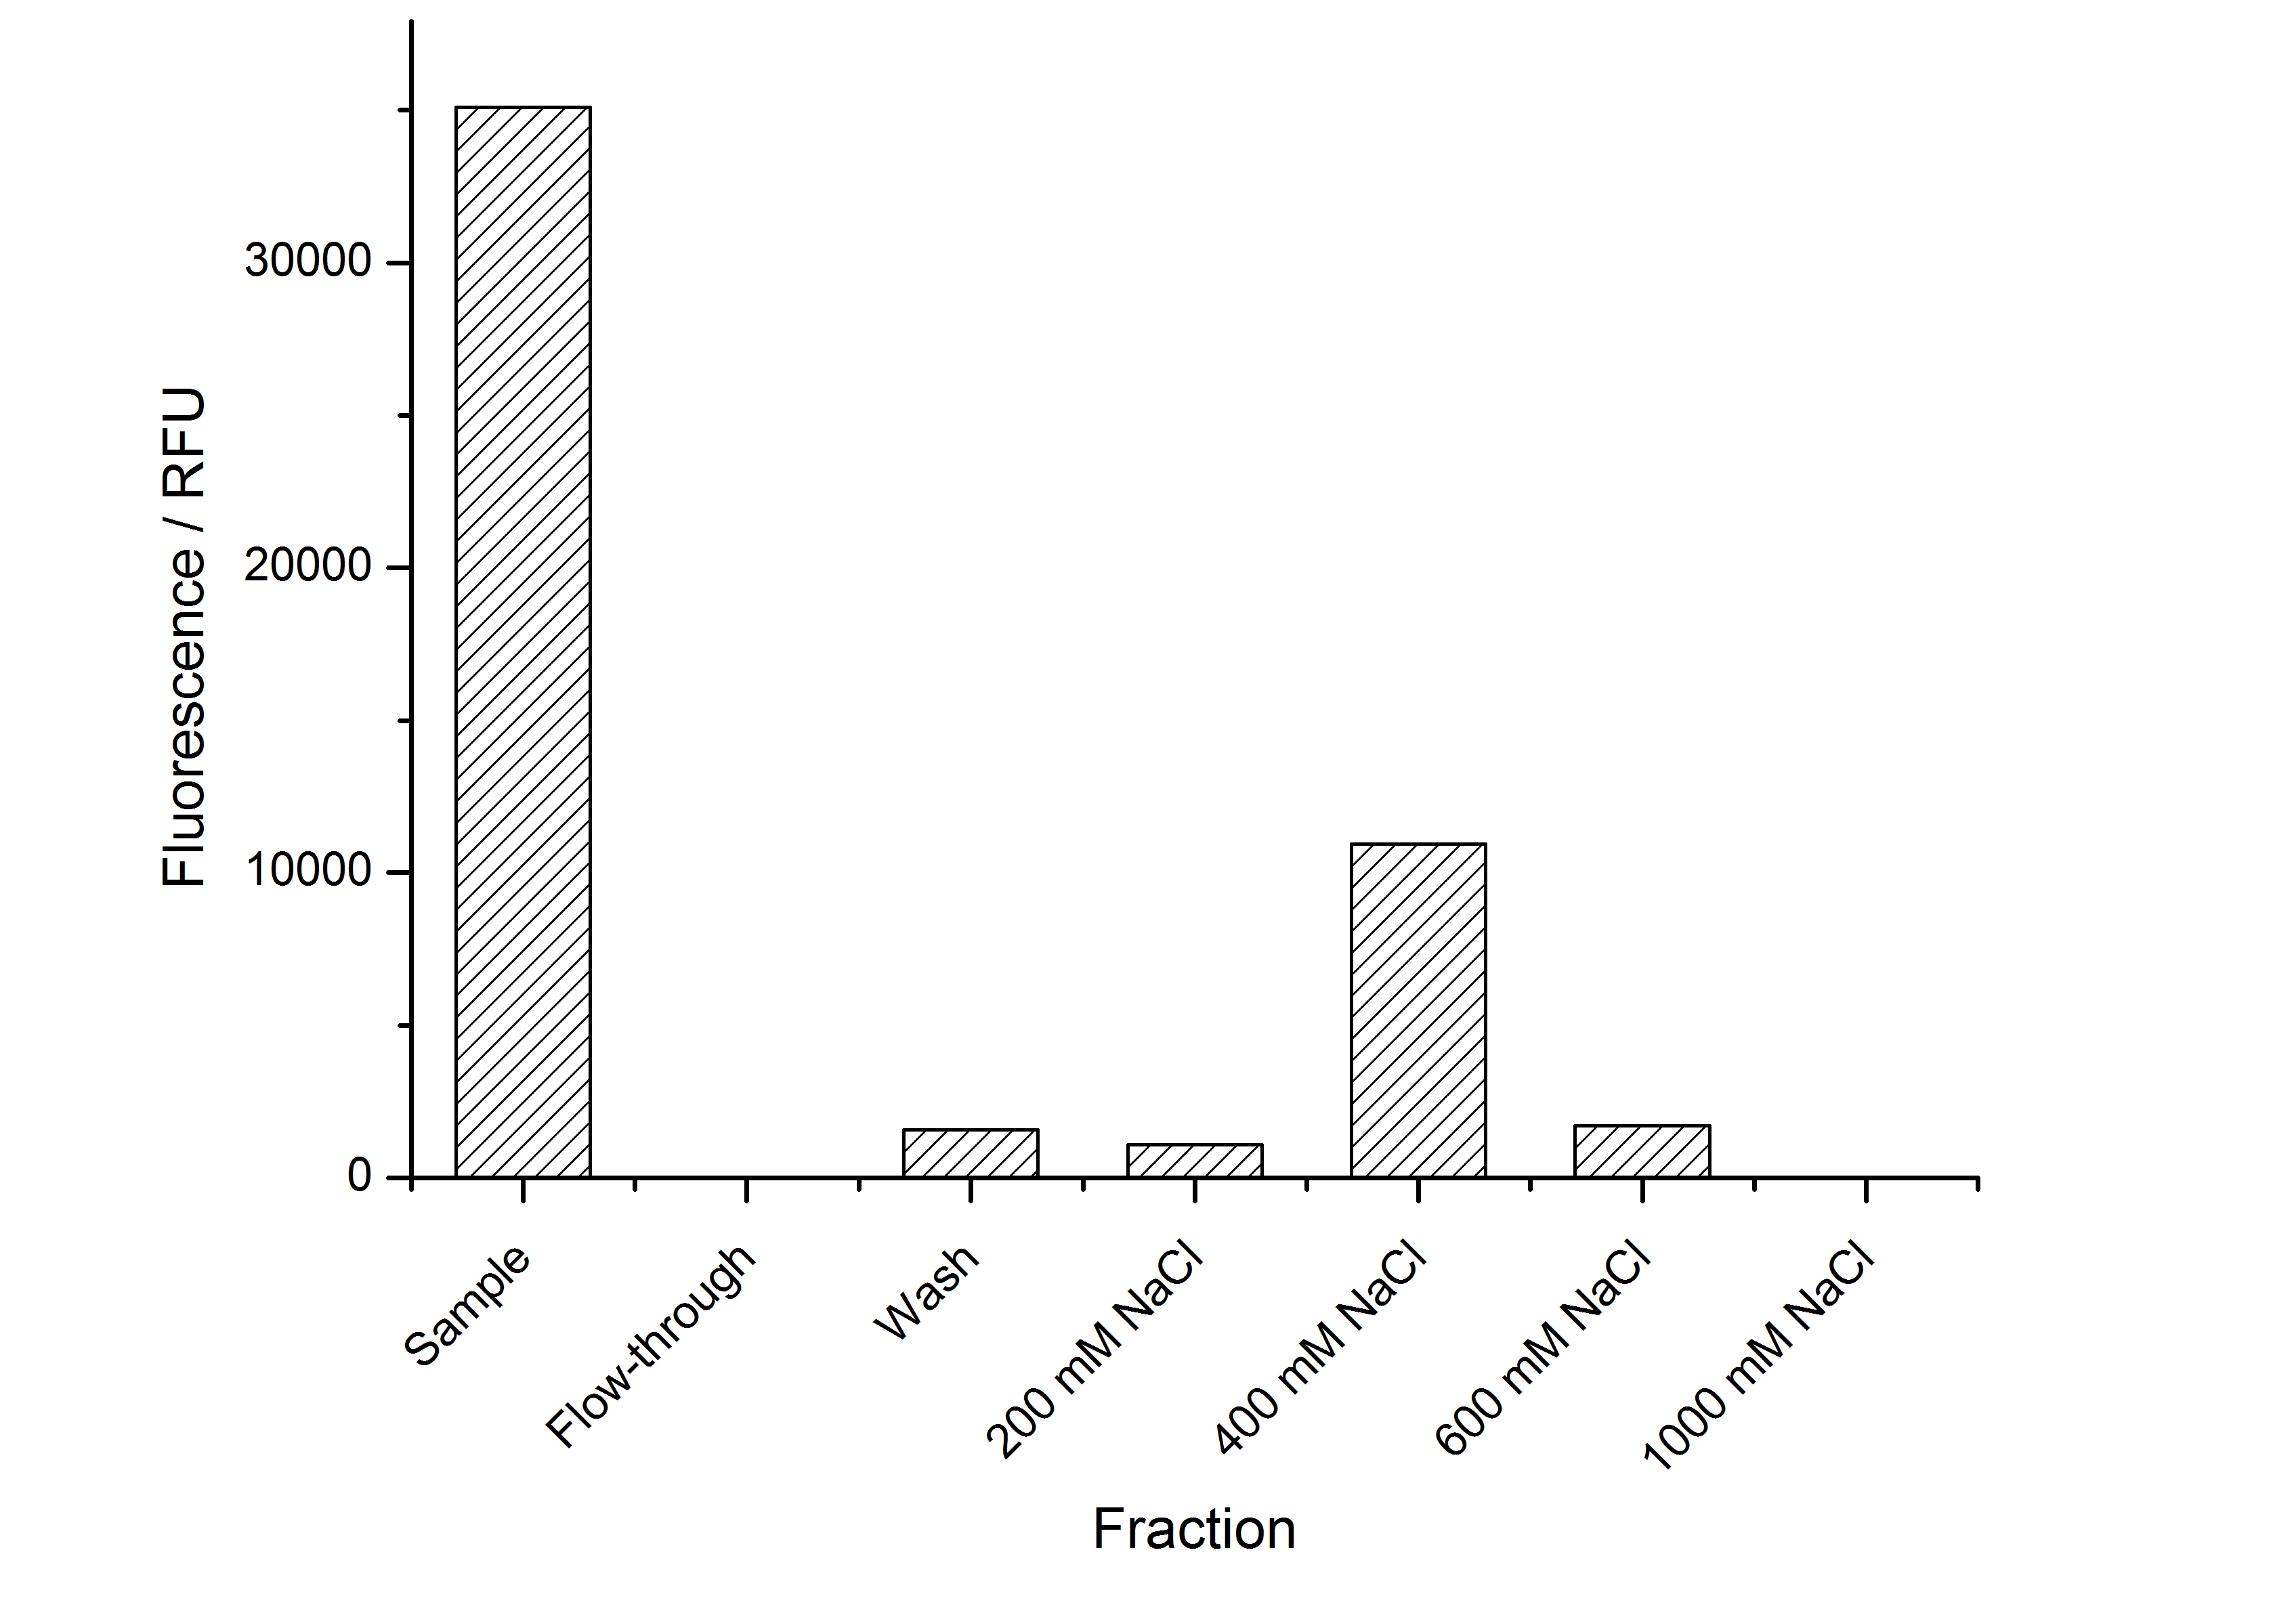
The highest fluorescence could be obtained by a precipitation with ammonium sulfate of the culture supernatant followed by an ultrafiltration with a 300 kDa membrane and a diafiltration with a 50 kDa membrane. The diafiltration was against a binding buffer for an anion exchange chromatography (25 mM sodium acetate, 25 mM sodium chloride) with pH 6, due to the theoretical pI of <partinfo>k525234</partinfo>. The fluorescence of the collected fractions of the following anion exchange chromatography are shown in Fig. 17.
The binding conditions are well chosen because nearly all of the protein binds to the column. The protein is eluted from the column with rising sodium chloride concentrations. The highest fluorescence is in the elution fraction with 400 mM sodium chloride. 600 mM sodium chloride elutes all of the S-layer fusion proteins.
Final purification strategy
Scheme of purification strategy for CspB (fusion) proteins without lipid anchor:
First, CspB is expressed in E. coli under the control of a T7 promoter for separation of growth and production phase due to metabolic stress of the S-layer expression. Because the CspB protein with TAT-sequence and without lipid anchor is secreted to the culture medium in appreciable amounts by E. coli, an ammonium sulfate precipitation of the culture supernatant follows the cultivation. The S-layers are further concentrated and purified by two ultrafiltration / diafiltration steps (300 kDa and 100 kDa) with anion exchange chromatography binding buffer. The permeate of the last filtration is used for an anion exchange chromatography for capture and purification of the S-layer protein.
Click for detailed information
 "
"


