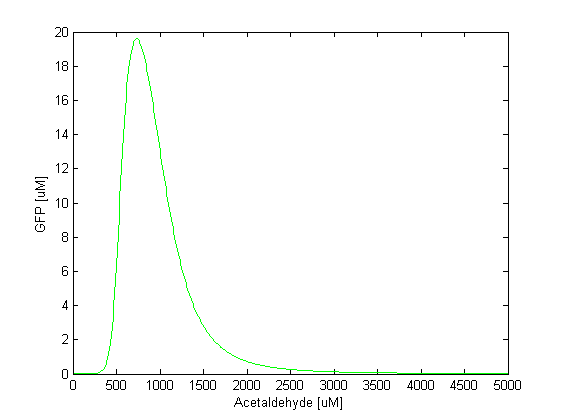
 Figure 1: GFP vs. increasing acetaldehyde input (both in μM). The band appears when the acetaldehyde concentration is in the range of 500-1500 μM |
Video 1: Steady state simulation sweep from 1 to 2500 mg/l acetaldehyde concentration in reservoir: 3D GFP concentration in mol/m 3, 5 slices through the channel. Channel width: 2 mm, Channel length: 5 cm. Press play to start video!
|
This acetaldehyde concentration is toxic for the cells. However, with single cell model parameters tuning, we got the band at lower acetaldehyde concentration (we haven't done the COMSOL simulation with those values yet). The tuning of the parameters doesn't affect the feasibility of our design at any way, since it just affects the input acetaldehyde concentration needed.
|
 "
"


