Parameter Sweeps
For the parameters that belong to the band detector module, we explored their parameter spaces to quantify how they affect the features of the GFP band . As we varied each parameter (while keeping the rest constant), we varied also the acetaldehyde input and monitored the GFP output. We analyzed the parameter space only for the model that uses acetaldehyde as an input parameter.
In both models the band is affected in the same way by the parameters of the band detector module. The sensor mechanism can only cause shifts in the band but the band detector module itself is unaffected by the input of the system. The parameter sweeps for the xylene model would therefore be similar to the acetaldehyde model, with differences only for the parameters involved in the sensor mechanism.
In order to speed up the simulations, we used Maple to derive the steady-state formulas for all the relevant species. In this way we were able to obtain the steady-state GFP value simply by knowing the input concentration of Acetaldehyde, without the need to use an ODE solver. Thus we were able to reduce the simulation time from about 30 minutes to under one minute for one parameter sweep.
The following figures show how the band changes with the variation of protein production rates, repression coefficients and degradation rates.
Protein Synthesis Rates
 Figure 1: Exploring the parameter space of TetR production rate | 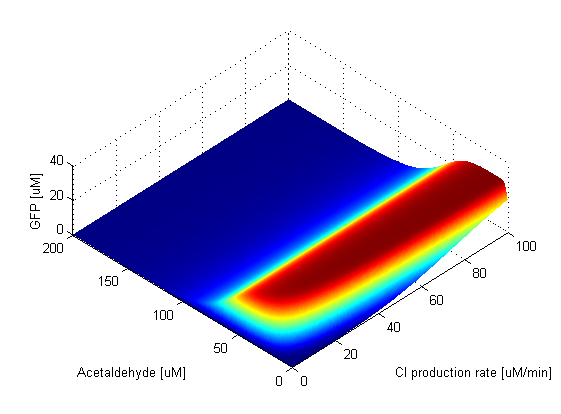 Figure 2: Exploring the parameter space of CI production rate |
|
When the TetR production rate is zero, there is no TetR present in the cell, which means that LacIM1 is not repressed so it is free to block GFP production. This can be seen in the graph, since at this value of TetR production the band is absent. As soon as the production rate becomes non-zero, the band appears. The existence of the GFP band is not affected by the value of the TetR production rate, the band is present and the peak stays at a constant amplitude. TetR production rate only affects the width and position of the band which widens and shifts to higher acetaldehyde values as the production rate increases.
When the CI production rate is zero, there is no CI present in the cell, which means that LacI is not repressed, so it is free to block the production of GFP. Thus, the band is absent at this value of CI production rate. After the CI production rate goes above a lower threshold, the band appears. We can observe that above the threshold the GFP band is very robust to the change in CI production rate, maintaining the position and amplitude of the peak at a constant value. The width of the band seems to slightly increase as the CI production rate increases, but at very high values it seems to stay constant.
|
 Figure 3: Exploring the parameter space of LacI production rate | 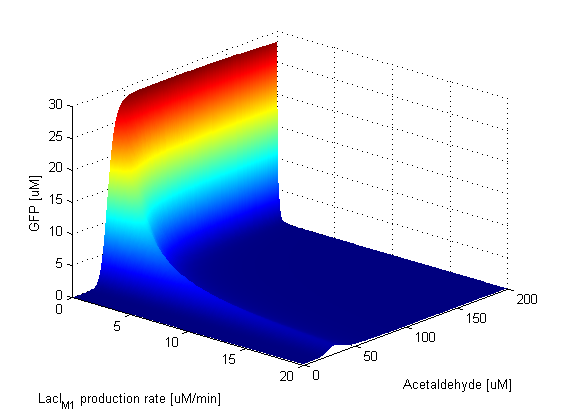 Figure 4: Exploring the parameter space of LacI M1 production rate |
|
When the LacI production rate is zero, only the low-pass branch of the system is in function. This can be seen in the graph, as GFP is produced if Acetaldehyde has a concentration lower than 100 μM. However, as soon as LacI start being produced the band is formed. When the production rate of LacI gets too high, the amplitude of the band decreases, but the position of the peak and the width stay constant.
When the LacIM1 production rate is zero, only the high-pass branch of the system is in fucntion. This means that GFP is produced only when Acetaldehyde is present and its concentration is higher than a low threshold, which is equal to about 20 μM. When LacIM1 appears in the cell, the band is formed. Just as in the case of the LacI production rate, the band seems to maintain its width and the position of its peak, but it decreases its amplitude. This is due to the fact that both LacI and LacIM1 repress GFP production, and if their production rate is high the repression is more efficient.
|
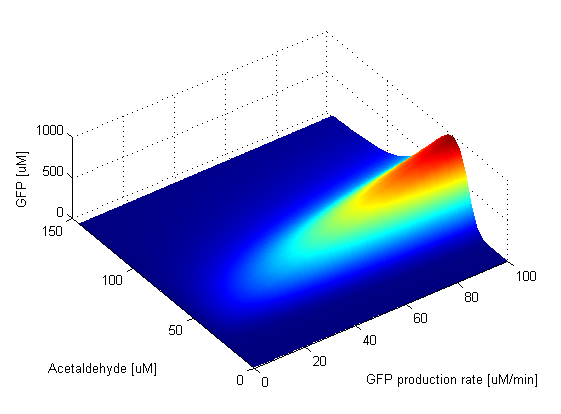 Figure 5: Exploring the parameter space of GFP production rate |
|
The GFP production rate has an effect only on the amplitude of the band. This is clear from the ODE of the GFP change in time. The amplitude of the GFP is thus directly proportional to the value of the GFP production rate. This can be seen in the graph. When the GFP production rate is zero, naturally no GFP molecules are produced. As soon as the production rate becomes nonzero, the band appears and its amplitude is increasing linearly with the value of the GFP production rate. The width of the band and position of the peak stay fixed.
|
|
Repression Coefficients
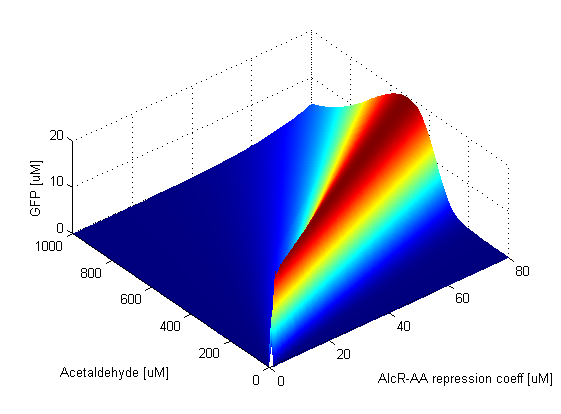 Figure 6: Exploring the parameter space of AlcR-AA repression coefficient |  Figure 7: Exploring the parameter space of TetR repression coefficient |
|
The AlcR-AA repression coefficient affects only the width and position of the GFP band, we can observe that the band widens and shifts to higher acetaldehyde concentrations as the value of the coefficient increases. The TetR repression coeffient seems to have an impact only on the position of the band but not on the amplitude of the peak.
|
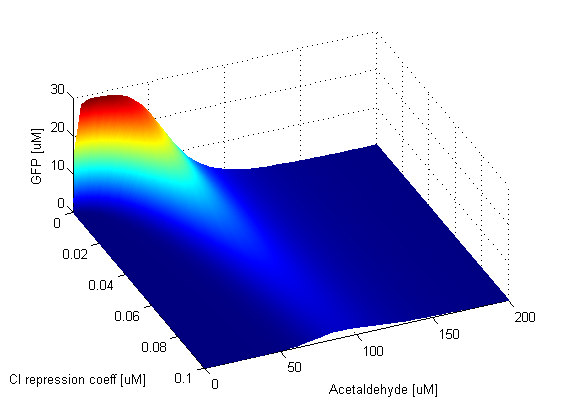 Figure 8: Exploring the parameter space of CI repression coefficient |  Figure 9: Exploring the parameter space of LacI repression coefficient |
|
We observe that the GFP band is sensitive to the CI repression coefficent and appears only for low values of it. The LacI repression coefficient does not have a high impact on the band as it only widens it when the parameter value gets larger.
|
Protein Degradation Rates
 Figure 10: Exploring the parameter space of TetR degradation rate | 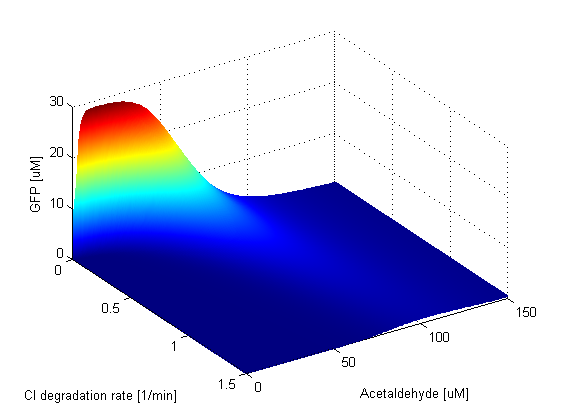 Figure 11: Exploring the parameter space of CI degradation rate |
|
The degradation rate of TetR does not influence the existence of the band and the amplitude of its peak. The GFP band seems to be present at all parameter values, however its position and width change in the region of low degradation rates, but it is completely robust at higher concentration values. The CI degradation rate allows the band to appear only when its value is low, at higher rates the band formation is stopped.
|
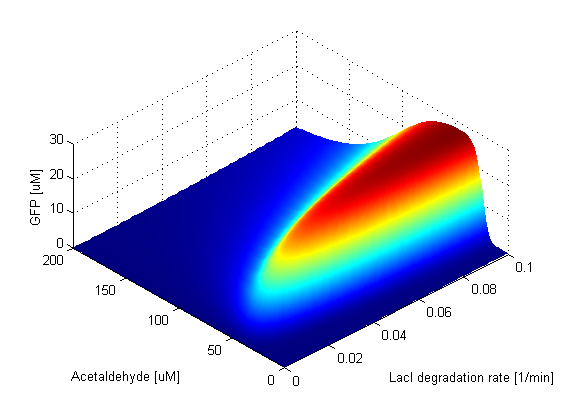 Figure 12: Exploring the parameter space of LacI degradation rate | 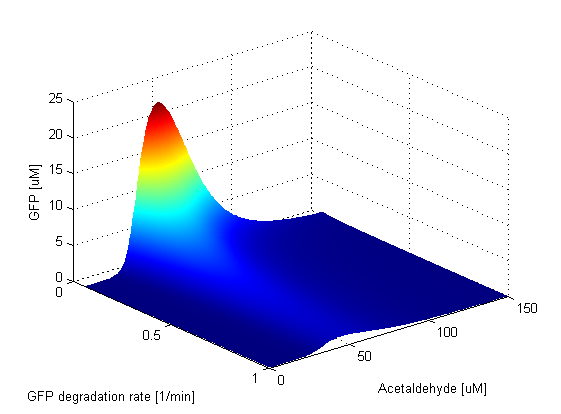 Figure 13: Exploring the parameter space of GFP degradation rate |
|
We notice that the amplitude of the GFP peak and the bandwidth exhibit positive correlation with respect to the LacI degradation rate. As expected, there is a strong negative correlation between the height and width of the peak and the GFP degradation rate, since the GFP band can exist only of the GFP molecules are not degraded too quickly.
|
|
 "
"