Team:Bielefeld-Germany/Results/S-Layer
From 2011.igem.org


Contents |
SgsE from Geobacillus stearothermophilus NRS 2004/3a
Purification of SgsE fusion protein
As seen in the analysis of the cultivations with expression of SgsE | mCitrine fusion proteins, these proteins form inclusion bodies in E. coli. Inclusion bodies have the advantage that they are relatively easy to clean-up and are resistant to proteases. So the first purification step is to solve and set-free the inclusion bodies. This step is followed by two filtrations (300 kDa UF and 100 kDa DF/UF) to further concentrate and purify the S-layer proteins. After the filtrations, the remaining protein solution is dialized against ddH2 for 18 h at 4 °C in the dark. The dialysis leads to a precipitation of the water-insoluble proteins. After centrifugation of the dialysate the water-soluble S-layer monomers remain in the supernatant and can be used for recrystallization experiments.
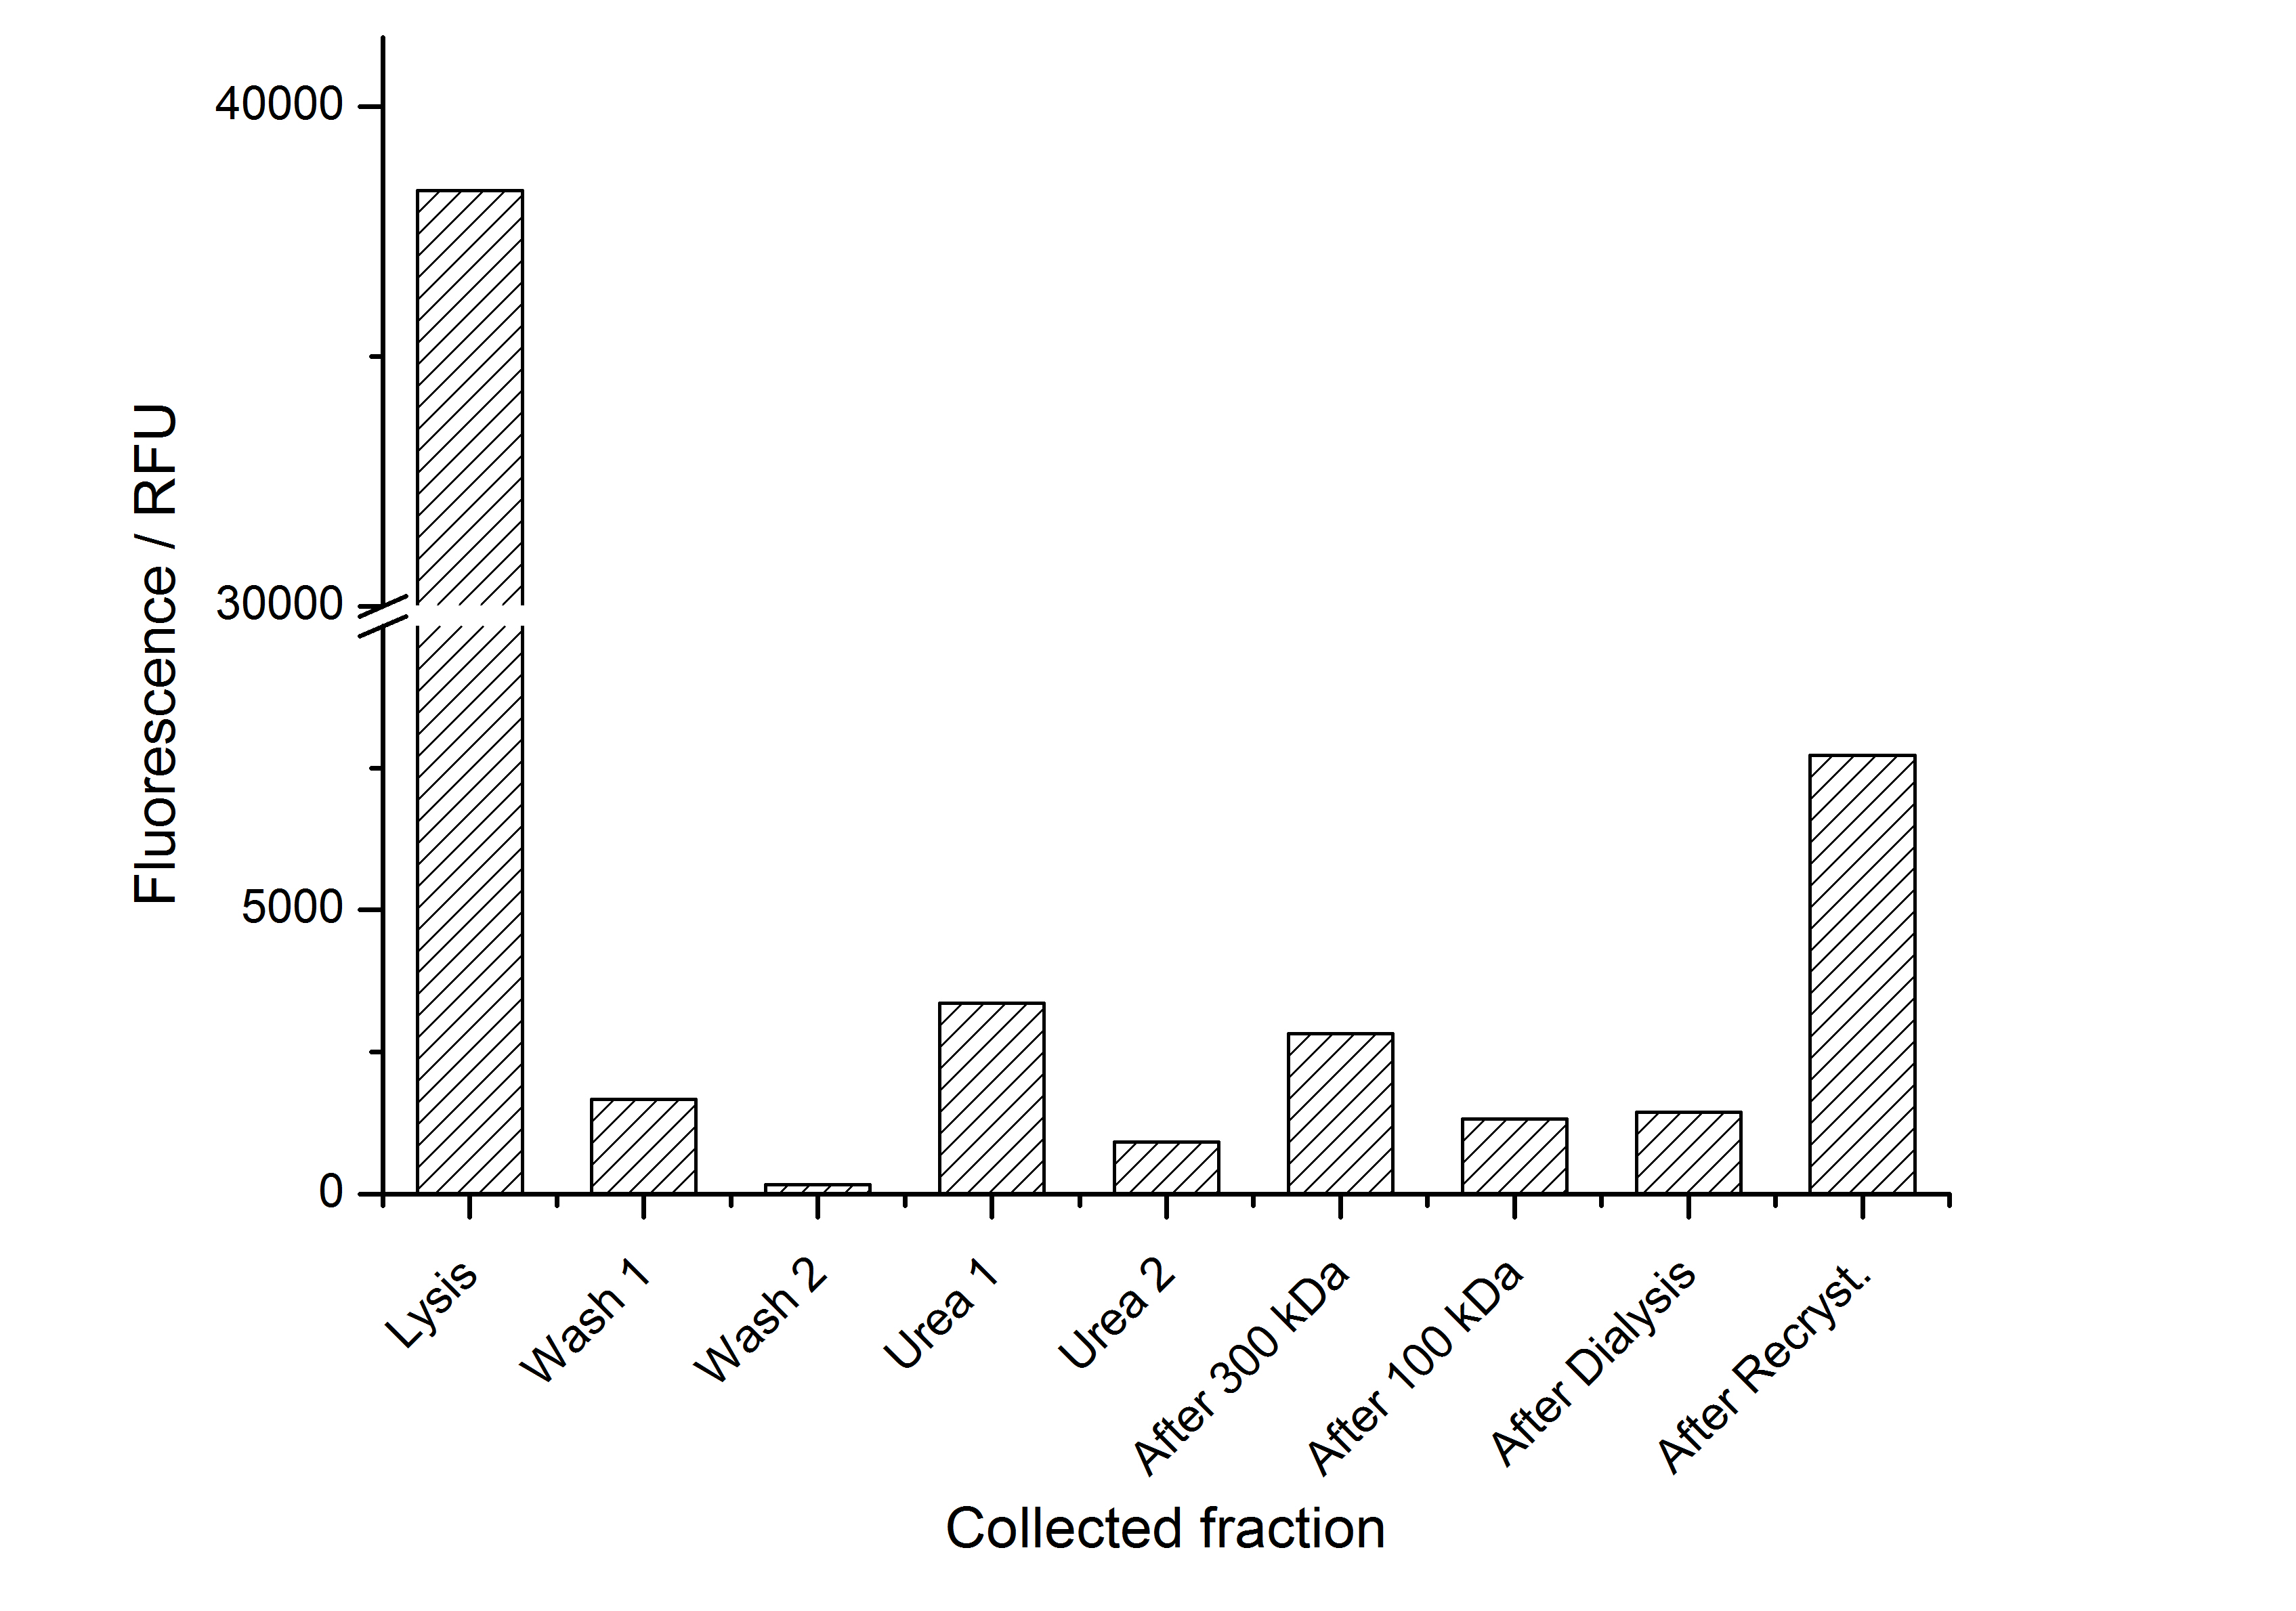
The fluorescence of the collected fractions of this purification strategy is shown in the following figure A:
A lot of protein is lost during the purification especially after centrifugation steps. The fluorescence in the urea containing fractions is lowered due to denaturation of the fluorescent protein. Some fluorescence could be regenerated by the recrystallization in HBSS. This purification strategy is very simple and can be carried out by nearly everyone in any lab being one first step to enable real do it yourself nanobiotechnology.
Immobilization behaviour
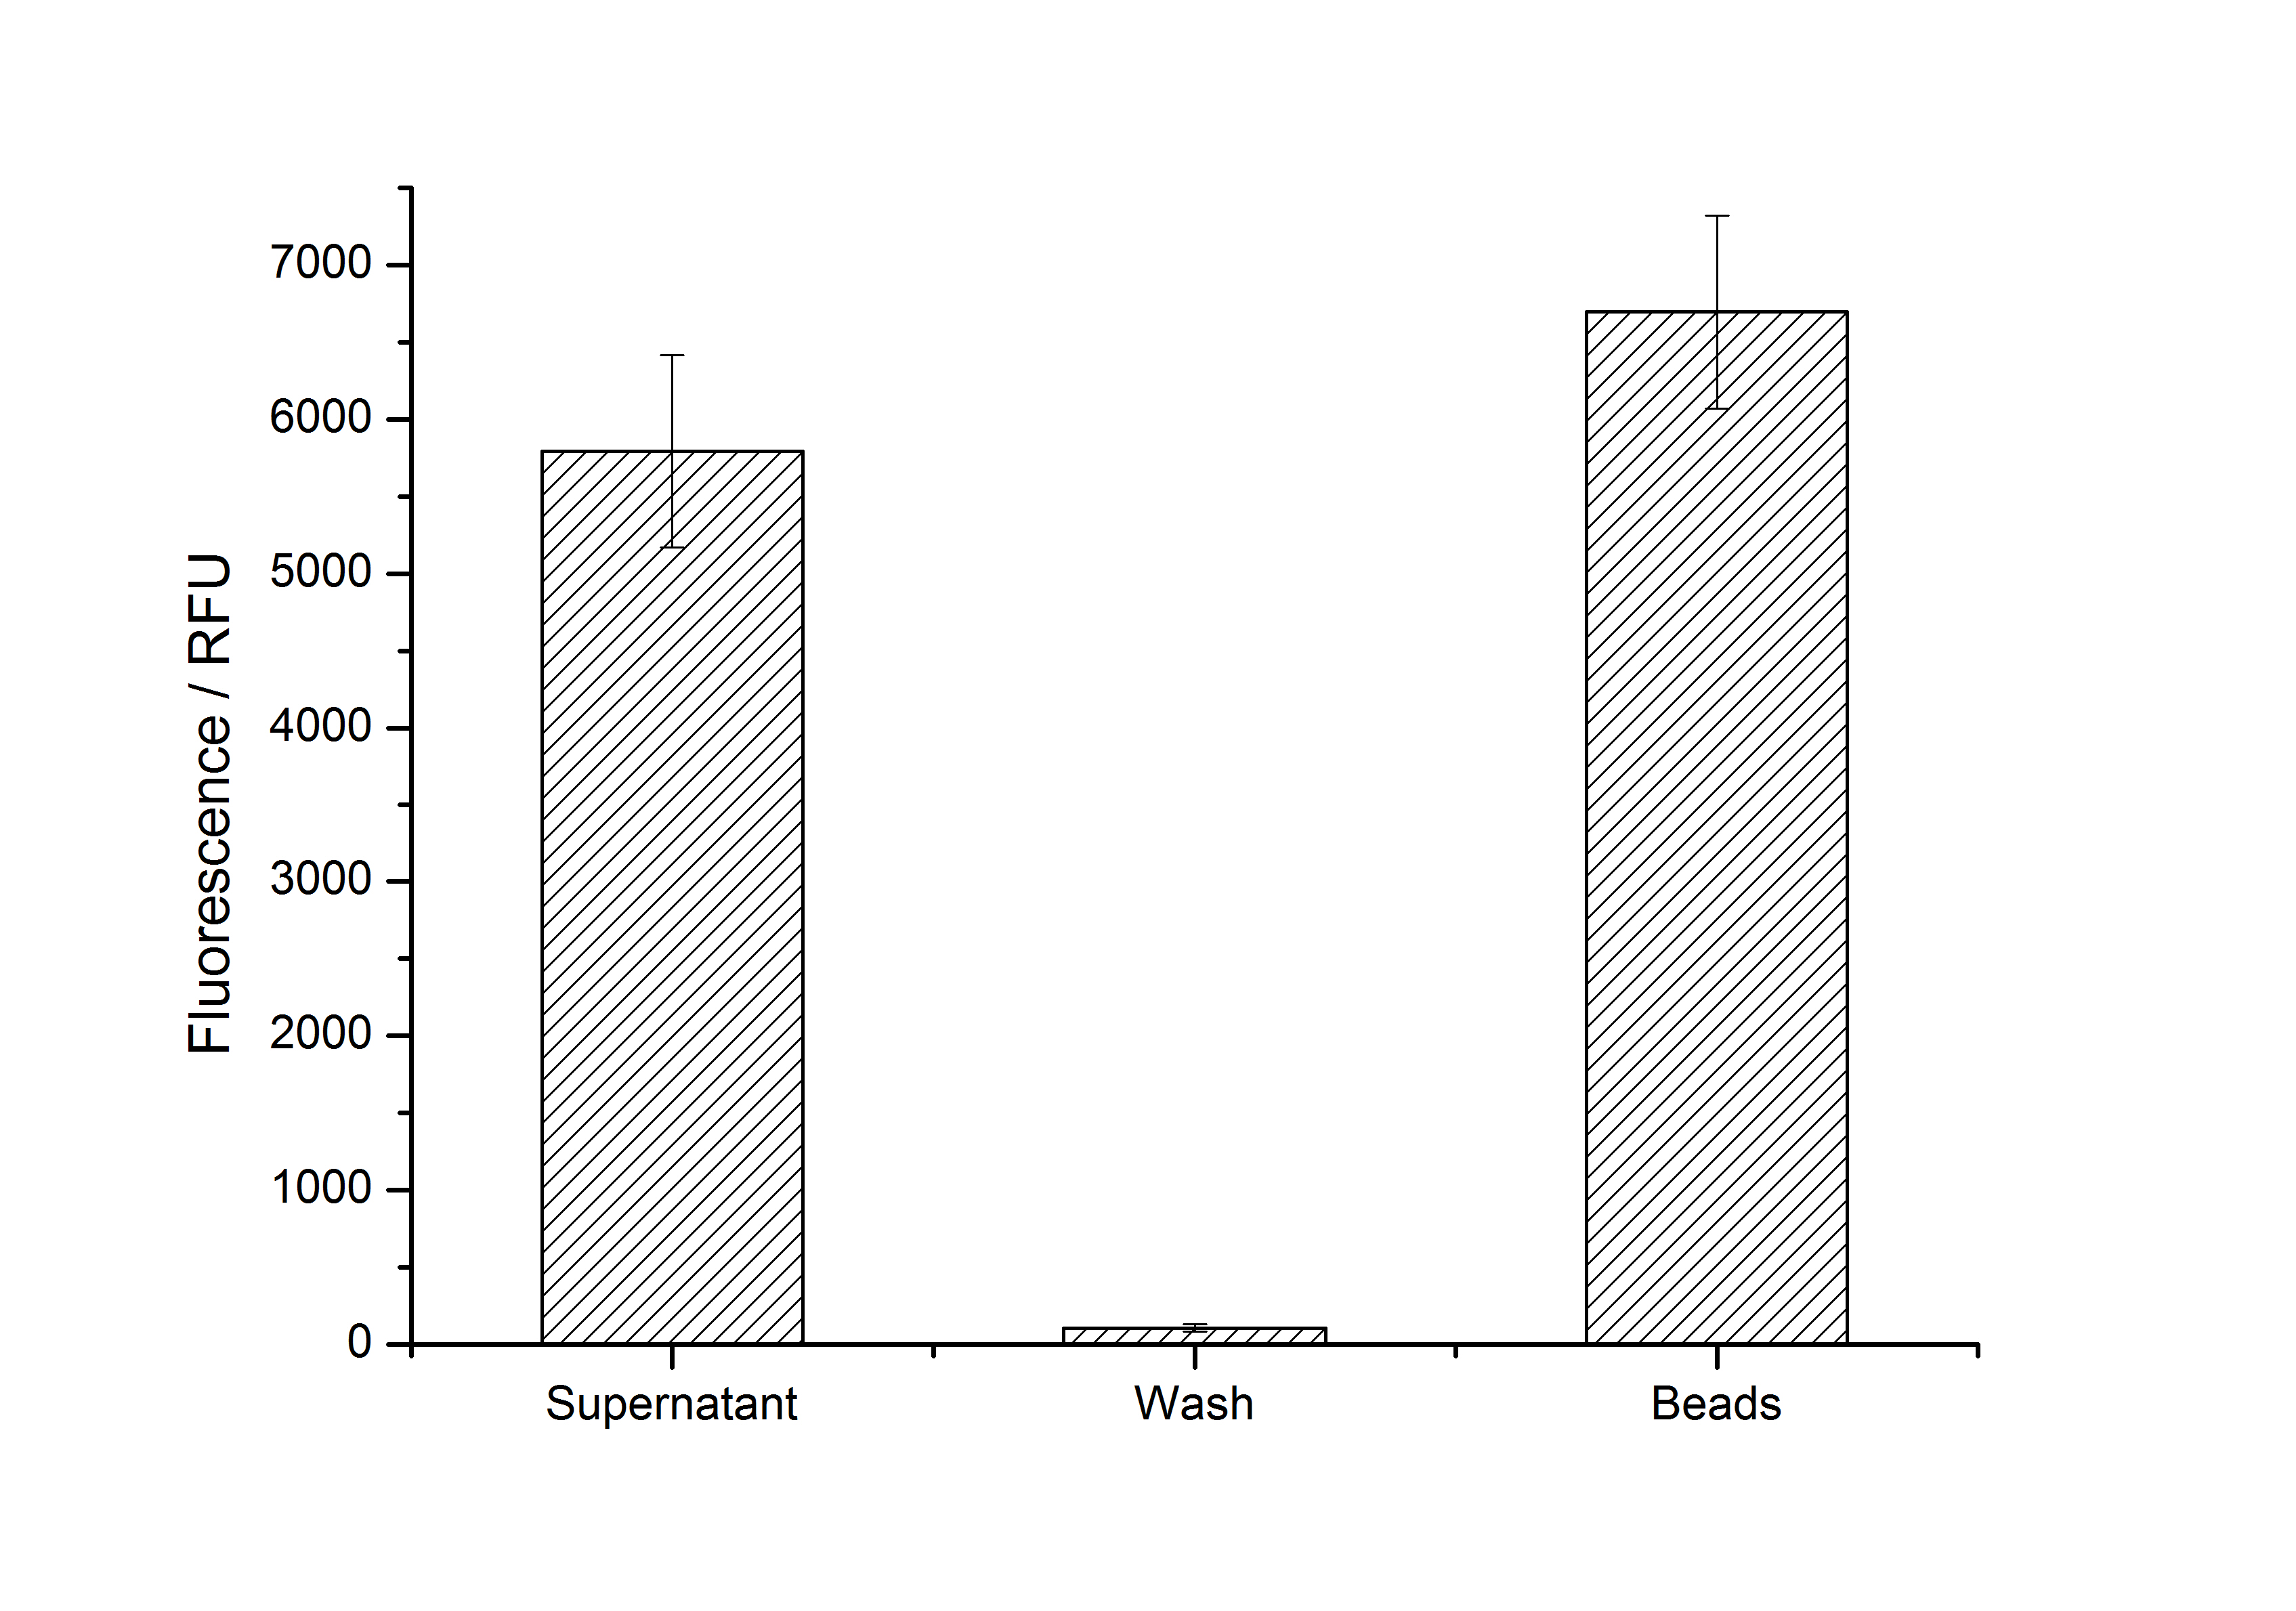
After purification, solutions of monomeric SgsE S-layer proteins can be recrystallized and immobilized on silicon dioxide beads in HBSS (Hank's buffered saline solution). After the recrystallization procedure the beads are washed with and stored in ddH2O at 4 °C in the dark. The fluorescence of the collected fractions of a recrystallization experiment with <partinfo>K525305</partinfo> are shown in fig. X. 100 mg beads were coated with 100 µg of protein. The figure shows, that not all of the protein is immobilized on the beads (supernatant fraction) but the immobilization is pretty stable (very low fluorescence in the wash). After the immobilization, the beads show a high fluorescence indicating the binding of the SgsE | mCitrine fusion protein.
Optimal bead to protein ratio for immobilization
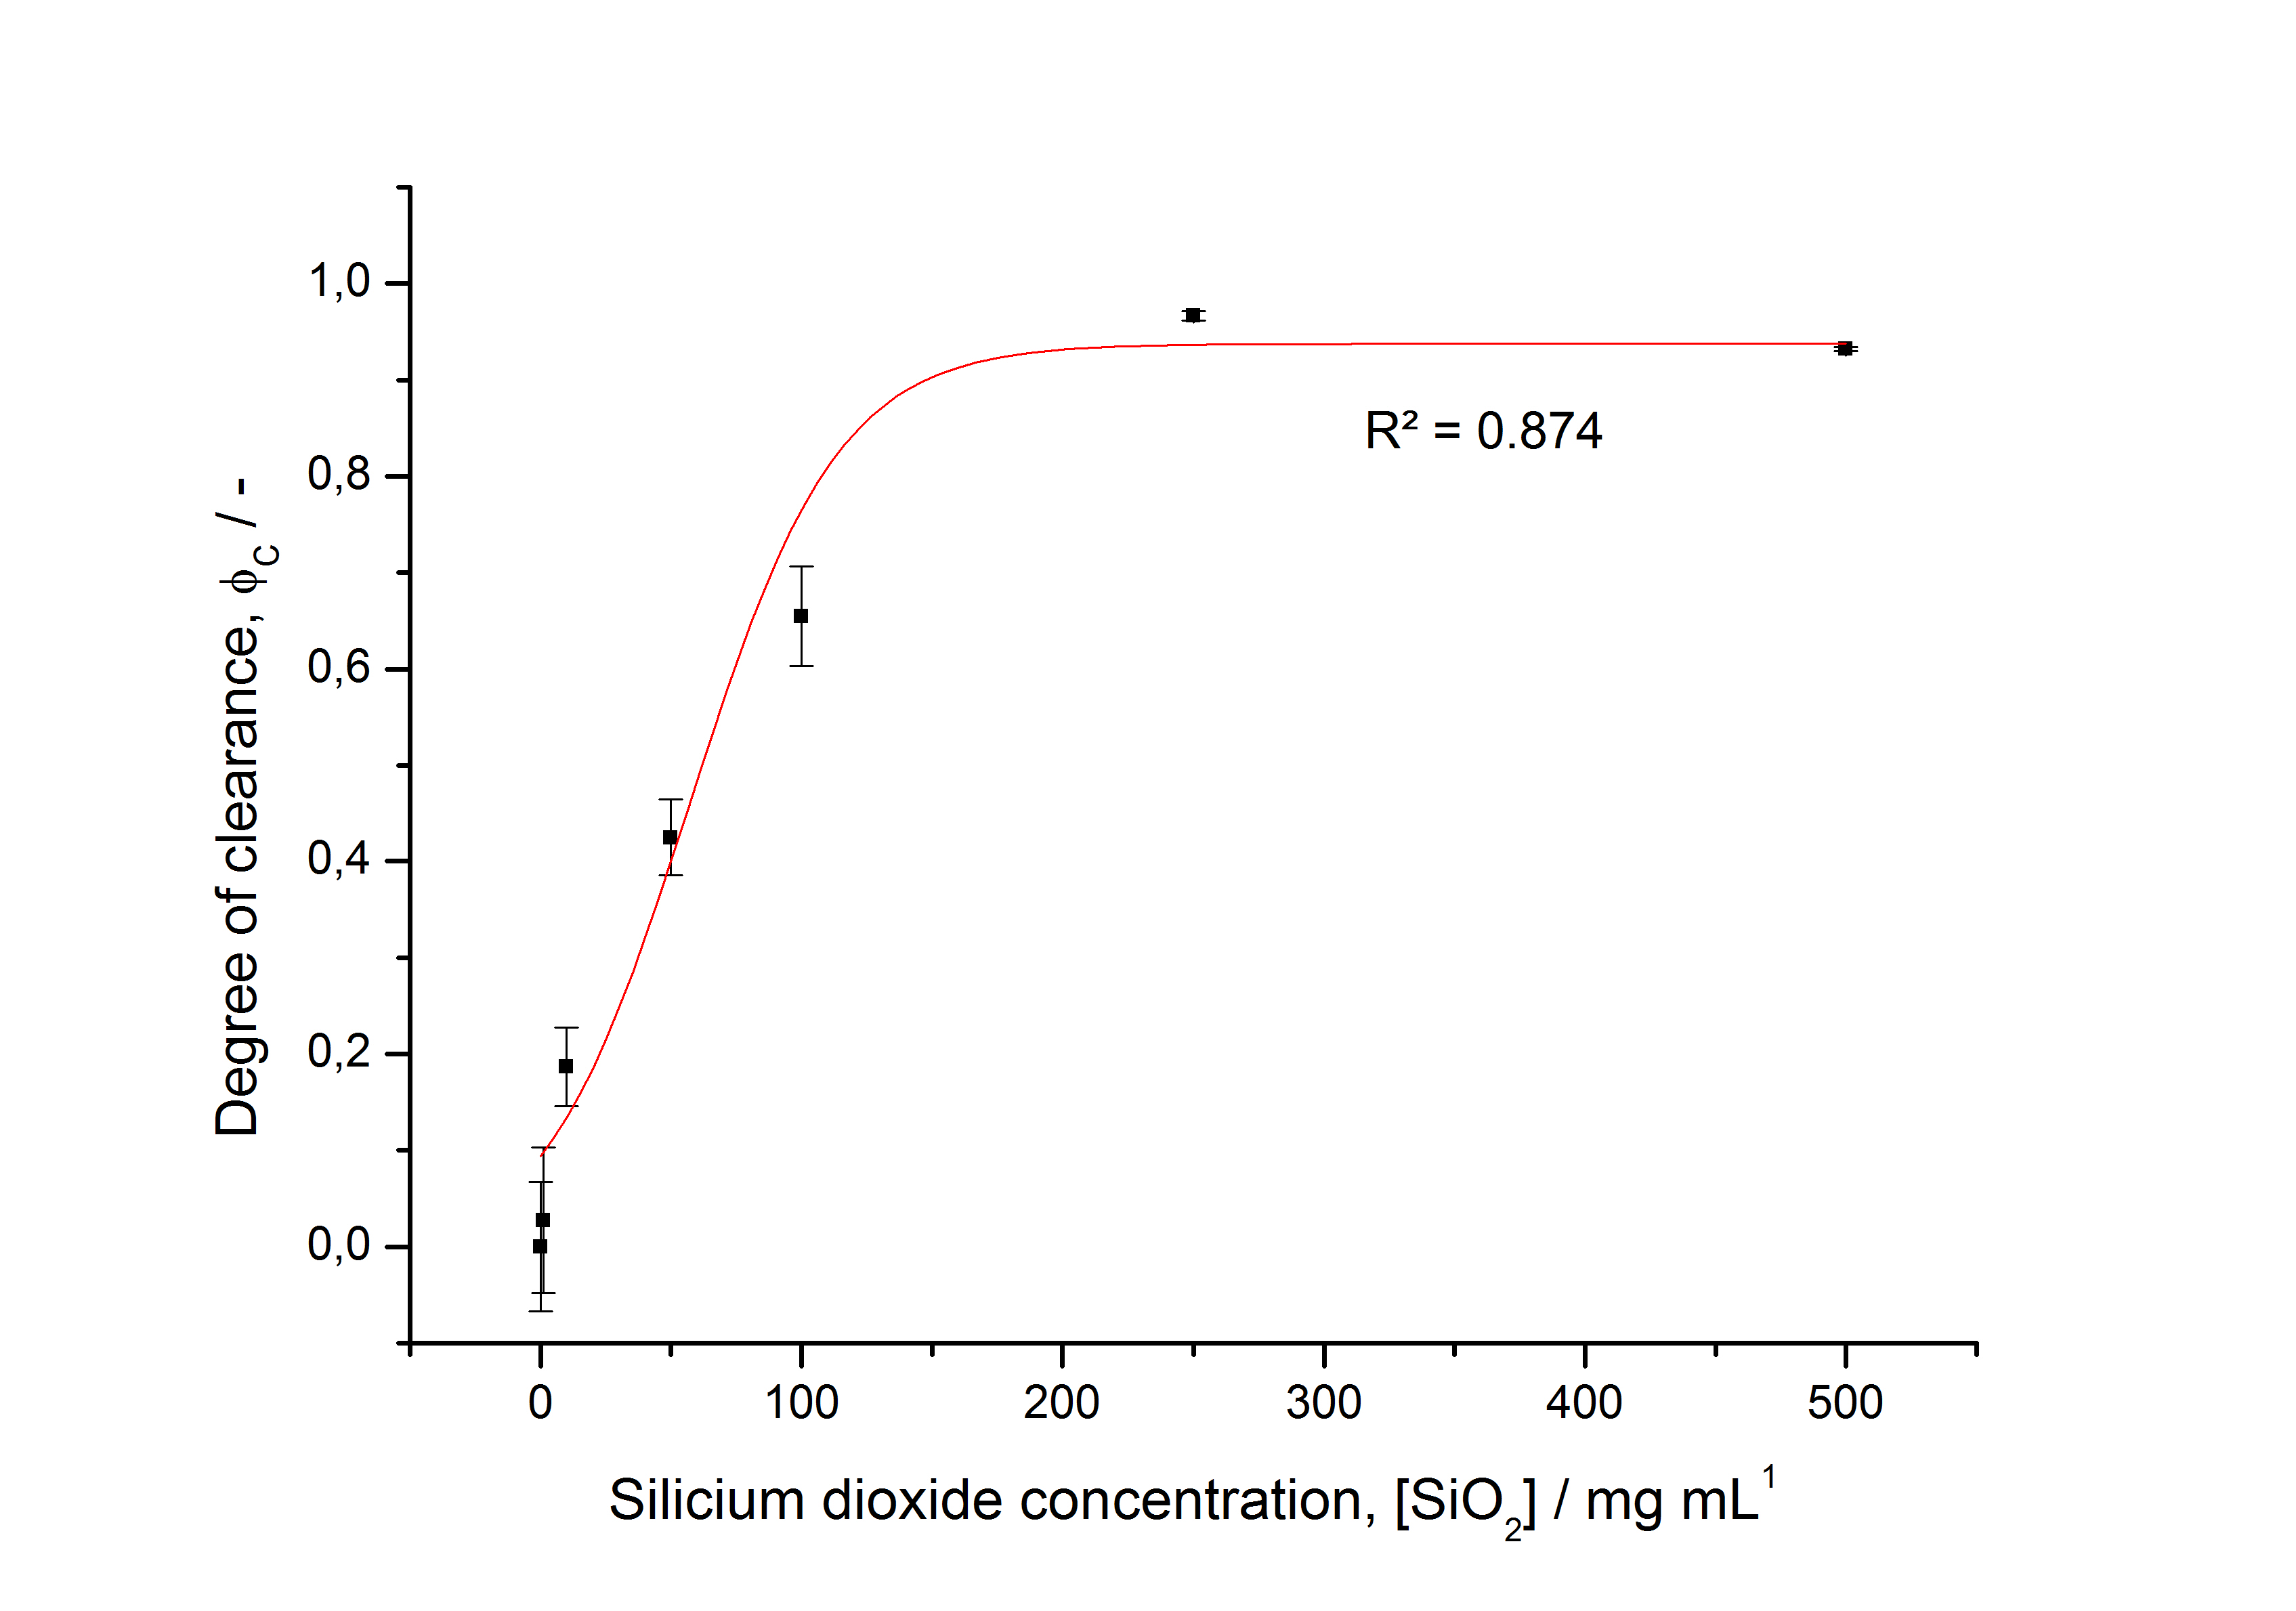
To determine the optimal ratio of silica beads to protein for immobilization, the degree of clearance ϕC in the supernatant is calculated and plotted against the concentration of silica beads used in the accordant immobilization experiment (compare fig. A):
The data was collected in three indipendent experiments. The fluorescence of the samples was measured in the supernatant of the immobilization experiment after centrifuging the silica beads. The fluorescence of the control was measured in a sample which was treated exactly like the others but no silica beads were added. 100 µg protein was used for one immobilization experiment. The data was fitted with a sigmoidal dose-response function of the form
with the Hill coefficient p, the bottom asymptote A1, the top asymptote A2 and the switch point log(x0) (R² = 0.874).
The fit indicates that a good silica concentration for 100 µg of protein is 150 - 200 mg mL-1. This set-up leads to saturated beads with low waste of protein. So a good protein / bead ratio to work with is 5 - 7 * 10-4.
SbpA from Lysinbacillus sphaericus CCM 2177
Purification of SbpA fusion protein
As seen in the analysis of the cultivations with expression of SbpA | mCitrine fusion proteins, these proteins form inclusion bodies in E. coli. Inclusion bodies have the advantage that they are relatively easy to clean-up and are resistant to proteases. So the first purification step is to solve and set-free the inclusion bodies. This step is followed by two filtrations (300 kDa UF and 100 kDa DF/UF) to further concentrate and purify the S-layer proteins. After the filtrations, the remaining protein solution is dialized against ddH2 for 18 h at 4 °C in the dark. The dialysis leads to a precipitation of the water-insoluble proteins. After centrifugation of the dialysate the water-soluble S-layer monomers remain in the supernatant and can be used for recrystallization experiments.
The fluorescence of some collected, important fractions of this purification strategy is shown in the following figure A:
A lot of protein is lost during the purification especially after centrifugation steps (compared to filtrations). The fluorescence in the urea containing fractions is lowered due to denaturation of the fluorescent protein. This purification strategy is very simple and can be carried out by nearly everyone in any lab being one first step to enable real do it yourself nanobiotechnology.
Immobilization behaviour
After purification, solutions of monomeric SbpA S-layer proteins can be recrystallized and immobilized on silicon dioxide beads in recrystallization buffer (0.5 mM Tris-HCl, pH 9, 10 mM CaCl2). After the recrystallization procedure the beads are washed with and stored in ddH2O at 4 °C in the dark. The fluorescence of the collected fractions of a recrystallization experiment with <partinfo>K525405</partinfo> are shown in fig. X. 100 mg beads were coated with 100 µg of protein. The figure shows, that not all of the protein is immobilized on the beads (supernatant fraction) but the immobilization is pretty stable (very low fluorescence in the wash). After the immobilization, the beads show a high fluorescence indicating the binding of the SbpA | mCitrine fusion protein.
Optimal bead to protein ratio for immobilization
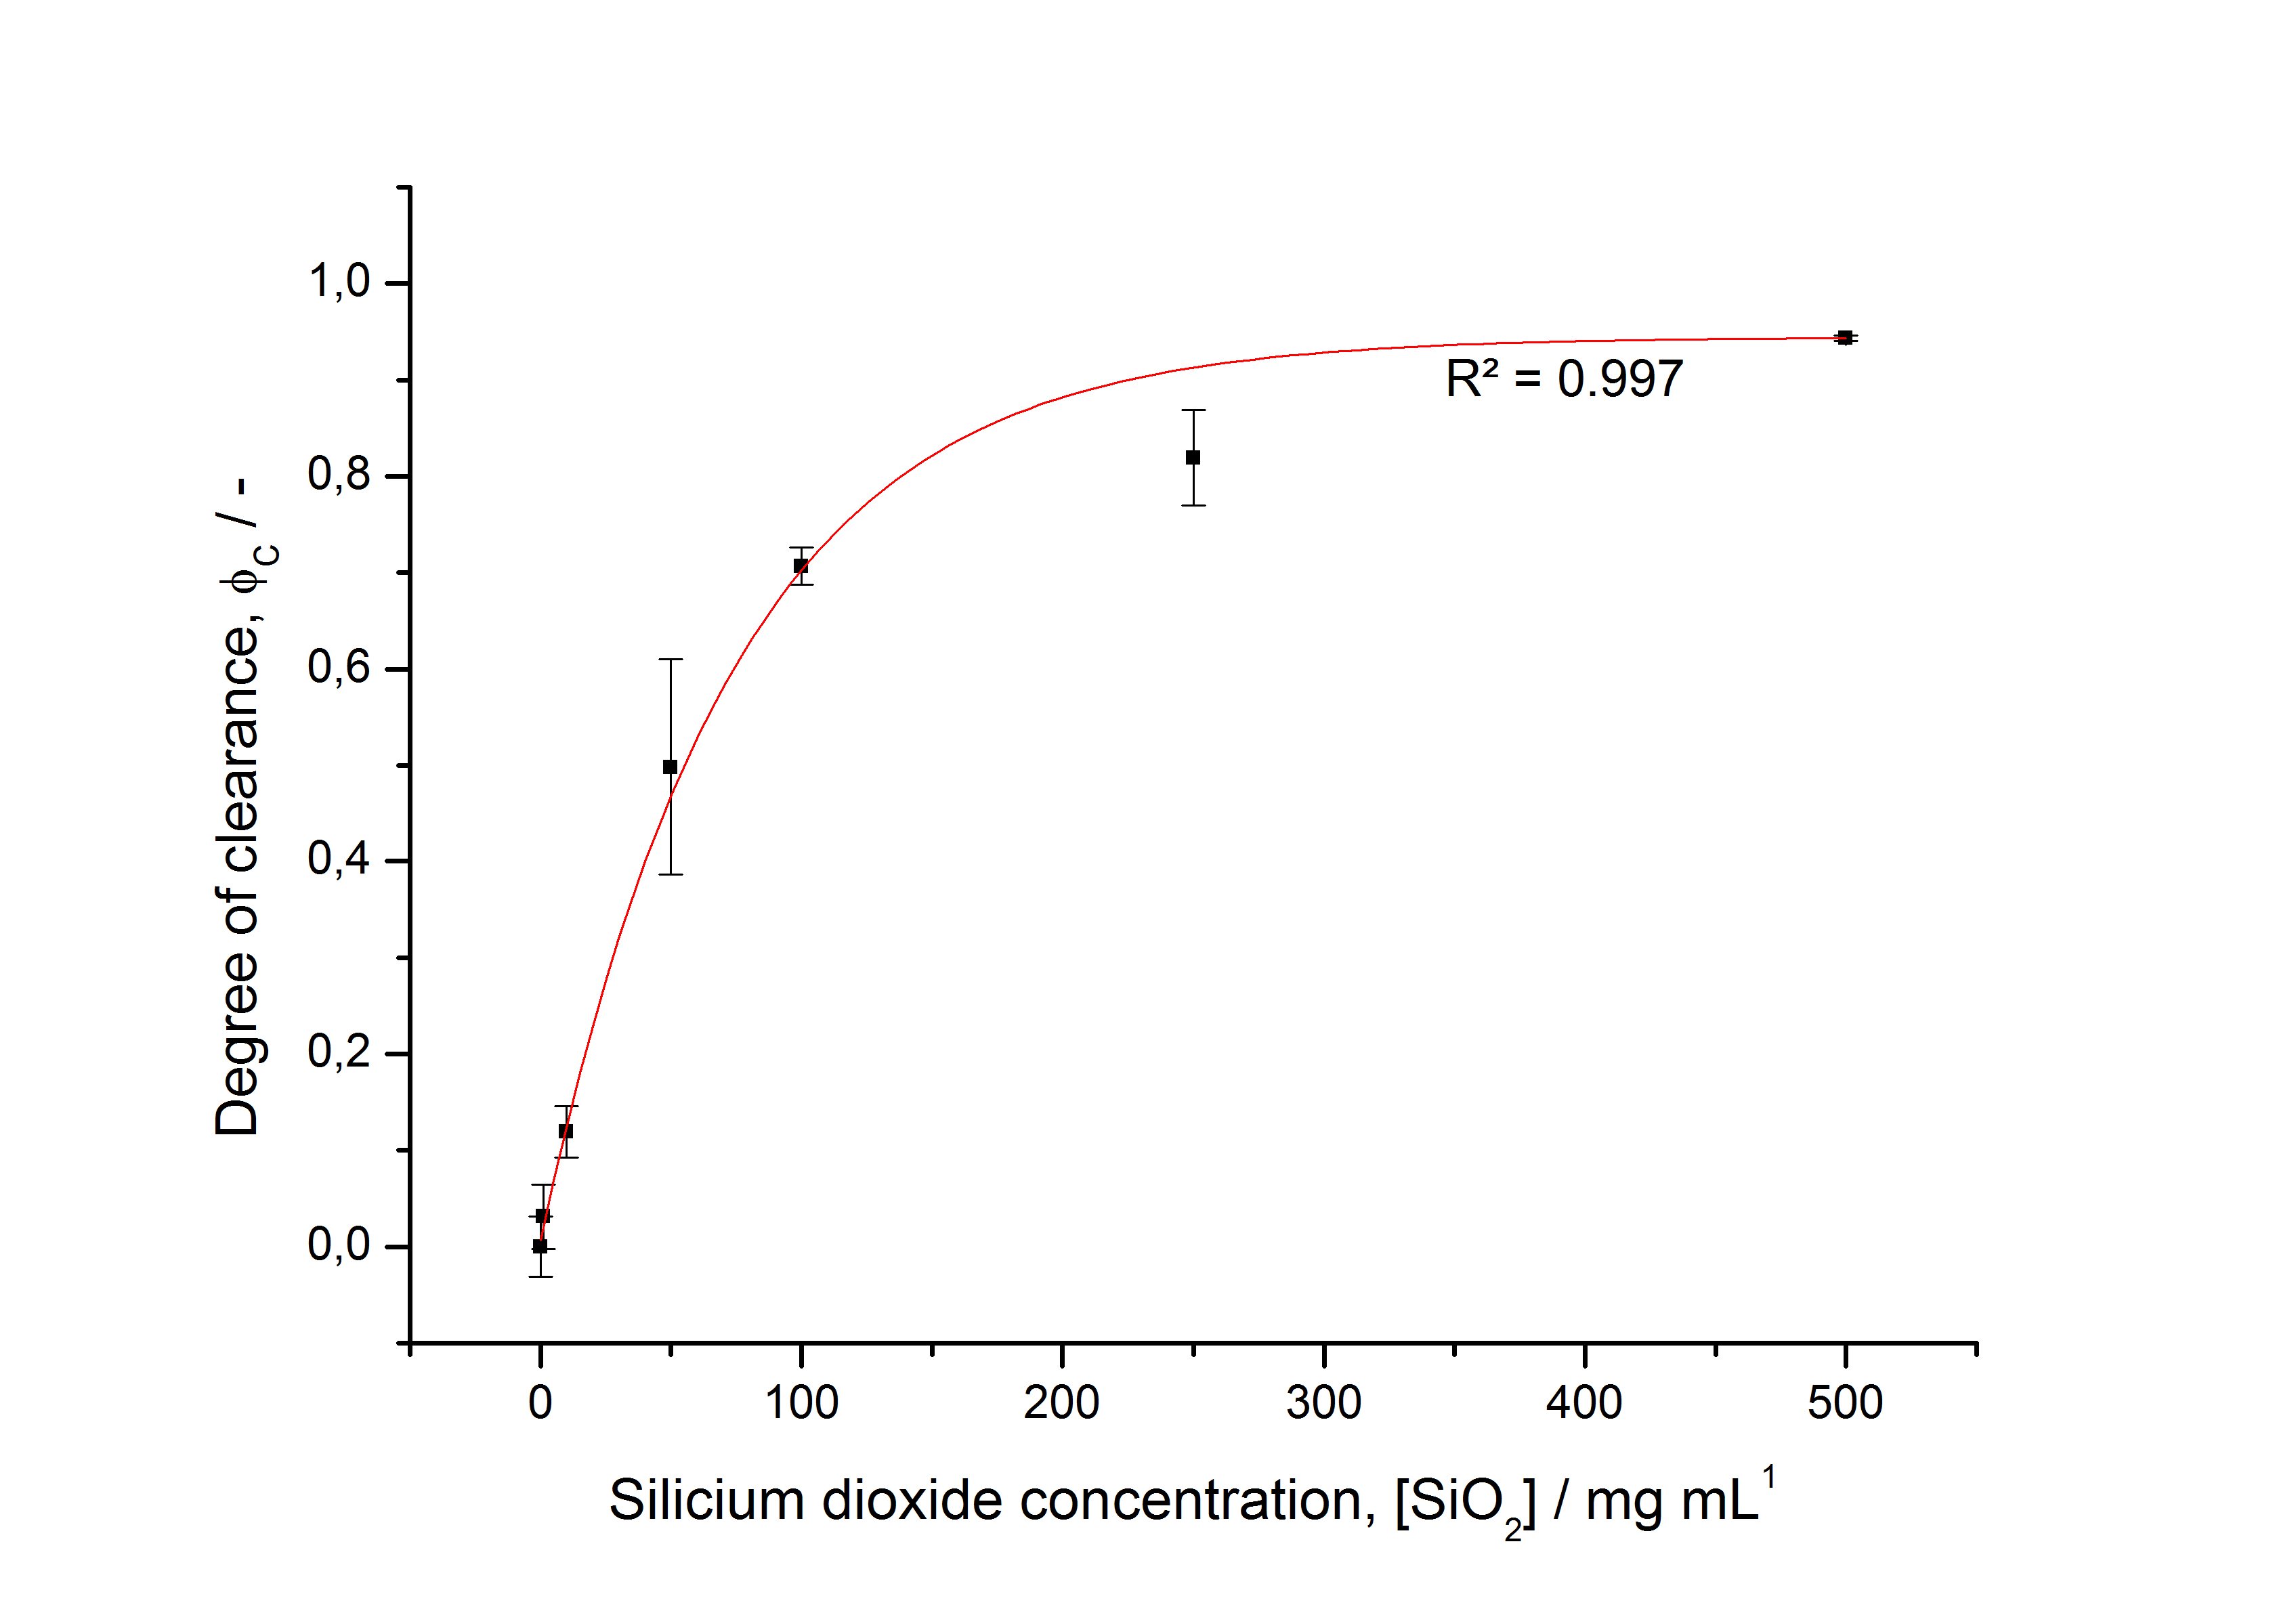
To determine the optimal ratio of silica beads to protein for immobilization, the degree of clearance ϕC in the supernatant is calculated and plotted against the concentration of silica beads used in the accordant immobilization experiment (compare fig. A):
The data was collected in three indipendent experiments. The fluorescence of the samples was measured in the supernatant of the immobilization experiment after centrifuging the silica beads. The fluorescence of the control was measured in a sample which was treated exactly like the others but no silica beads were added. 100 µg protein was used for one immobilization experiment. The data was fitted with a sigmoidal dose-response function of the form
with the Hill coefficient p, the bottom asymptote A1, the top asymptote A2 and the switch point log(x0) (R² = 0.997).
The fit indicates that a good silica concentration for 100 µg of protein is 200 - 250 mg mL-1. This set-up leads to saturated beads with low waste of protein. So a good protein / bead ratio to work with is 7 - 9 * 10-4.
CspB from Brevibacterium flavum
CspB from Corynebacterium halotolerans
CspB with TAT-sequence and without lipid anchor
Purification
After the localisation of the S-layer protein in E. coli, different methods for purification were tested. The results of these methods are shown in fig. X. Fig. X shows, that the CspB protein does not form inclusion bodies in E. coli and most of the protein is transported out of the cell into the periplasm and a lot of protein is even secreted into the medium (all fractions were concentrated by filtration and precipitation, respectively). The secretion into the culture medium is very interesting because the purification is much faster (no cell disruption necessary).
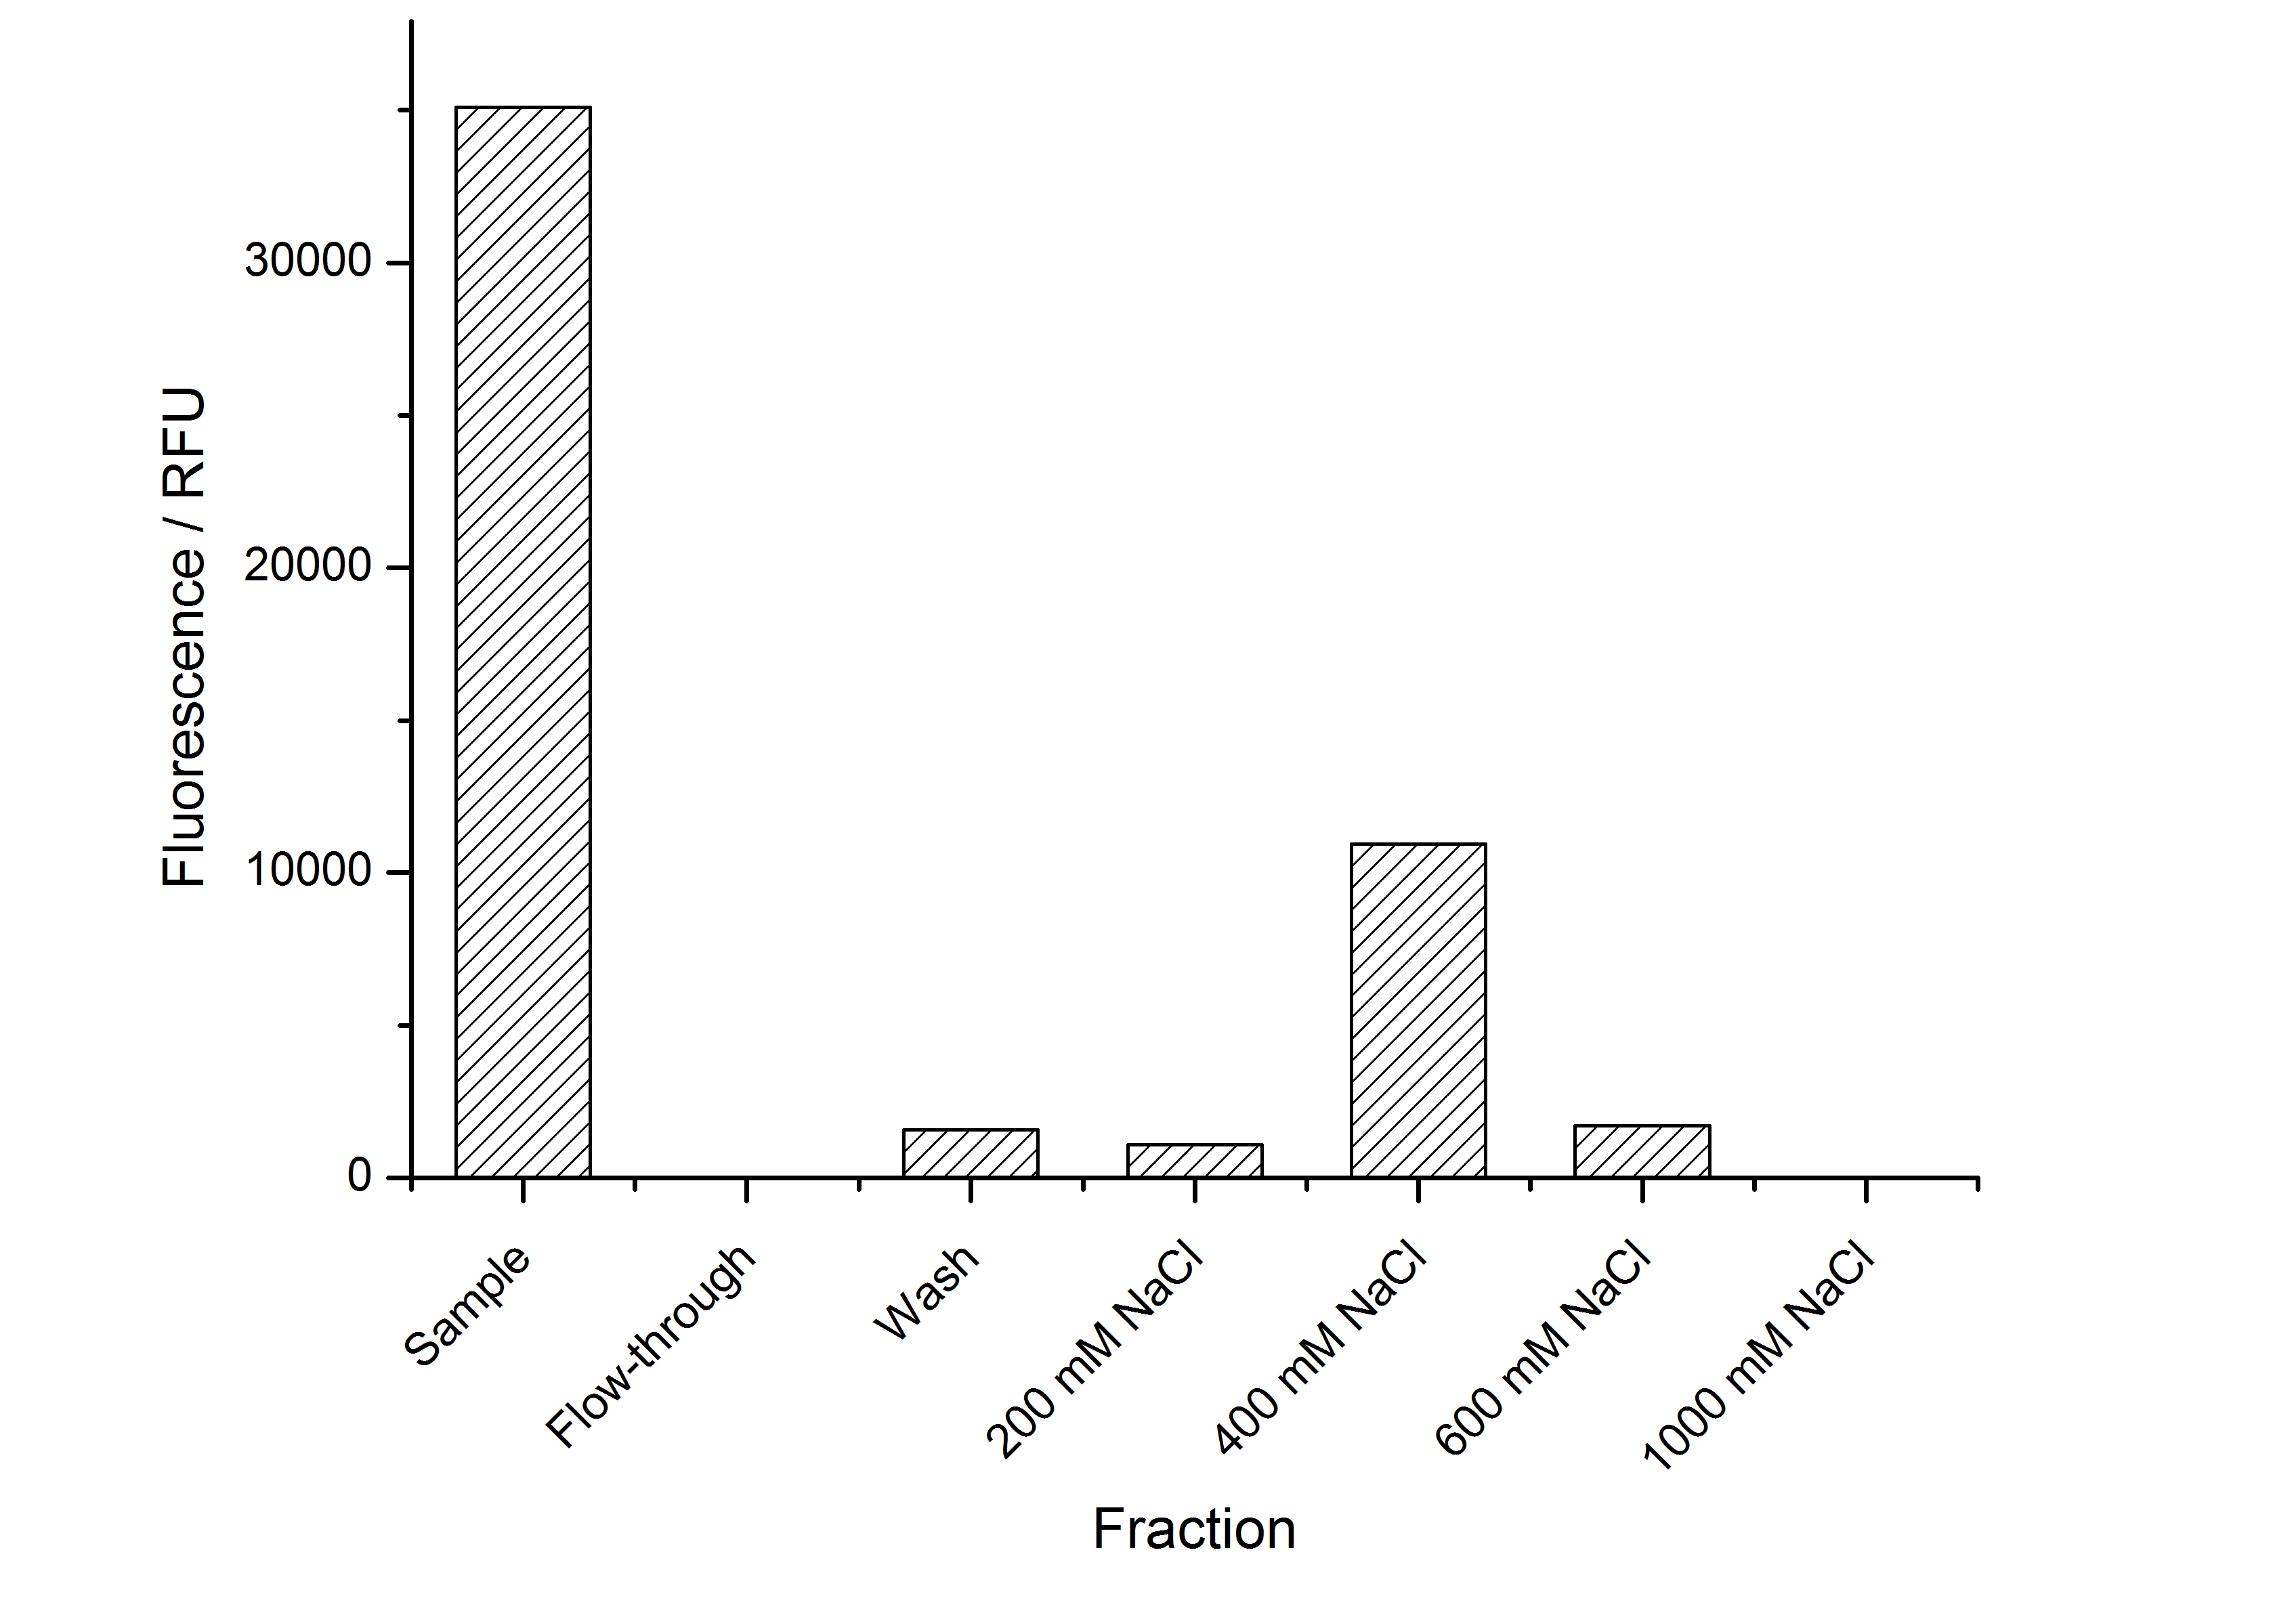
The highest fluorescence could be obtained by a precipitation with ammonium sulfate of the culture supernatant followed by an ultrafiltration with a 300 kDa membrane and a diafiltration with a 50 kDa membrane. The diafiltration was against a binding buffer for an anion exchange chromatography (25 mM sodium acetate, 25 mM sodium chloride) with pH 6, due to the theoretical pI of <partinfo>k525234</partinfo>. The fluorescence of the collected fractions of the following anion exchange chromatography are shown in fig. B.
The binding conditions are well chosen because nearly all of the protein binds to the column. The protein is eluted from the column with rising sodium chloride concentrations. The highest fluorescence is in the elution fraction with 400 mM sodium chloride. 600 mM sodium chloride elutes all of the S-layer fusion proteins.
 "
"

