Team:ETH Zurich/Process/Microfluidics/Proof
From 2011.igem.org
(→Results) |
(→Results) |
||
| Line 25: | Line 25: | ||
== Results == | == Results == | ||
Fluorescence pictures of the tube showed a clear gradient of the fluorescence signal over approximately 5 cm of the tube. After 5 cm, the signal strength dropped under the background noise. | Fluorescence pictures of the tube showed a clear gradient of the fluorescence signal over approximately 5 cm of the tube. After 5 cm, the signal strength dropped under the background noise. | ||
| + | |||
| + | |||
[[File:ETHZ Gradient.png|800px|center|thumb|'''Figure 6: GFP gradient in tube:''' ''E. coli'' strain JM101 with IPTG-inducible GFP was incubated in the tube. GFP expression was assessed under the fluorescent microscope after overnight incubation, with a excitation wavelength of 480 nm and a emission wavelength of 510 nm. The 15 microscope photos were reassembled into one using [http://research.microsoft.com/en-us/um/redmond/groups/ivm/ICE/ the Microsoft Research Image Composite Editor].]] | [[File:ETHZ Gradient.png|800px|center|thumb|'''Figure 6: GFP gradient in tube:''' ''E. coli'' strain JM101 with IPTG-inducible GFP was incubated in the tube. GFP expression was assessed under the fluorescent microscope after overnight incubation, with a excitation wavelength of 480 nm and a emission wavelength of 510 nm. The 15 microscope photos were reassembled into one using [http://research.microsoft.com/en-us/um/redmond/groups/ivm/ICE/ the Microsoft Research Image Composite Editor].]] | ||
| Line 32: | Line 34: | ||
[[File:Quantification.png|600px|center|thumb|'''Figure 7: Quantification of the gradient''' in Figure 2: The light intensity of the IPTG-induced GFP signal was quantified by a 80×80 pixel moving average. The peak at around 1.2cm is due to an air bubble in the channel.]] | [[File:Quantification.png|600px|center|thumb|'''Figure 7: Quantification of the gradient''' in Figure 2: The light intensity of the IPTG-induced GFP signal was quantified by a 80×80 pixel moving average. The peak at around 1.2cm is due to an air bubble in the channel.]] | ||
| + | |||
The fluorescence distribution of this experiment has a similar shape as the distributions predicted by the model (see [[Team:ETH_Zurich/Modeling/Microfluidics#Simulation|modeling section]]). The difference in the experimental results compared to the simulations can be explained mainly due to the different diffusing molecules: the simulations were obtained for acetaldehyde, whereas the experiments were carried out with IPTG. We expect the different values of the diffusion as well as of the degradation constants of the two molecules to be the main reason for the differences. | The fluorescence distribution of this experiment has a similar shape as the distributions predicted by the model (see [[Team:ETH_Zurich/Modeling/Microfluidics#Simulation|modeling section]]). The difference in the experimental results compared to the simulations can be explained mainly due to the different diffusing molecules: the simulations were obtained for acetaldehyde, whereas the experiments were carried out with IPTG. We expect the different values of the diffusion as well as of the degradation constants of the two molecules to be the main reason for the differences. | ||
Revision as of 21:11, 28 October 2011
Proof of Concept
In this section we describe the proof of principle we performed to validate our system. The experiment was performed to see whether the diffusion-only design with agarose-immobilized cells in a channel (without flow) would work for the SmoColi system.
Experimental setup
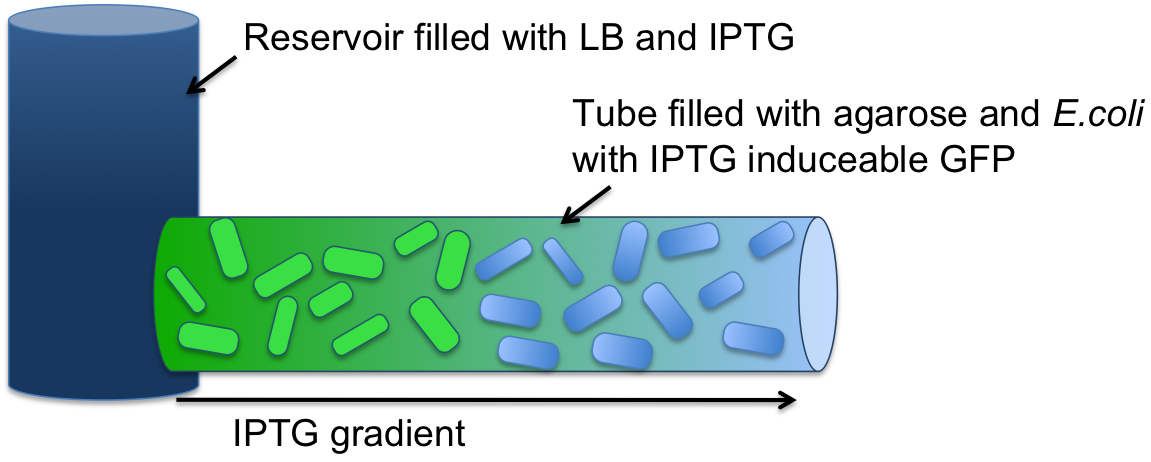
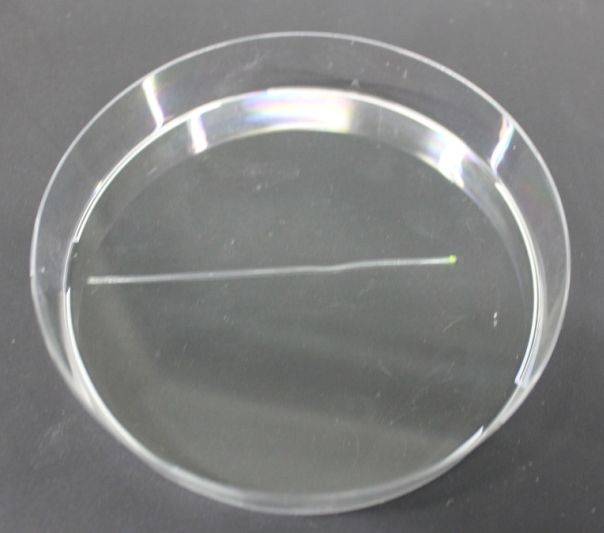
Modeling showed that diffusion and degradation of the inducer is enough to create a concentration gradient in the channel. The experimental validation of this hypothesis was first performed in a 2mm diameter tube. For proof of concept, we engineered E. coli strain JM101 to express GFP upon IPTG induction. The cells then were immobilized in agarose and the suspension was added to the tube (see Figure 4). One end of the tube was connected to a resevoir (1.5 ml) containing 10 mM IPTG solution. After incubation at 37 °C overnight, an IPTG-inducible GFP gradient could be observed (Figure 6 and 7). The experiment confirmed the modeling results. Our cells survived and we concluded that we do not need constant supply of nutrients.
Because there is no flow needed in the setup, the whole design is rather simple compared to the ones where flow is included (Microfluidic Channel Design). Here, the whole channel can simply be filled with cell-agarose suspension. Upon solidification to a gel, the channel can be connected to a reservoir containing the inducer molecule on one side. Likewise we do not need recycling because AHL can diffuse through the whole channel and does not have to diffuse against a flow. Moreover, having a tube instead of a microfluidic device would save us some time that we would need otherwise for the channel construction.
Modeling the system thus had a profound effect on the process design, leading to an extensive reduction of complexity and error-proneness. Additionally, the AHL induced alarm system would be much easier to establish in a channel without flow.
Results
Fluorescence pictures of the tube showed a clear gradient of the fluorescence signal over approximately 5 cm of the tube. After 5 cm, the signal strength dropped under the background noise.

We quantified the fluorescence signal using a moving average of 80×80 pixel, which moved along the symmetry axis of the tube (see Figure 7), in red you can see the corresponding reaction diffusion model.
The fluorescence distribution of this experiment has a similar shape as the distributions predicted by the model (see modeling section). The difference in the experimental results compared to the simulations can be explained mainly due to the different diffusing molecules: the simulations were obtained for acetaldehyde, whereas the experiments were carried out with IPTG. We expect the different values of the diffusion as well as of the degradation constants of the two molecules to be the main reason for the differences.
 "
"

