Team:Bielefeld-Germany/Modell
From 2011.igem.org
(→Second reaction) |
(→Second reaction) |
||
| Line 29: | Line 29: | ||
For this we assume that the molecular amount of NAD<sup>+</sup> is equal to the molecular amount of degraded BPA less the amount of beacon in open state. The required electrons for the degradation of one BPA molecule, more precisely for the activation of the oxygen in the cytochrome P450 monooxygenase system, are released by the oxidation of one molecule of the cofactor NADH. The transformation reaction of beacon in closed state to beacon in open state decreases the NAD+ amount by one molecule. | For this we assume that the molecular amount of NAD<sup>+</sup> is equal to the molecular amount of degraded BPA less the amount of beacon in open state. The required electrons for the degradation of one BPA molecule, more precisely for the activation of the oxygen in the cytochrome P450 monooxygenase system, are released by the oxidation of one molecule of the cofactor NADH. The transformation reaction of beacon in closed state to beacon in open state decreases the NAD+ amount by one molecule. | ||
| - | [[Image:Bielefeld-Germany2011-NADequalsBPAdeg.png|center| | + | [[Image:Bielefeld-Germany2011-NADequalsBPAdeg.png|center|200px]] <div align="right">(4)</div> |
The velocity V<sub>2</sub> is calculated by multiplying the k<sub>cat</sub>-value of 0.0212 s<sup>-1</sup> found in the [http://onlinelibrary.wiley.com/doi/10.1046/j.1432-1327.2000.01377.x/pdf literature] with the used concentration of NAD<sup>+</sup>. | The velocity V<sub>2</sub> is calculated by multiplying the k<sub>cat</sub>-value of 0.0212 s<sup>-1</sup> found in the [http://onlinelibrary.wiley.com/doi/10.1046/j.1432-1327.2000.01377.x/pdf literature] with the used concentration of NAD<sup>+</sup>. | ||
Revision as of 20:29, 28 October 2011


Contents |
Modeling of cell-free bisphenol A degradation
In our project we want to construct a cell-free biosensor that can detect bisphenol A (BPA). To be more specific we want to fuse proteins to silica beads that degrade the BPA and detect NAD+ that is set free in the reaction by a NAD+-dependent DNA ligase (also attached to the beads) in combination with a molecular beacon.
Modeling cell-free processes
The fact that our project aims at the construction of a cell-free biosensor has huge advantages regarding the complexity of the model, as it is possible to simulate our project in a small number of differential equations. There are several reasons why this is possible. First off, we do not need to consider the transcription- and translationrate and other factors influencing the molecular amount of proteins in cells. As we extract our proteins from the E.coli cells we produced them in we have knowledge about the exact amount introduced to our cell-free system. Furthermore we can state that the protein amount in our system is constant, as our system does not contain any proteases. To have the knowledge about the exact amount of enzymes in our system supplies the modeling with another advantage. We only need to simulate the reactions that are rate-limiting. In case of our model we state that only the BPA concentration is limiting while the enzymes and the NADH are present in surplus quantities. This allows to simplify the first reaction a great deal, as it is not necessary to simulate the electron transport in the Cytochrome P450 monooxygenase system. The third, and by far most important advantage of cell-free modeling is, that we do not need to make a lot of assumptions regarding the system we want to simulate the reaction in. When modeling a reaction in a cell there are a lot of parameters difficult to estimate, for example the contribution of the reactants in the cell or what signaling networks might be triggered by the reaction of interest.
First reaction
The first reaction is the degradation of BPA by the Cytochrome P450 monooxygenase system (the components of this system are cytochrome P450 (<partinfo>K123000</partinfo>), ferredoxin (<partinfo>K123001</partinfo>) and ferredoxin reductase (<partinfo>K525499</partinfo>)). The velocity of the BPA degradation can be calculated by Michaelis Menten enzyme kinetics:
The velocity V1 was calculated dependent on the enzyme concentration and the kcat-value of the monooxygenase system which was 3.9 min-1([http://www.ncbi.nlm.nih.gov/pmc/articles/PMC1317416/ Sasaki, 2005b]).
Second reaction
In the second reaction the NAD+-dependent DNA-ligase from E.coli (<partinfo>K525710</partinfo>) is used to transfer the molecular beacon from its closed state (bcs) to its open state bos. It can be described by the following reaction scheme:
The rate of a reaction with two substrates is calculated by the following equation (assuming initial product concentration is 0):
where KiA is the binding affinity of the inhibitor to substrate A, KmA and KmB the Michaelis-Menten constants for substrate A respectively B in the specific reaction. So the amount of the molecular beacons open state is described by the equation
For this we assume that the molecular amount of NAD+ is equal to the molecular amount of degraded BPA less the amount of beacon in open state. The required electrons for the degradation of one BPA molecule, more precisely for the activation of the oxygen in the cytochrome P450 monooxygenase system, are released by the oxidation of one molecule of the cofactor NADH. The transformation reaction of beacon in closed state to beacon in open state decreases the NAD+ amount by one molecule.
The velocity V2 is calculated by multiplying the kcat-value of 0.0212 s-1 found in the [http://onlinelibrary.wiley.com/doi/10.1046/j.1432-1327.2000.01377.x/pdf literature] with the used concentration of NAD+. For KmNAD+ and Kmbos we use the values we found in the literature ([http://www.sciencedirect.com/science/article/pii/S0003269702003020 Chen et al., 2002]):
KmNAD+= 0.5 µM
Kmbos= 0.06 µM
Regarding KiNAD+ we considered AMP and NMN as possible inhibitors ([http://www.sciencedirect.com/science/article/pii/S0003269702003020 Chen et al., 2002]) for the reaction. The literature provides half maximal inhibitory concentrations (IC50-values) of 3.1 mM for AMP and 9.5 µM for NMN. We assume that AMP has no significant influence in our model, as the IC50-value is quite high. The IC50-value of NMN on the other hand is in closer range to concentrations that might be achieved during the performance of our test, so we do consider it in our calculations. To determine KiNAD+ we used the formula
yielding an value of 0.45 µM for NMN.
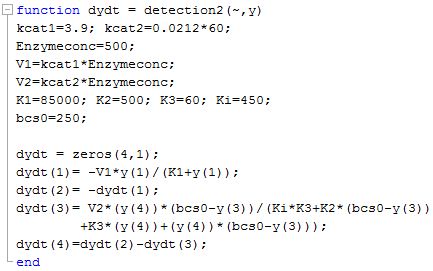
Implementation of the equations for the first and the second reaction in matlab:
Figure 2 shows the simulation of our model for a timespan of 120 minutes.
Modelling of intracellular bisphenol A degradation
Regular model
The modelling was done with the software [http://www.berkeleymadonna.com/ Berkeley Madonna] using the [http://en.wikipedia.org/wiki/Runge–Kutta_methods#Common_fourth-order_Runge.E2.80.93Kutta_method common fourth-order Runge-Kutta] method to solve the equations. The model was fitted to the measured data shown above by the function "curve fit" in Berkeley Madonna to calculate the parameters, constants etc.
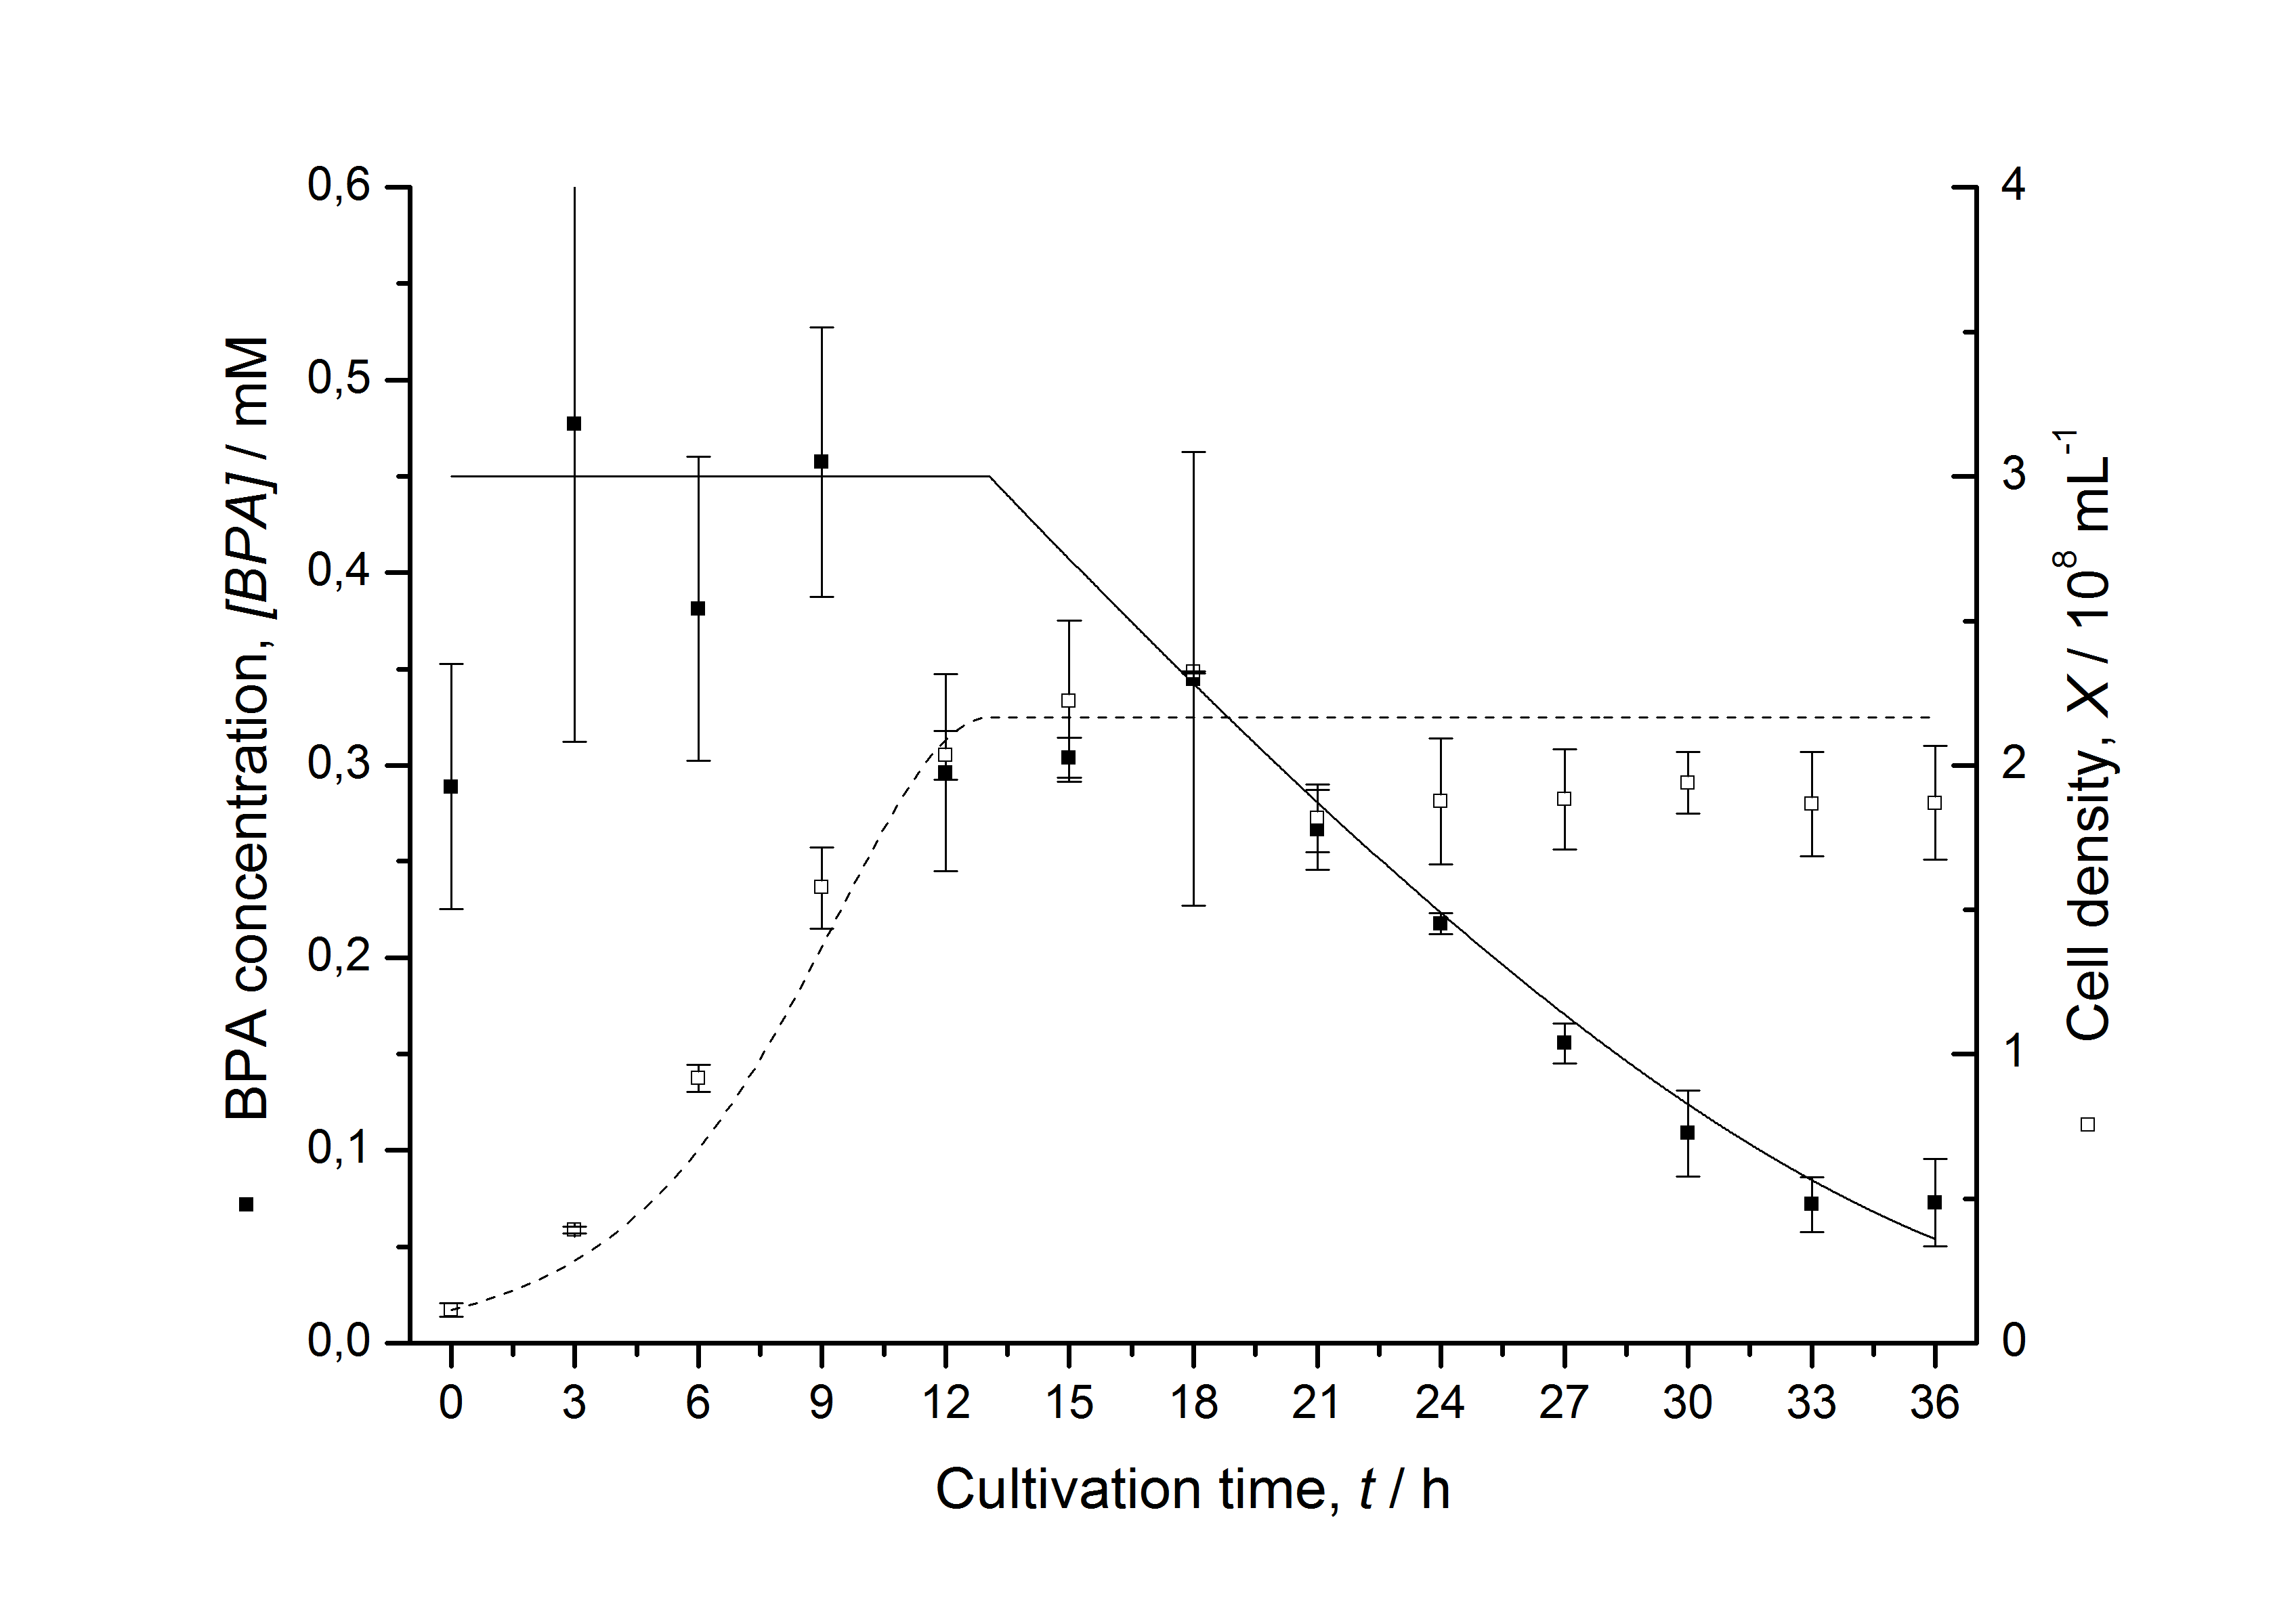
To model the BPA degradation by E. coli carrying BioBricks for BPA degradation (<partinfo>K123000</partinfo> and <partinfo>K123001</partinfo>) the cell growth has to be described first to calculate a specific BPA degradation rate per cell. The observed growth of E. coli on (our) LB medium was [http://en.wikipedia.org/wiki/Diauxie diauxic] with two different growth phases. Cell growth is a [http://en.wikipedia.org/wiki/First_order_kinetics#First-order_reactions first-order reaction] and is mathematically described as
with the specific growth rate µ and the cell count X. The specific growth rate is dependent on the concentration of the growth limiting substrate (e.g. glucose) and can be described as
with the substrate concentration S, the Monod constant KS and the maximal specific growth rate µmax ([http://www.annualreviews.org/doi/abs/10.1146/annurev.mi.03.100149.002103 Monod, 1949]). Because LB medium is a complex medium we cannot measure the substrate concentration so we have to assume an imaginary substrate concentration. Due to the diauxic growth two different substrates with different Monod constants and consumption rates are necessary to model the cell growth. The amount of a substrate S can be modelled as follows
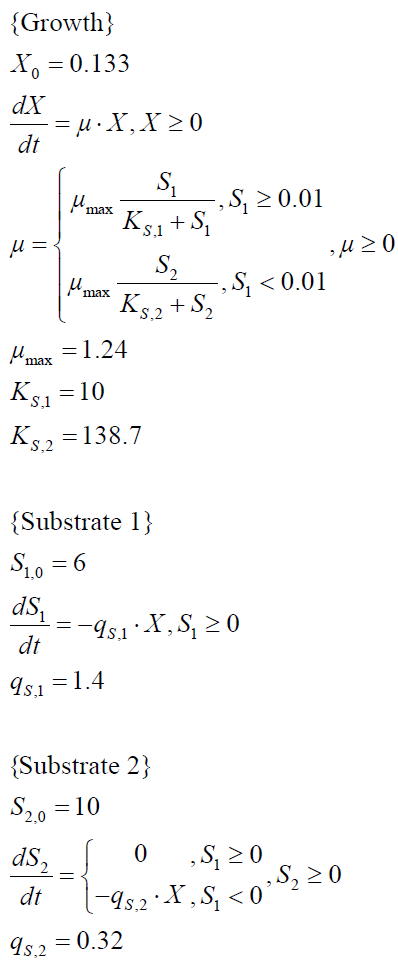
with the specific substrate consumption rate per cell qS. The whole model for the diauxic growth of E. coli on LB medium with two not measurable (imaginary) substrates looks like:
The specific BPA degradation rate per cell qD is modelled with an equation like eq. (7). In the beginning of the cultivations, when E. coli growths on the "good" imaginary substrate S1, no BPA degradation is observed. When this substrate is consumed, the BPA degradation starts. The model for this diauxic behavior is as follows:
Figures 3 - 6 show a comparison between modelled and measured data for cultivations with BPA degrading E. coli. In Tab. 1 the parameters for the model are given, obtained by curve fitting the model to the data.
Model for the fusion protein between FNR, BisdA and BisdB
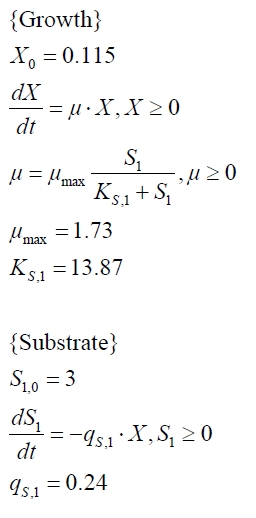
The cultivations and BPA degradation of E. coli KRX carrying a fusion protein consisting of ferredoxin-NADP+ oxidoreductase, ferredoxinbisd and cytochrome P450bisd differ from the cultivations with the other BPA degrading BioBricks. Thus, the model for these cultivations has to be adjusted to this behaviour. First of all, no diauxic growth is observed so the growth can be modelled more easily like
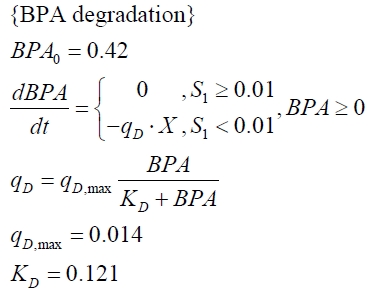
The BPA degradation starts when the imaginary substrate is depleted, like observed in the other cultivations with BPA degrading BioBricks. But it seems that the BPA degradation is getting slower with longer cultivation time. So it is modelled with a Monod-like term in which the specific BPA degradation rate is dependent from the BPA concentration:
with the maximal specific BPA degradation rate qD,max and the constant KD.
Figures 7 shows a comparison between modelled and measured data for cultivations with BPA degrading fusion protein E. coli. In Tab. 1 the parameters for the model are given, obtained by curve fitting the model to the data.
Comparison between modelled and measured data
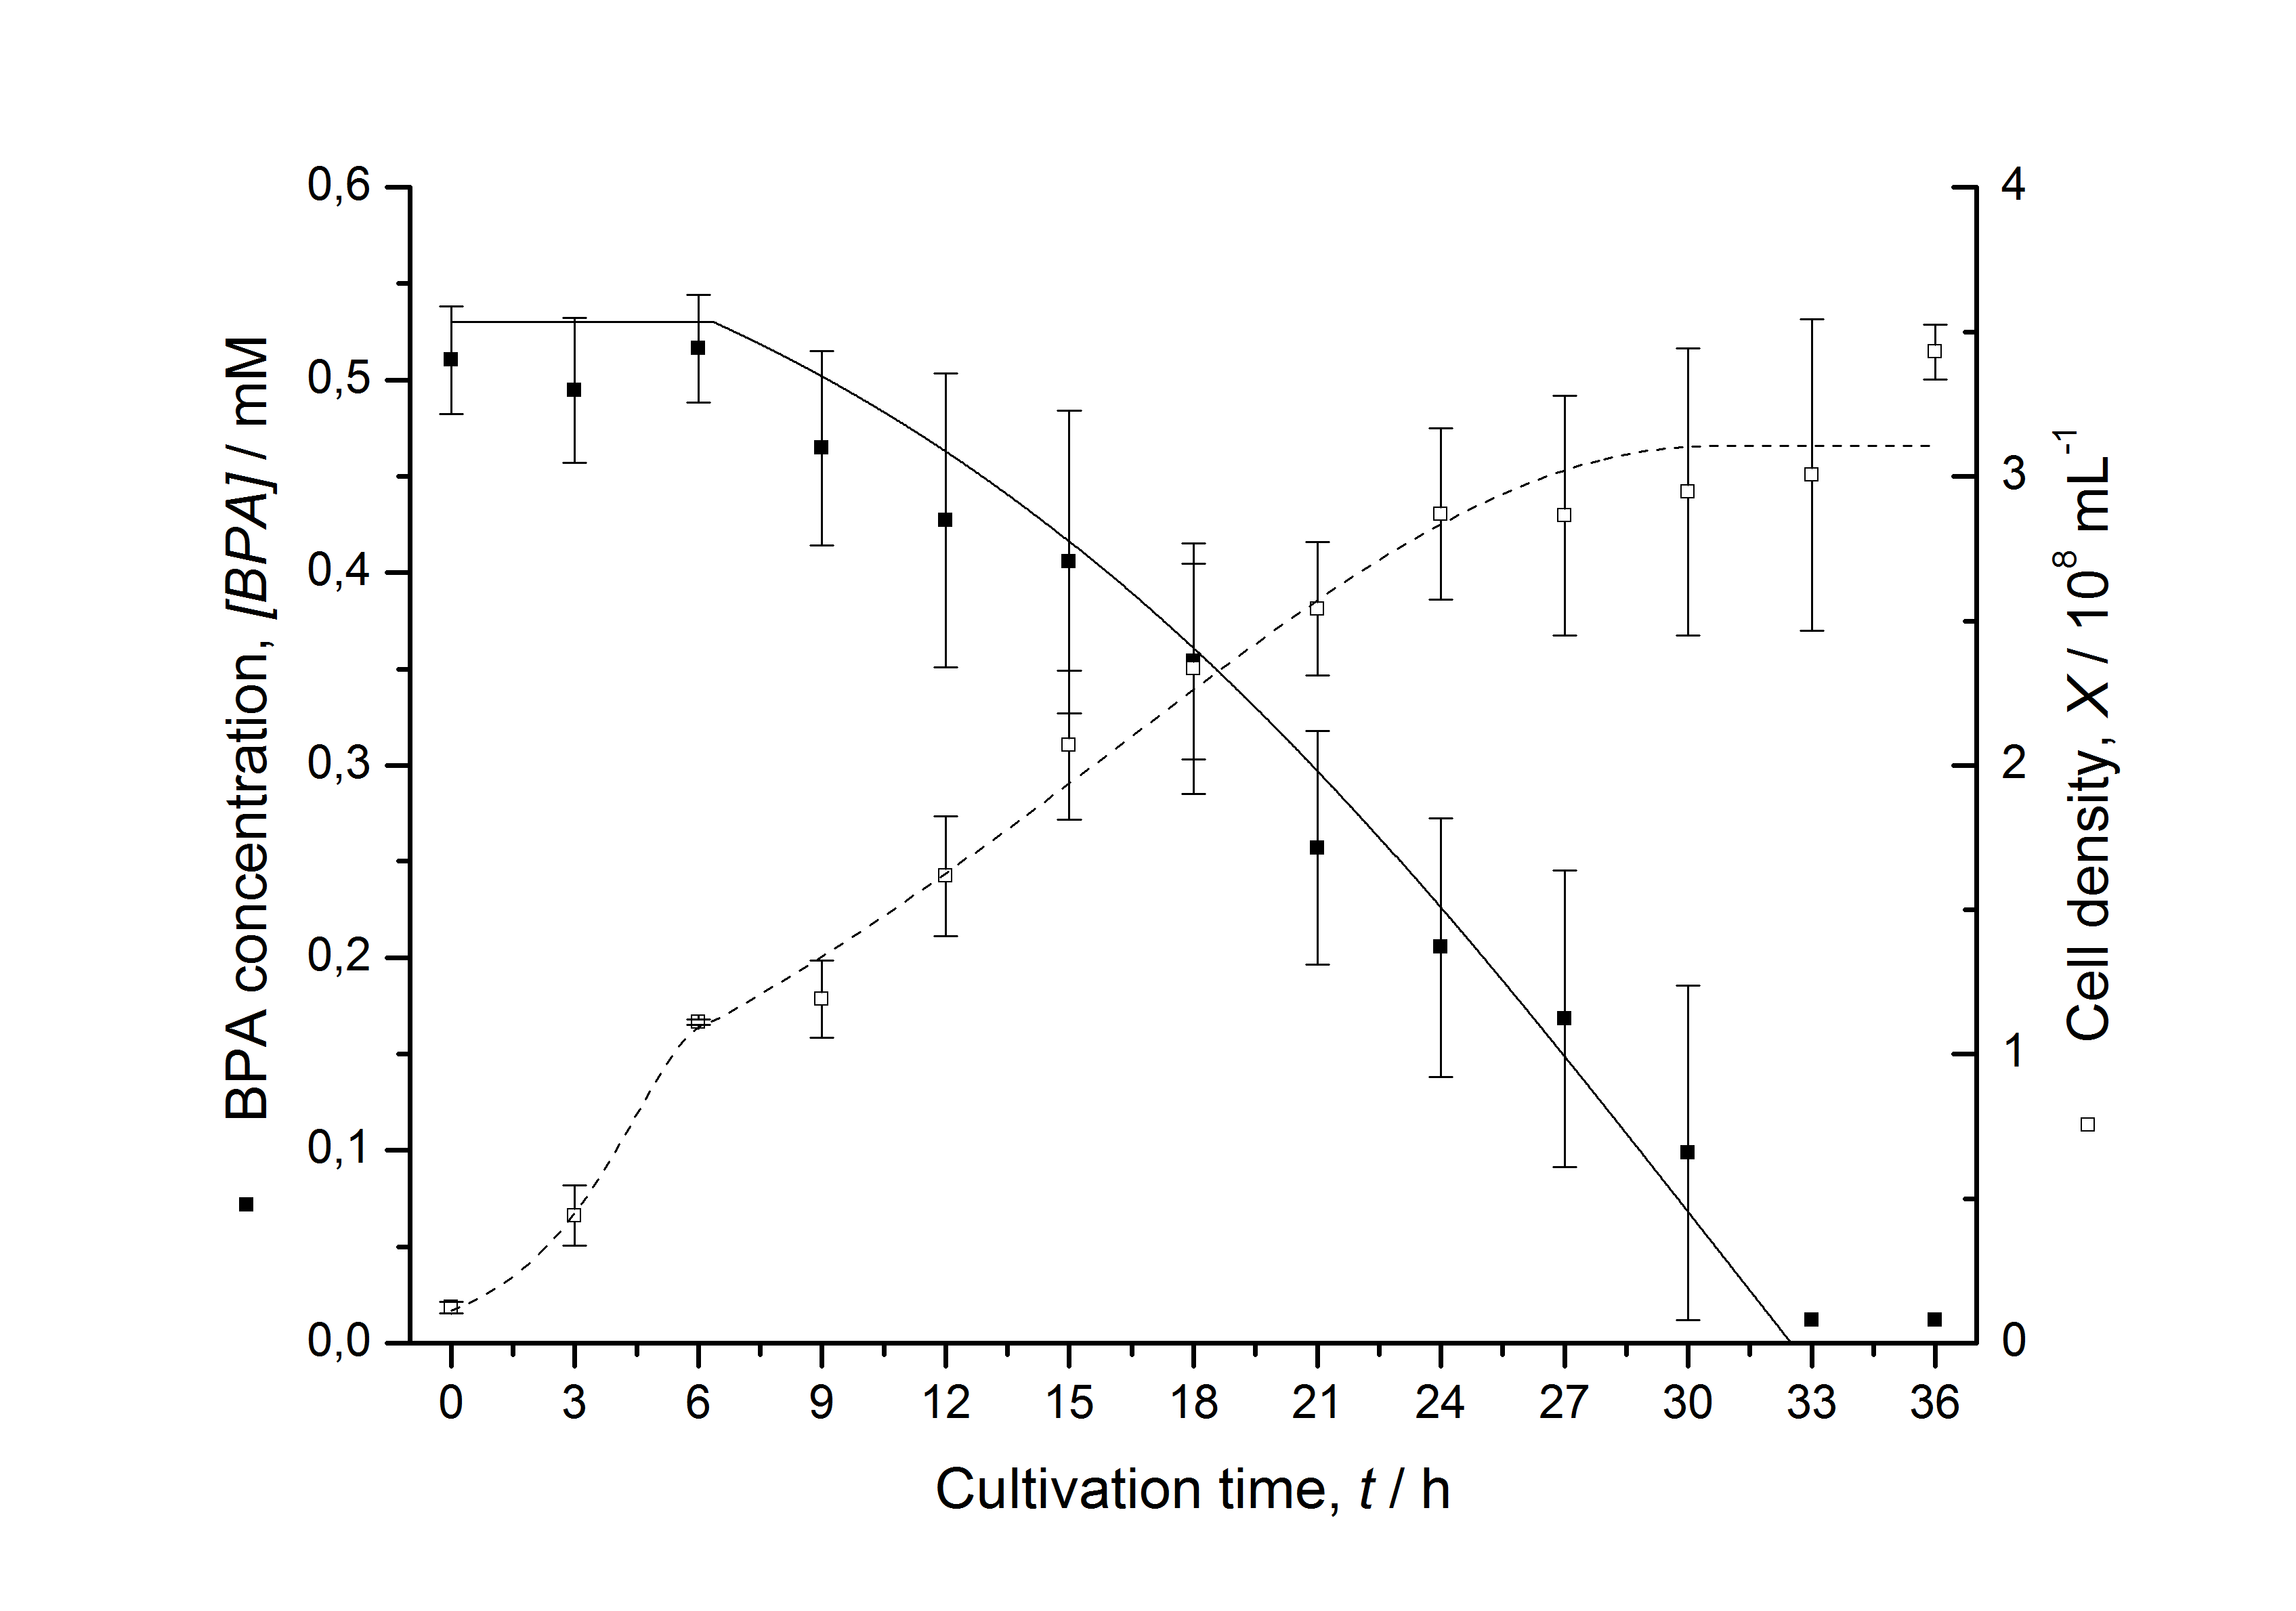
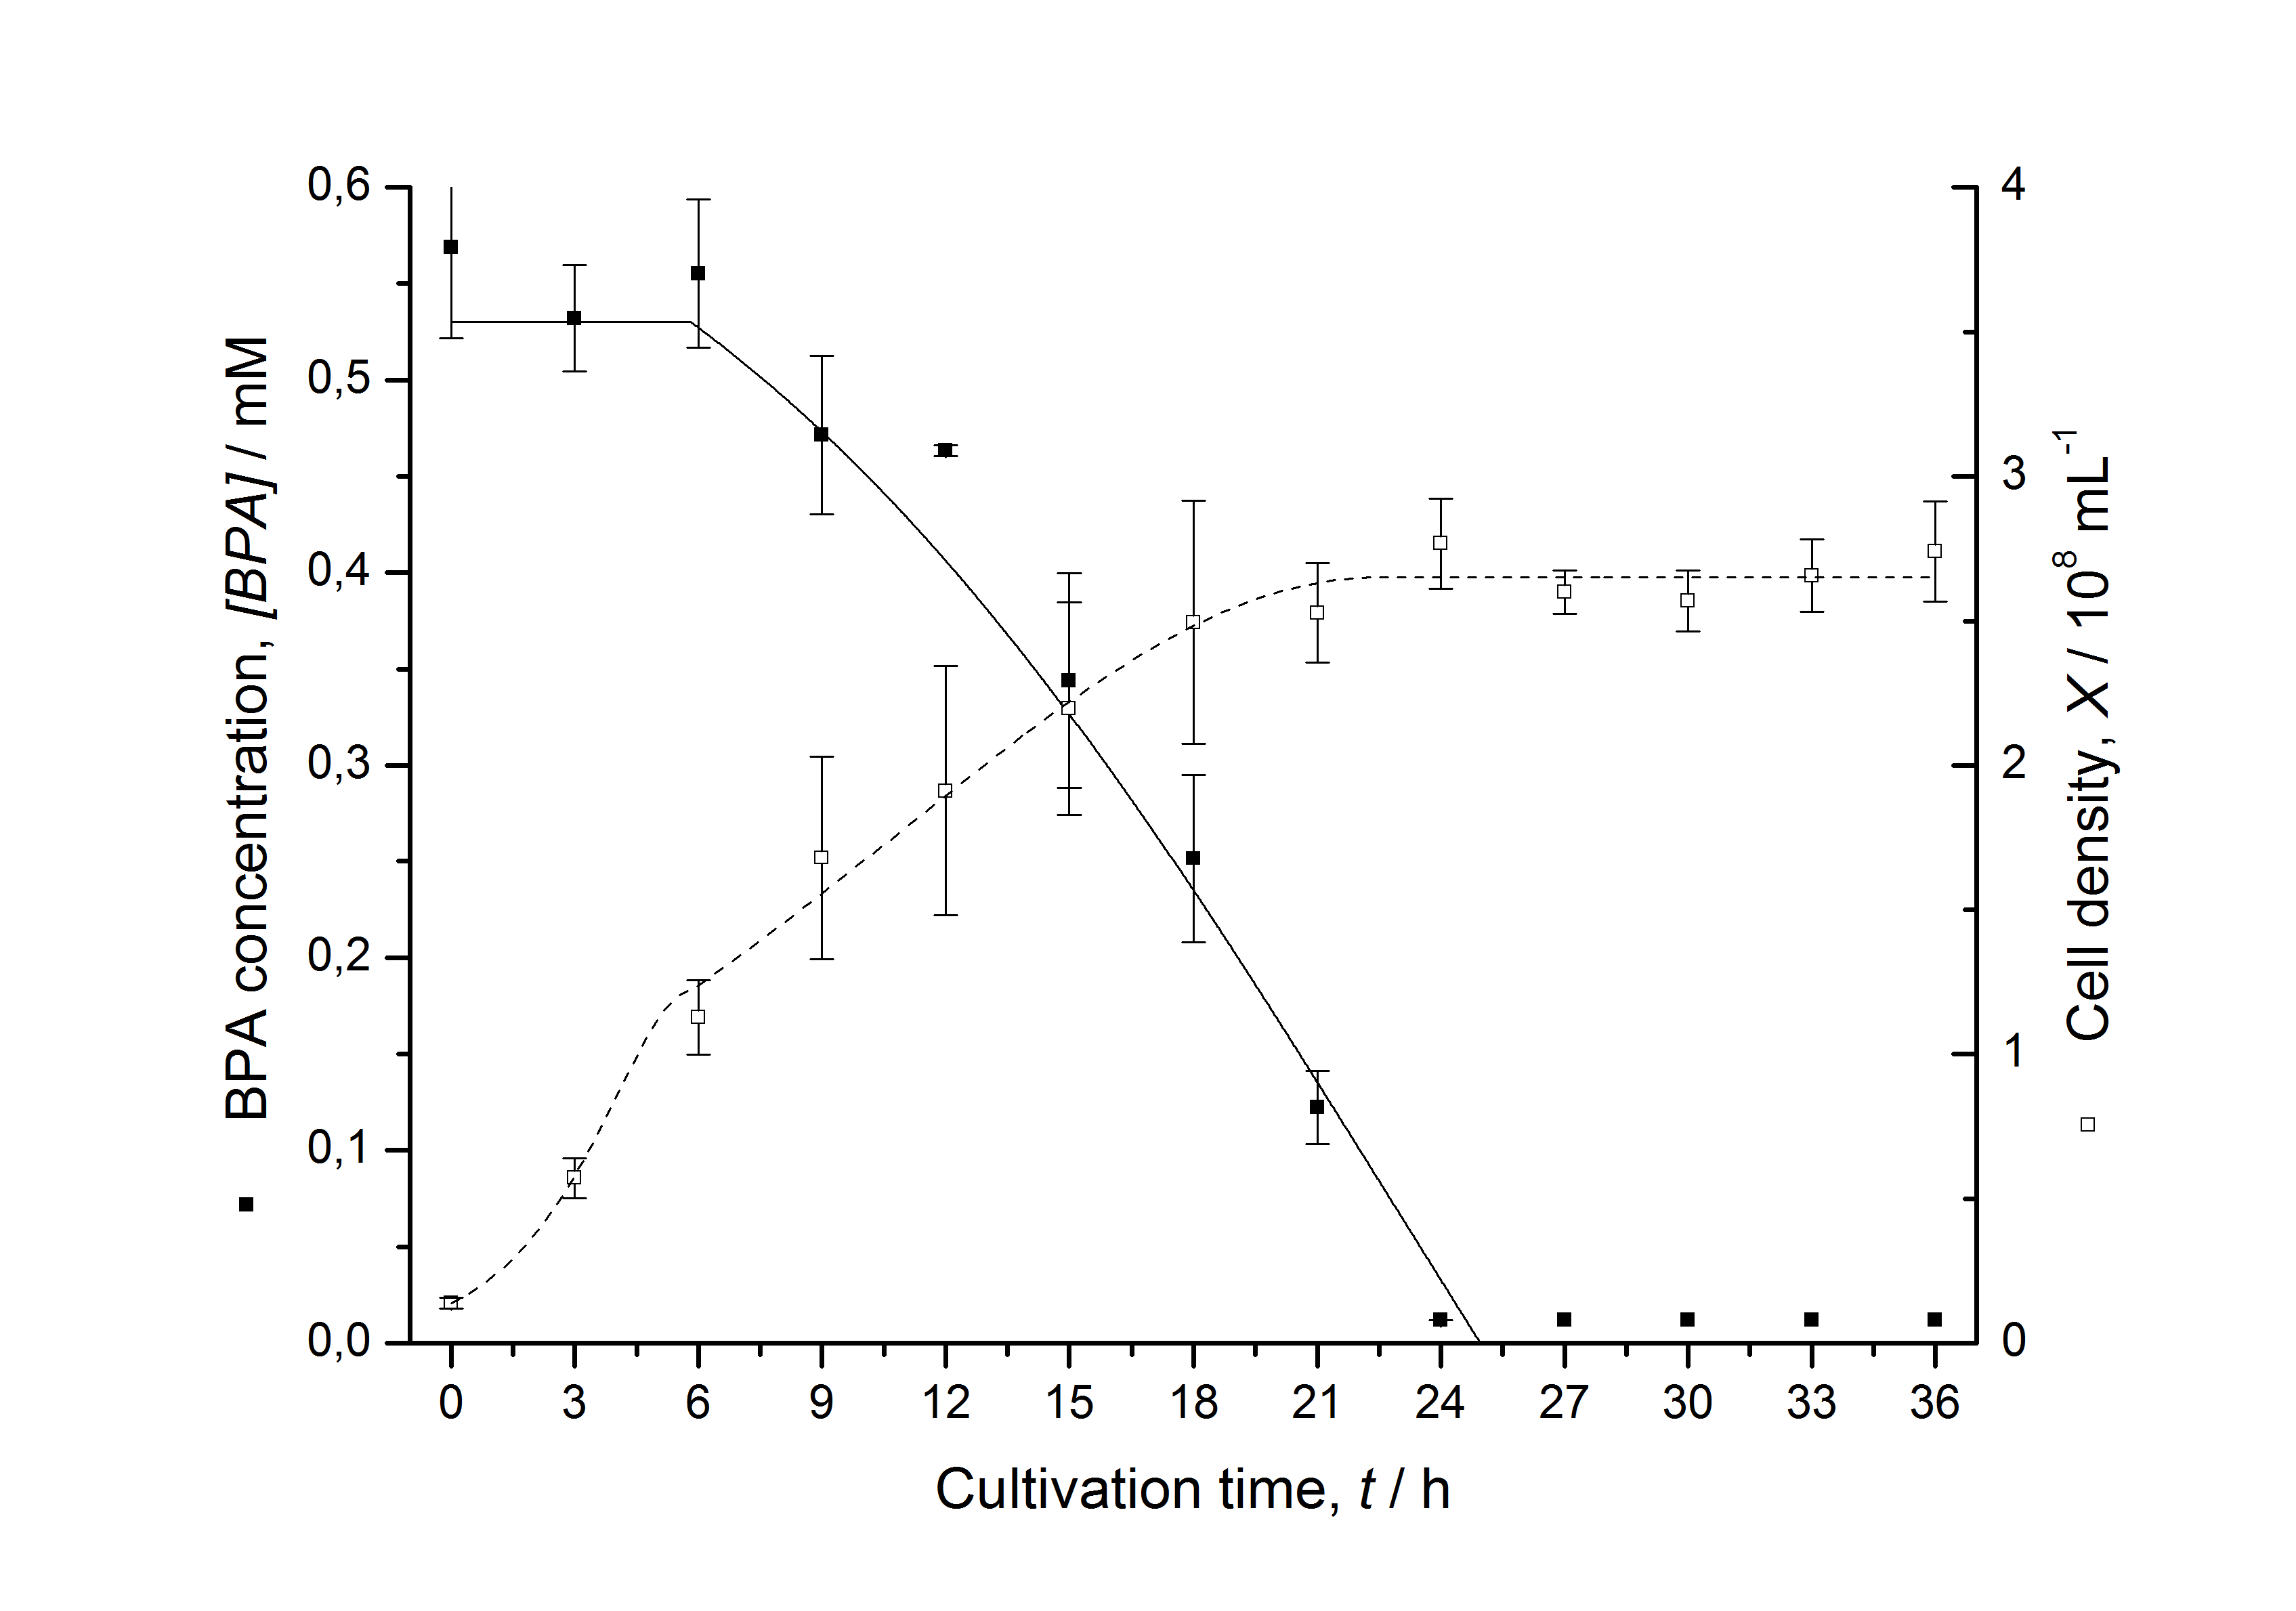
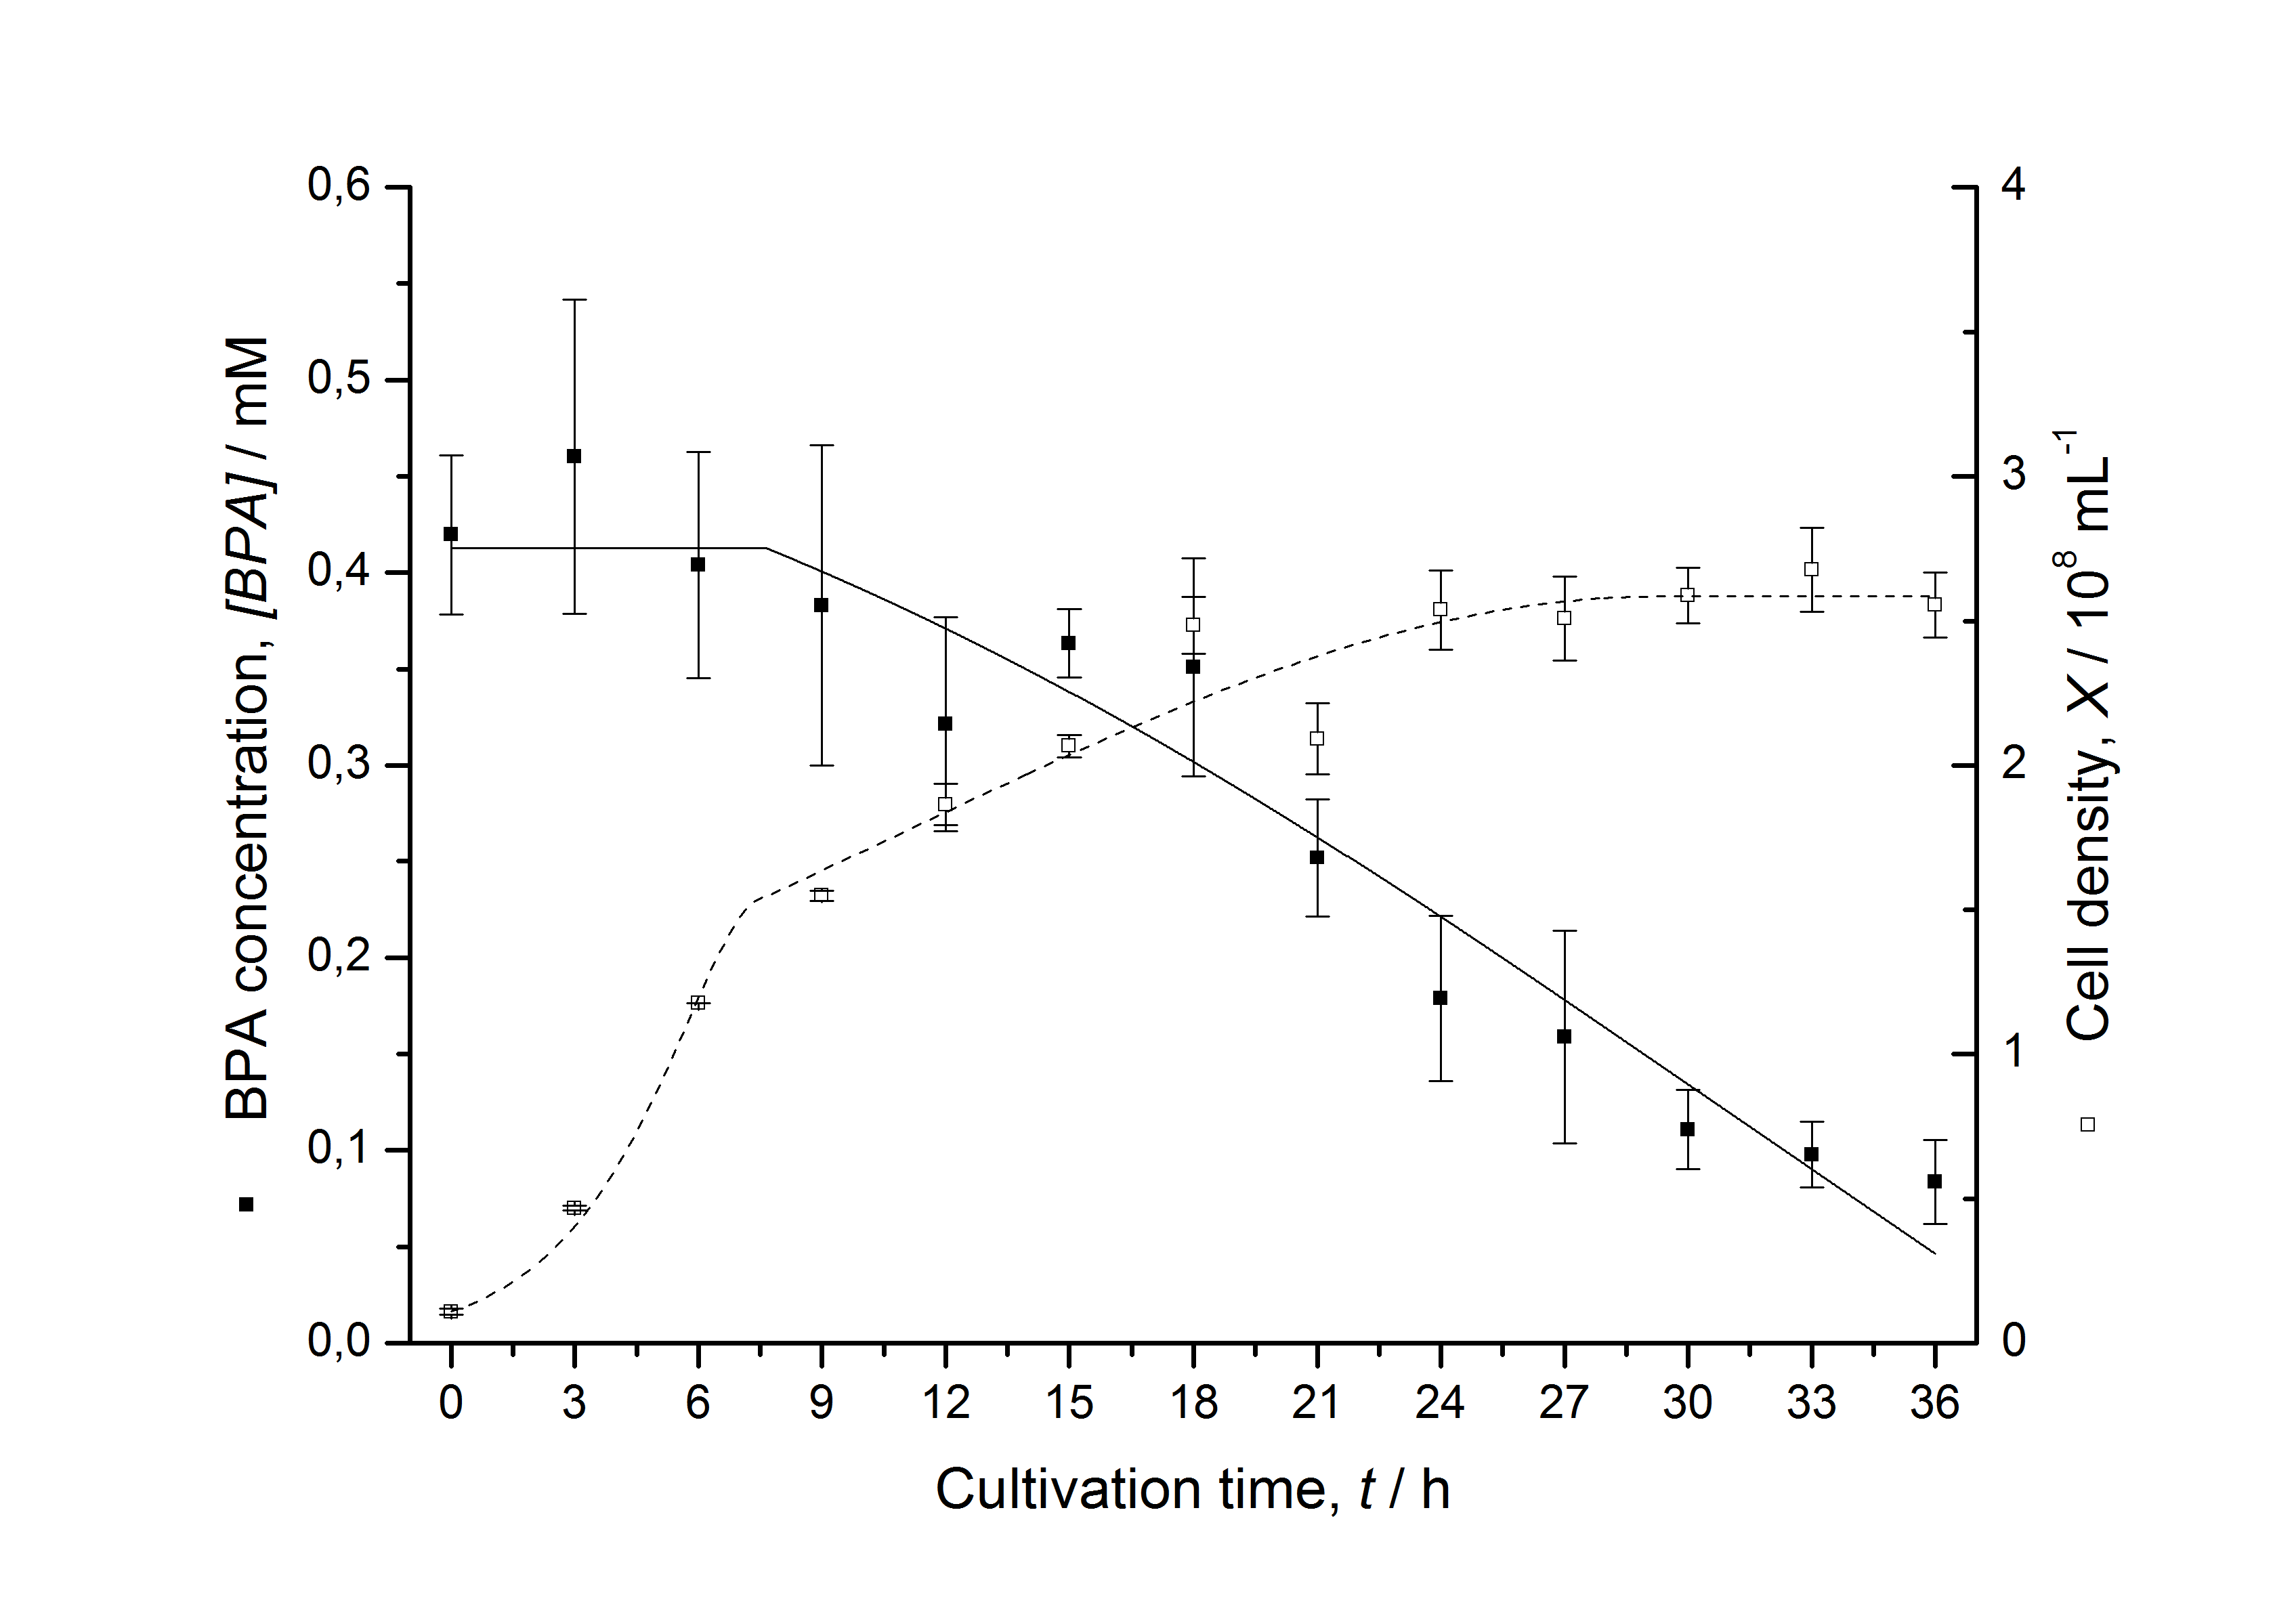
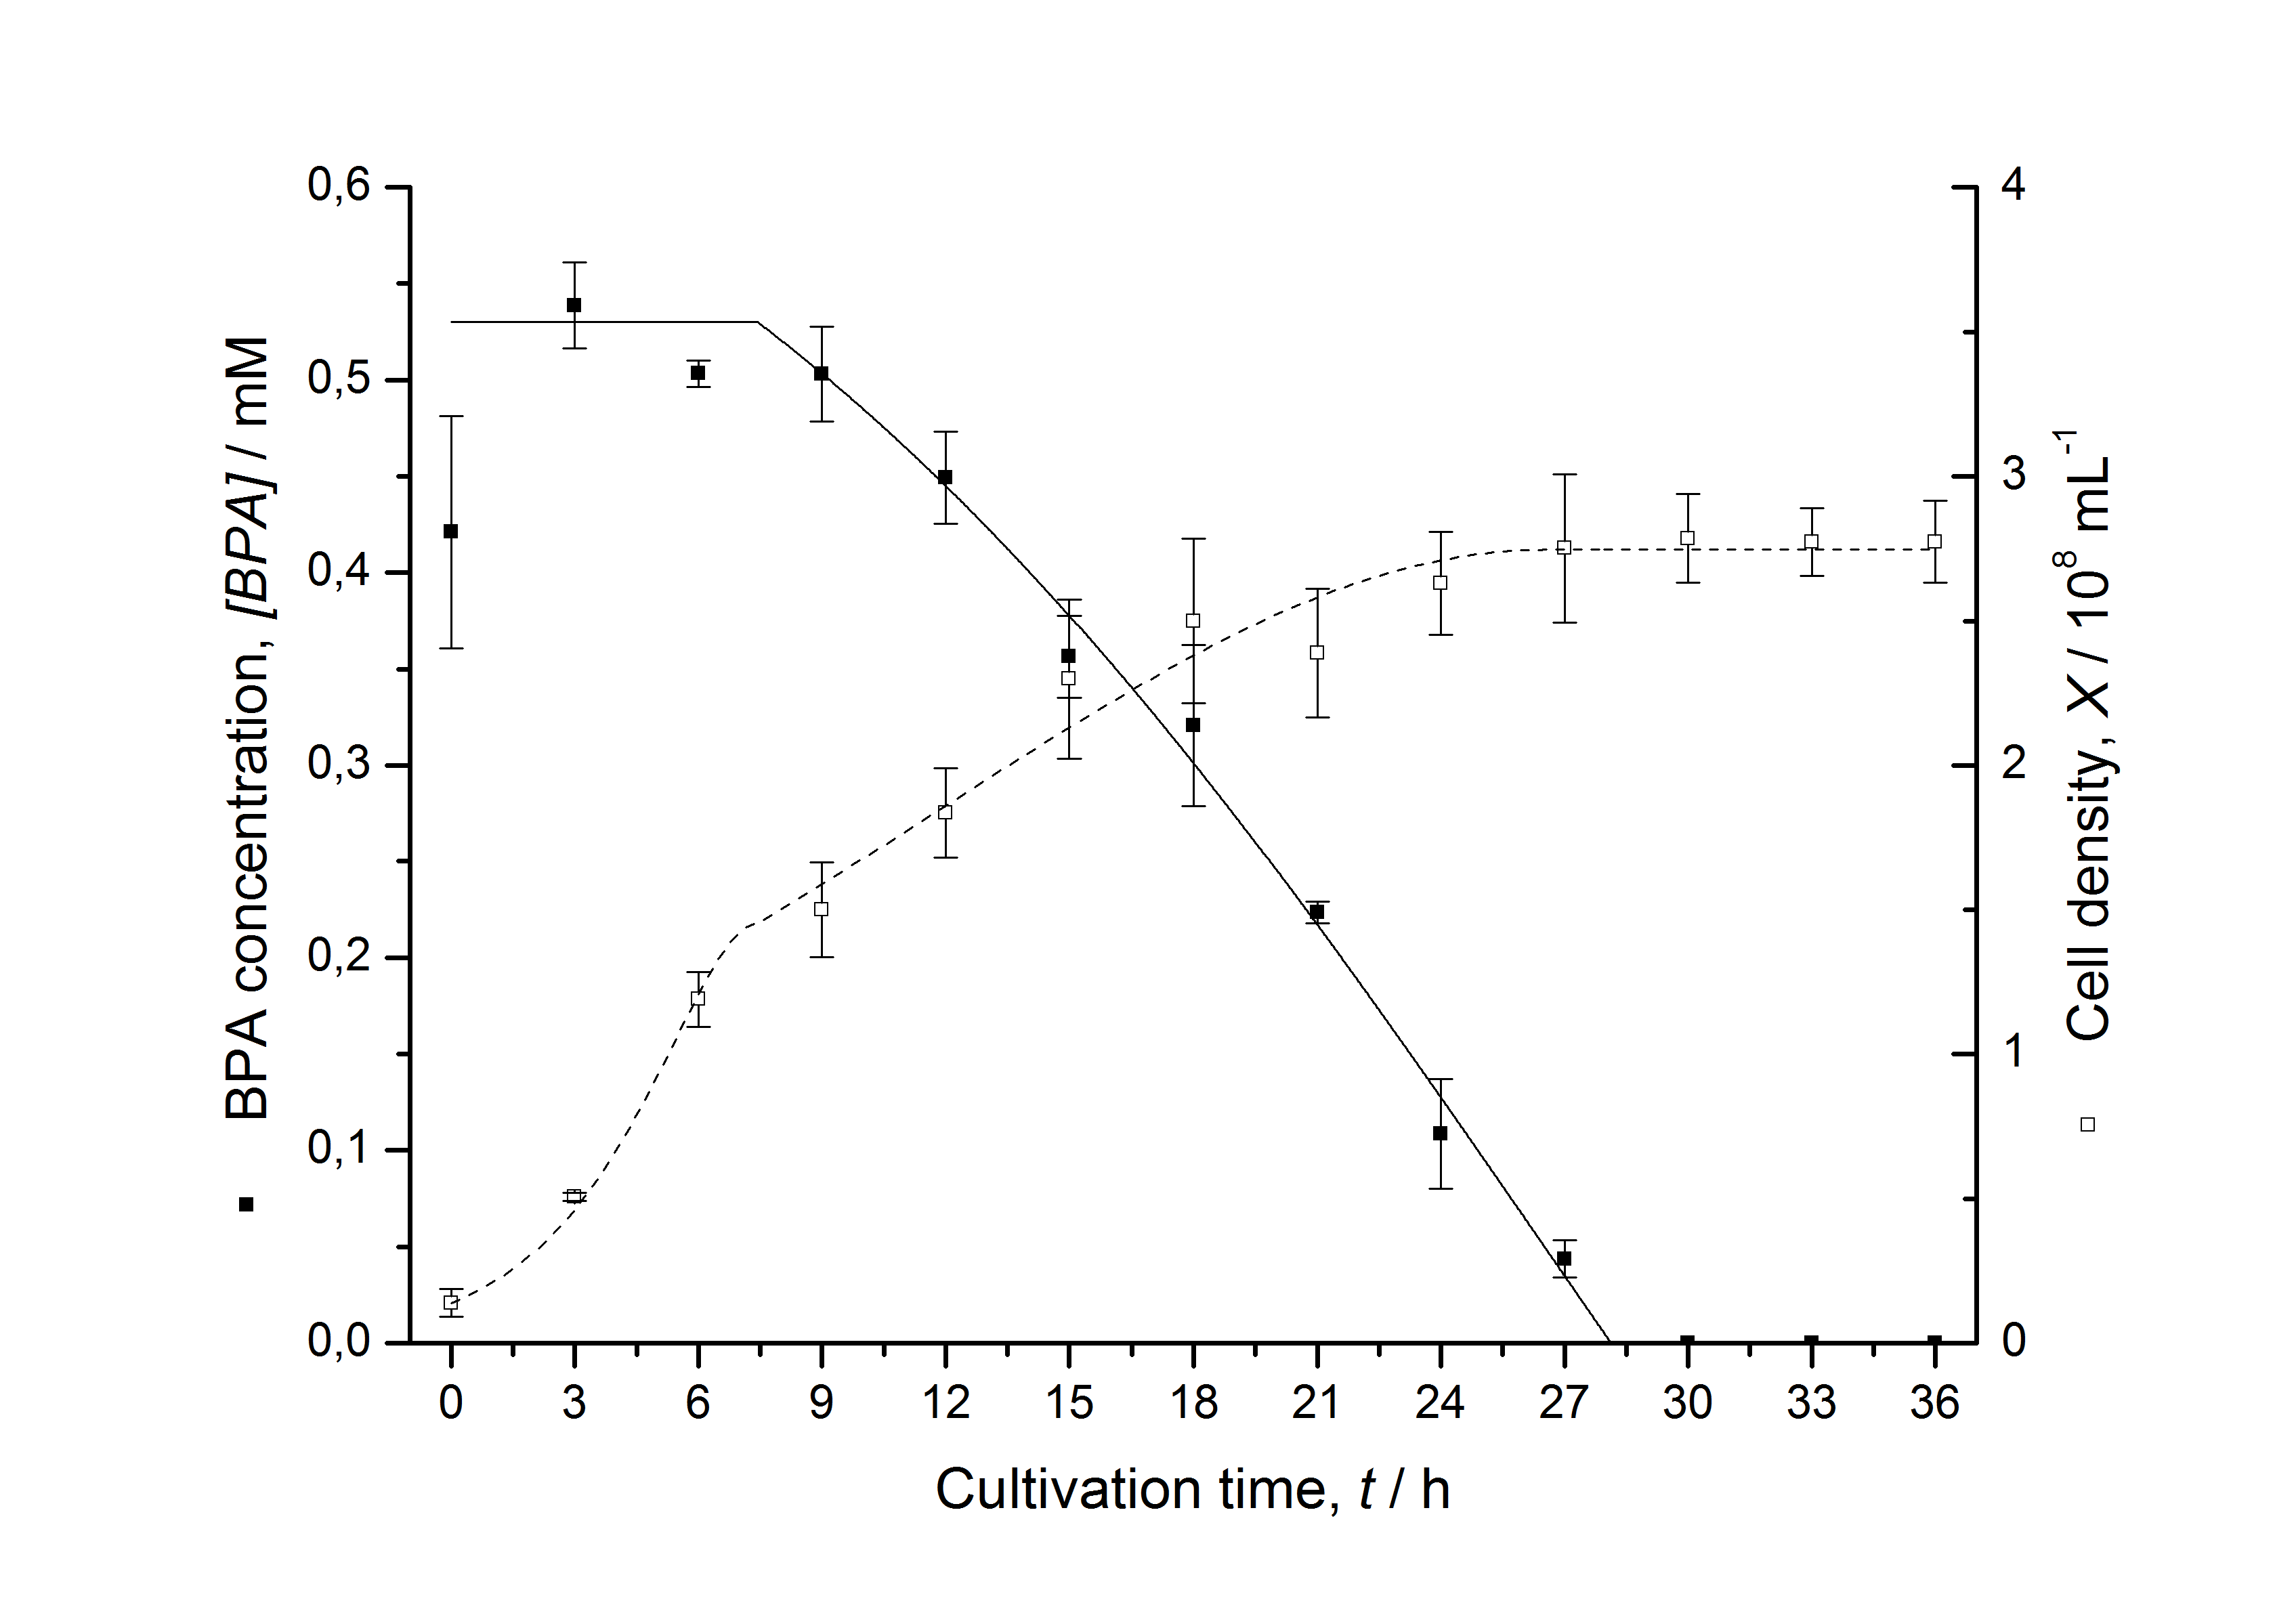
Tab. 1: Parameters of the model.
| Parameter | <partinfo>K525512</partinfo> | <partinfo>K525517</partinfo> | <partinfo>K525552</partinfo> | <partinfo>K525562</partinfo> | <partinfo>K525582</partinfo> |
|---|---|---|---|---|---|
| X0 | 0.112 108 mL-1 | 0.138 108 mL-1 | 0.109 108 mL-1 | 0.115 108 mL-1 | 0.139 108 mL-1 |
| µmax | 1.253 h-1 | 1.357 h-1 | 0.963 h-1 | 1.730 h-1 | 0.858 h-1 |
| KS,1 | 2.646 AU-1 | 1.92 AU-1 | 5.35 AU-1 | 13.87 AU-1 | 3.05 AU-1 |
| KS,2 | 265.1 AU-1 | 103.1 AU-1 | 82.6 AU-1 | - | 32.5 AU-1 |
| S1,0 | 1.688 AU | 1.166 AU | 4.679 AU | 3.003 AU | 2.838 AU |
| qS,1 | 0.478 AU 10-8 cell-1 | 0.319 AU 10-8 cell-1 | 0.883 AU 10-8 cell-1 | 0.240 AU 10-8 cell-1 | 0.544 AU 10-8 cell-1 |
| S2,0 | 16.091 AU | 6.574 AU | 3.873 AU | - | 2.402 AU |
| qS,2 | 0.295 AU 10-8 cell-1 | 0.191 AU 10-8 cell-1 | 0.082 AU 10-8 cell-1 | - | 0.056 AU 10-8 cell-1 |
| BPA0 | 0.53 mM | 0.53 mM | 0.41 mM | 0.45 mM | 0.53 mM |
| qD | 8.76 10-11 mM cell-1 | 1.29 10-10 mM cell-1 | 5.67 10-11 mM cell-1 | - | 1.13 10-10 mM cell-1 |
| qD,max | - | - | - | 1.32 10-10 mM cell-1 | - |
| KD | - | - | - | 0.121 mM-1 | - |
The specific BPA degradation rate per cell qD is about 50 % higher when using the fusion protein compared to the polycistronic bisdAB gene. This results in an average 9 hours faster, complete BPA degradation by E. coli carrying <partinfo>K525517</partinfo> compared to <partinfo>K525512</partinfo> as observed during our cultivations. The fusion protein between BisdA and BisdB improves the BPA degradation by E. coli. Introducing a polycistronic ferredoxin-NADP+ reductase gene into these systems does not lead to a higher specific BPA degradation rate. The rates are a bit lower, though. The effect that the BisdA | BisdB fusion protein is more efficient than BisdB when expressed polycistronically with BisdA can still be observed in this setup. The cultivations with the expression of the fusion protein FNR | BisdA | BisdB differ from the expression of the other BPA degrading BioBricks. The BPA degradation rate is concentration dependent which is typical for enzymatic reactions but was not observed in the other cultivations. In addition, the growth was faster and not diauxic. The maximal specific BPA degradation rate of this BioBrick is higher than the observed specific BPA degradation rates in the other cultivations. But due to the dependence of the BPA degradation from the BPA concentration the BPA degradation with this BioBrick is not as efficient and not complete. Anyway, the fact that this BioBrick is working is impressive.
References
Sasaki M, Akahira A, Oshiman K, Tsuchido T, Matsumura Y (2005b) Purification of Cytochrome P450 and Ferredoxin, Involved in Bisphenol A Degradation, from Sphingomonas sp. Strain AO1, [http://aem.asm.org/cgi/content/abstract/71/12/8024 Appl Environ Microbiol 71(12):8024-8030].
Georlette D, Jonsson Z, Van Petegem F, Chessa J-P, Van Beeumen J, Huebscher U, Gerday C (2000) A DNA ligase from psychrophile Pseudoalteromonas haloplanktis gives insigth into the adaption of proteins to low temperatures, [http://onlinelibrary.wiley.com/doi/10.1046/j.1432-1327.2000.01377.x/pdf Eur.J.Biochem 267:3502-3512].
Chen X, Hentz N, Hubbard F, Meier T, Sittampalam S, Zhao G (2002) Development of a fluorescence resonance energy transfer assay for measuring the activity of Streptococcus pneumoniae DNA ligase, an enzyme essential for DNA replication, repair and recombination, [http://www.sciencedirect.com/science/article/pii/S0003269702003020 Anal Biochem 309:232-240].
Monod J (1949) The growth of bacterial cultures, Annu Rev Microbiol [http://www.annualreviews.org/doi/abs/10.1146/annurev.mi.03.100149.002103 3:371-394].
 "
"


