Team:ETH Zurich/Process/Validation
From 2011.igem.org
(→Analysis) |
|||
| Line 30: | Line 30: | ||
We quantified the fluorescence signal using a moving average of 80×80 pixel, which moved along the symmetry axis of the tube (see Figure 3). | We quantified the fluorescence signal using a moving average of 80×80 pixel, which moved along the symmetry axis of the tube (see Figure 3). | ||
| - | The fluorescence distribution of | + | The fluorescence distribution of this experiment has a similar shape as the distributions predicted by the model (see [[Team:ETH_Zurich/Modeling/Microfluidics#Simulation|modeling section]]). The difference in the experimental results compared to the simulations can be explained mainly due to the different diffusing molecule. The simulations where obtained for acetaldehyde, whereas the experiments were carried out with IPTG. We expect the different values of the diffusion as well as degradation constants of the two molecules two be the main reason for the differences in the experimentally obtained curve as compared to the theoretically obtained. |
[[File:Quantification.png|800px|center|thumb|'''Figure 3: Quantification of the gradient''' in Figure 2: The light intensity of the IPTG-induced GFP signal was quantified by a 80×80 pixel moving average. The peak at around 1.2cm is due to an air bubble in the channel (see Figure 2).]] | [[File:Quantification.png|800px|center|thumb|'''Figure 3: Quantification of the gradient''' in Figure 2: The light intensity of the IPTG-induced GFP signal was quantified by a 80×80 pixel moving average. The peak at around 1.2cm is due to an air bubble in the channel (see Figure 2).]] | ||
|} | |} | ||
Revision as of 21:29, 21 September 2011
| Systems Validation |
| |||
| This page presents a biological experiment which showed that the setup of the flow channel works as predicted by the models (compare plots in the modeling section). | ||||
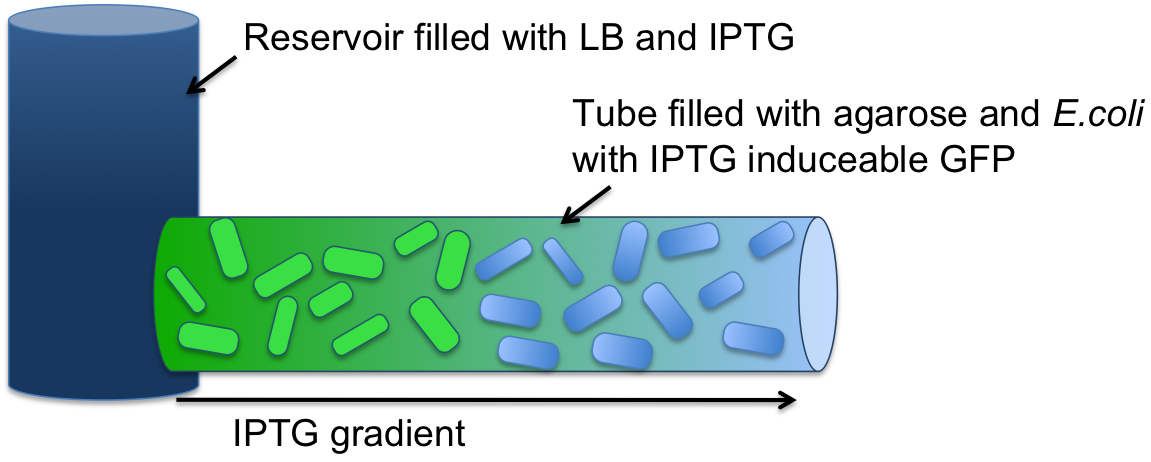
Experimental SetupTo validate that we can create a gradient of a small molecule along our agarose filled tube, we filled a tube (2 mm diameter, 7 cm long) with agarose and E. coli (see Figure 1). The E. coli cells were engineered to express an IPTG-inducible GFP. The cells were incubated at 37 °C overnight. One end of the tube was connected to a sample medium (1 ml) containing 10 mM IPTG solution. |
AnalysisWe quantified the fluorescence signal using a moving average of 80×80 pixel, which moved along the symmetry axis of the tube (see Figure 3). The fluorescence distribution of this experiment has a similar shape as the distributions predicted by the model (see modeling section). The difference in the experimental results compared to the simulations can be explained mainly due to the different diffusing molecule. The simulations where obtained for acetaldehyde, whereas the experiments were carried out with IPTG. We expect the different values of the diffusion as well as degradation constants of the two molecules two be the main reason for the differences in the experimentally obtained curve as compared to the theoretically obtained.
|
 "
"


