Team:ETH Zurich/Process/Validation
From 2011.igem.org
(Difference between revisions)
| Line 5: | Line 5: | ||
{|class="processTitle linkMap" align="right" | {|class="processTitle linkMap" align="right" | ||
|- | |- | ||
| - | |style="border-left: none;"|[[# | + | |style="border-left: none;"|[[#Experimental Setup|Experimental Setup]] |
| - | |[[# | + | |[[#Results |Results ]] [[#Analysis |Analysis]] |
|} | |} | ||
|- | |- | ||
| - | |colspan="2"|''' | + | |colspan="2"|'''This page presents a biological experiment which showed that the setup of the flow channel works as predicted by the models.''' |
|} | |} | ||
{|class="roundContainer" | {|class="roundContainer" | ||
Revision as of 21:20, 21 September 2011
| Systems Validation |
| ||
| This page presents a biological experiment which showed that the setup of the flow channel works as predicted by the models. | |||
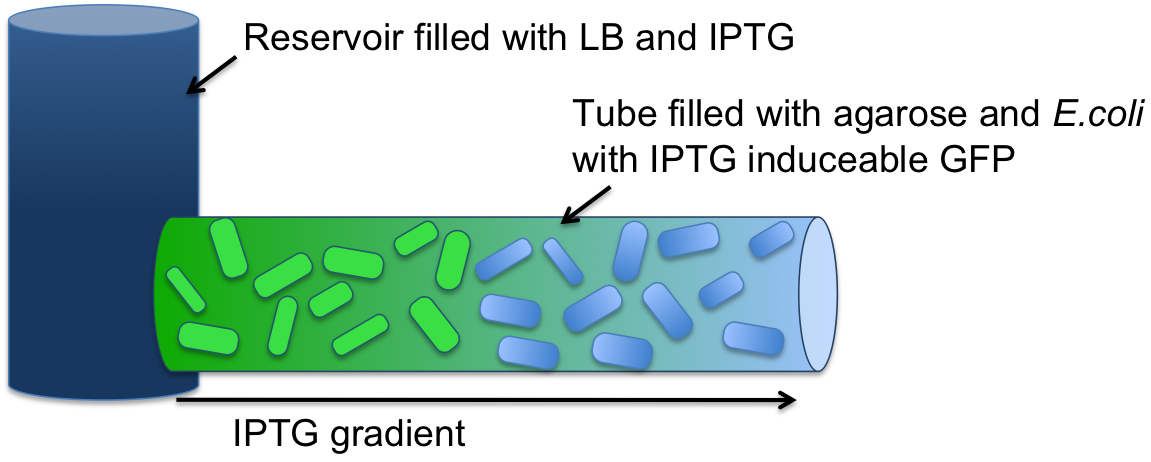
Experimental SetupTo validate that we can create a gradient of a small molecule along our agarose filled tube, we filled a tube (2 mm diameter, 7 cm long) with agarose and E. coli (see Figure 1). The E. coli cells were engineered to express an IPTG-inducible GFP. The cells were incubated at 37 °C overnight. One end of the tube was connected to a sample medium (1 ml) containing 10 mM IPTG solution. |
AnalysisWe quantified the fluorescence signal using a moving average of 80×80 pixel, which moved along the symmetry axis of the tube (see Figure 3). |
 "
"


