Team:ETH Zurich/Modeling/SingleCell
From 2011.igem.org
(→Band Detector) |
(→Band Detector) |
||
| Line 82: | Line 82: | ||
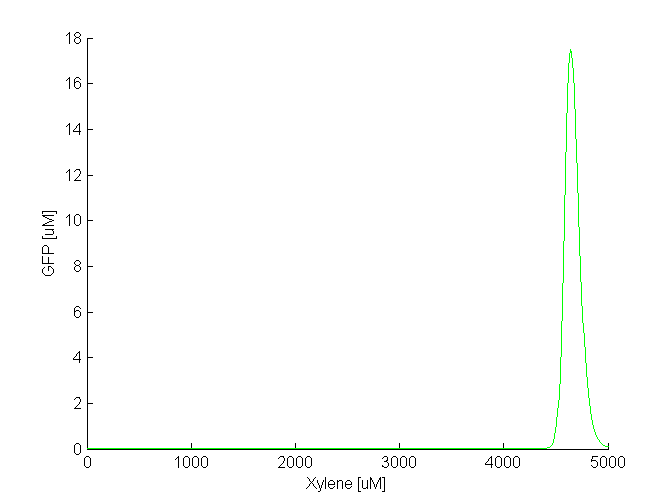
[[File:Band_xylene1.png|thumb|560px|center|'''Figure 2''':GFP vs. increasing xylene input (both in uM). The band appears when the xylene concentration is in the range of 4500-5000 uM]] | [[File:Band_xylene1.png|thumb|560px|center|'''Figure 2''':GFP vs. increasing xylene input (both in uM). The band appears when the xylene concentration is in the range of 4500-5000 uM]] | ||
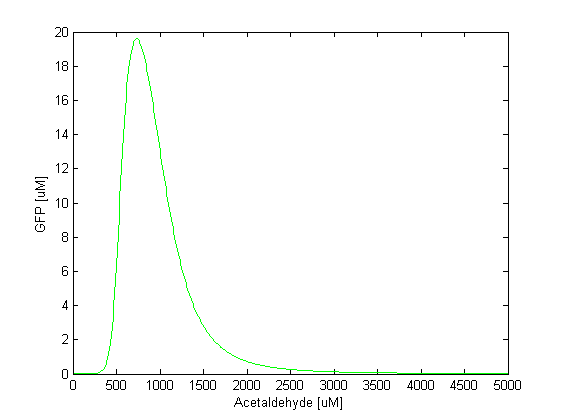
| - | By comparing the two plots, we notice that the GFP band appears at different concentrations of the toxic substances, i.e. we need a 5 times higher concentration of xylene to achieve the same effect as in the case of acetaldehyde. Another difference is the width of the band, which is two times larger for acetaldehyde compared to xylene. | + | By comparing the two plots, we notice that the GFP band appears at different concentrations of the toxic substances, i.e. we need a 5 times higher concentration of xylene to achieve the same effect as in the case of acetaldehyde. Another difference is the width of the band, which is two times larger for acetaldehyde compared to xylene. The amplitude of the GFP peak has the same order of magnitude for both substances, although it is slightly lower for xylene. |
Revision as of 20:55, 21 September 2011
| Single-Cell Model |
| ||||
| The model of our system consists of three connected modules: the sensor, the band detector and the filter. The sensor detects toxic substances from cigarette smoke (acetaldehyde or xylene). The band detector produces green fluorescent protein upon a detection of a certain range (band) of toxic substance concentration. After the toxic substance concentration crosses a certain threshold, the filter turns the system red (red fluorescent protein is expressed). | |||||
Overview of the modelAfter the toxic molecule found in the cigarette smoke (acetaldehyde or xylene) binds to the sensor (AlcR and XylR respectively), the sensor triggers CI and LacI production (directly or indirectly through an inverter). CI inhibits LacI which inhibits GFP. This part of the circuit makes up the band detector. Acetaldehyde and the unbound Xylene are considered as constant inputs to our systems. By simulating with varying toxic input molecule concentrations we can see at which concentration is the band , i.e. at which concentrations GFP is produced. The connection to the filter is established via the LuxI inbition by CI. LuxI in turn produces AHL, which is described in our model as two states (internal AHL and external AHL). AHL diffuses in and out of the cell and after binding of AHL internal to LuxR, the complex R is created. In the model the LuxR concentration is taken as a parameter since it does not vary with time. Finally, RFP is inhibited by the complex R. We created two models which differ only in the sensor module. One of them senses acetaldehyde, the other xylene. The sensing mechanisms are slightly different. The model which uses acetaldehyde as an input has 9 states and 36 parameters, including LuxR. Basal expression is not considered for any of the states and linear degradation is considered for all of them. The model which uses unbound xylene as an input (Xyl_ini) has 11 states (including bound xylene, inactive and active form of the sensor XylR) and 35 parameters, including the unbound xylene and LuxR. Basal expression is considered for the inactive XylR sensor. |
SensorsThe sensor module of our system detects toxic substance found in cigarette smoke. Upon binding of the substance to the sensor molecule, series of downstream gene regulation events take place. We are dealing with two toxic substances (acetaldehyde and xylene). These two are detected by different sensor molecules with different mechanisms of action. Therefore, we designed two models, one for acetaldehyde detection, other for xylene detection. The models differ only by their sensor module, the band detector and the filter modules are same for both. Acetaldehyde SensorAs the name says, this sensor detects acetaldehyde from the air. Acetaldehyde binds to the transcriptional repressor AlcR, inhibiting TetR, which further inhibits CI and LacI production. Thus, the acetaldehyde binding to AlcR leads to CI and LacI expression (double inhibition leads to activation). There has been experimental evidence about the AlcR repression activity when it binds to acetaldehyde []. However, the exact mechanism of acetaldehyde binding to AlcR is not known. In Fusseneger et al. the acetaldehyde-inducible gene expression was assessed by measuring the expression of acetaldehyde adjustable SEAP for different acetaldehyde concentrations. We fitted the experimental data points for SEAP expression to the Hill equation and used the parameter values that were obtained from the fit to describe the repression kinetics of TetR. The ODE for TetR is the following:
Xylene SensorThe sensor that detects xylene is XylR. It is a hexamer which gets activated upon binding of xylene. Active XylR triggers CI and LacI expression. We model both active and inactive Xylene (Xyli and Xyla). Xylene is found in two forms in our system: bound to XylR and free xylene. We consider the free xylene as a state (Xyl) and the initial xylene concentration as an input parameter (Xyl_ini). Thus, the bound xylene concentration can be found by substracting the free xylene concentration from the initial one (Xyl_ini - Xyl). The ODEs for active and inactive XylR, as well as for xylene are given below: |
Band DetectorThe band detector is an amplitude band-pass filter that gives a GFP output when the toxic input substance is in a certain concentration range. The filter is a feed-forward system with 2 branches, interconnected by a NOR gate. After the toxic substance is detected by the sensor module, the system splits into a slow branch and a fast branch. The fast branch is the amplitude low-pass filter. This means that it will repress the production of GFP when the toxic substance concentration goes above the high threshold. In other words, GFP is produced only at low toxic substance concentrations. High concentrations of toxic substance trigger LacIm1 expression, GFP production being thus inhibited. The slow branch is the amplitude high-pass filter which represses GFP when the toxic substance concentration falls below the low threshold or in other words GFP is produced only at high levels of toxic substance. By combining these 2 filters, GFP is produced when neither LacIm1 or LacI represses it, which is the region between the two thresholds. This region is the range of the toxic substance concentration which can trigger the GFP pulse. The ODEs for the species involved in the band detector are given below.
By comparing the two plots, we notice that the GFP band appears at different concentrations of the toxic substances, i.e. we need a 5 times higher concentration of xylene to achieve the same effect as in the case of acetaldehyde. Another difference is the width of the band, which is two times larger for acetaldehyde compared to xylene. The amplitude of the GFP peak has the same order of magnitude for both substances, although it is slightly lower for xylene.
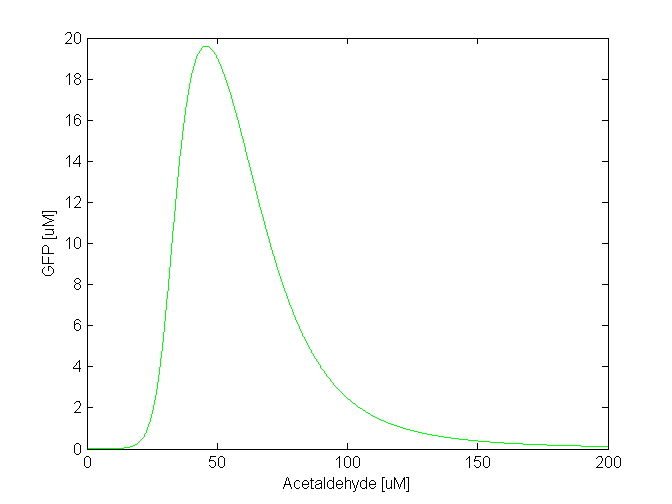
Toxicity and parameter tuning However, the acetaldehyde concentration range where the band is formed might be reasonable in our model, but not in reality. That much concentration of acetaldehyde is toxic for the cells [REFERENCES ABOUT TOXICITY]. They would die long before the acetaldehyde concentration reaches 500 uM. The highest concentration of acetaldehyde the cells can bear is approximately 30-40 uM. Clearly, this tell us that some of our parameter values are wrong. This wouldn't be surprising since for some of the parameters we made assumptions based on related facts. We carefully studied the parameters and the ODEs involved in the band detector module and concluded to make the following changes: - TetR production rate (alphaTetR): From the curve fitting [1], we got the TetR production rate to be 3.93 uM/min and we used that in our simulation. However, the measurements to which we did the fitting were done in mammalian cells, not in "E. coli". Since we express TetR on the same plasmid with other genes, for which we consider production rate to be 1 uM/min, we also changed alphaTetR to 1 uM/min. - TetR repression coefficient (betaTetR): We didn't have any supporting evidence for this, but we assumed it to be 0.01 uM. This was the value used in Basu et al. [1], but there however the repressor is LuxR, not TetR. We increased TetR repression coefficient to 0.1 uM since we get more realistic results with that value. With these 2 changes, the acetaldehyde range concentration where the band appears is at 30-100 uM (see the figure below). The cells that would be to the front of that concentration range will be exposed on higher acetaldehyde concentration which still might be toxic for the cell. However, further fine tuning of the parameters, as well as the fine tuning of the parameters for the xylene model is still in progress, until we obtain a realistic range for the band. |
 "
"


