Team:ETH Zurich/Process/Validation
From 2011.igem.org
(Difference between revisions)
(→System validation for diffusion) |
|||
| Line 15: | Line 15: | ||
== System validation for diffusion== | == System validation for diffusion== | ||
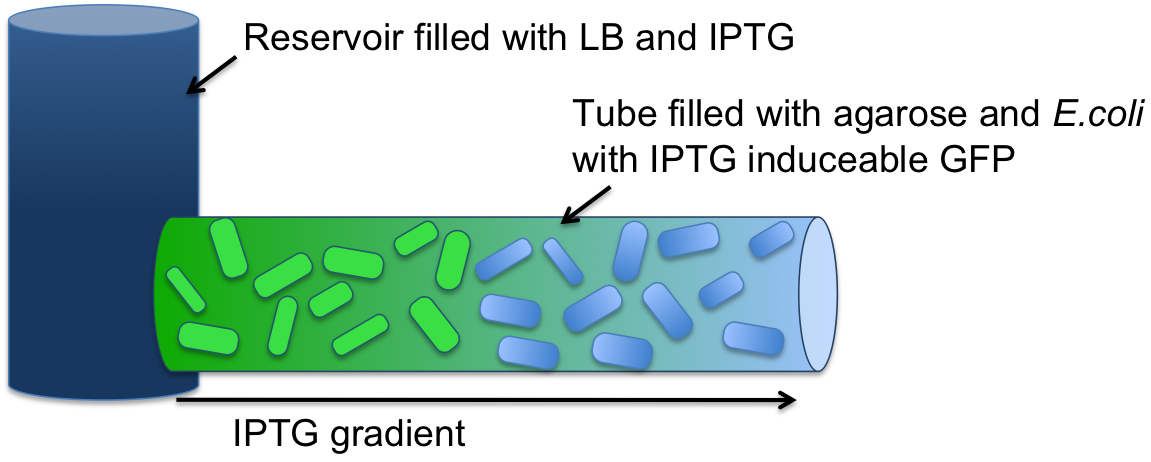
| - | [[File:Setup_test.png|400px|left|thumb|'''Experimental setup for the diffusion test in agarose filled tubes.''' ]] | + | [[File:Setup_test.png|400px|left|thumb|'''Figure 1: Experimental setup for the diffusion test in agarose filled tubes.''' ]] |
To test if we can create a gradient of a small molecule along our agarose filled tube. We filled a tube (2 mm diameter, 7 cm) long with agarose and ''E. coli'' with IPTG-inducible GFP was incubated at 37 °C overnight on end of the tube sticking in 1 ml of 10 mM IPTG solution. | To test if we can create a gradient of a small molecule along our agarose filled tube. We filled a tube (2 mm diameter, 7 cm) long with agarose and ''E. coli'' with IPTG-inducible GFP was incubated at 37 °C overnight on end of the tube sticking in 1 ml of 10 mM IPTG solution. | ||
| - | [[File:ETHZ Gradient.png|800px|center|thumb|'''GFP gradient in tube:''' ''E. coli'' with IPTG-inducable GFP were incubated in a tube (2 mm diameter, 7 cm long). GFP expression was assessed under the fluorescent microscope after overnight incubation, with a excitation wavelength of 480 nm and a emission wavelength of 510 nm. The 15 microscope photos were reassembled into one using [http://research.microsoft.com/en-us/um/redmond/groups/ivm/ICE/ the Microsoft Research Image Composite Editor].]] | + | [[File:ETHZ Gradient.png|800px|center|thumb|'''Figure 2: GFP gradient in tube:''' ''E. coli'' with IPTG-inducable GFP were incubated in a tube (2 mm diameter, 7 cm long). GFP expression was assessed under the fluorescent microscope after overnight incubation, with a excitation wavelength of 480 nm and a emission wavelength of 510 nm. The 15 microscope photos were reassembled into one using [http://research.microsoft.com/en-us/um/redmond/groups/ivm/ICE/ the Microsoft Research Image Composite Editor].]] |
| - | [[File:Quantification.png|800px|center|thumb|'''Quantification of gradient:''' | + | [[File:Quantification.png|800px|center|thumb|'''Figure 3: Quantification of gradient:''' Quantification of the gradient in Figure 2: The light intensity of the IPTG-induced GFP signal was quantified by a moving 80✗80 moving average. The peak at around 1.2 is due to an air bubble in the channel (see Figure 2).]] |
Revision as of 18:58, 21 September 2011
| Systems Validation |
| ||
| Text goes here | |||
 "
"


