Team:Bielefeld-Germany/Project/Background/Technology
From 2011.igem.org
(→HPLC) |
(→FACS) |
||
| (2 intermediate revisions not shown) | |||
| Line 109: | Line 109: | ||
[[File:Bielefeld-Germany2011-MALDI-TOF.png|200px|thumb|right|Our MALDI-TOF device]] | [[File:Bielefeld-Germany2011-MALDI-TOF.png|200px|thumb|right|Our MALDI-TOF device]] | ||
| - | Before | + | Before measurement, the analyte is co-crystallized on a metal plate within a solid matrix. 3,5-dimethoxy-4-hydroxycinnamic acid (sinapinic acid) and 2,5-dihydroxybenzoic acid (DHB) are most commonly used. |
| - | Desorption of the analyte is taken by a laser beam, commonly with a wavelength of 337 nm. The matrix absorbs the laser light and the upper layer explosively vaporizes, ejecting both, matrix and analyte molecules. In addition to this vaporization, the laser beam also leads to an ionization of the analytes. The mass analysis is performed by the TOF ( | + | Desorption of the analyte is taken by a laser beam, commonly with a wavelength of 337 nm. The matrix absorbs the laser light and the upper layer explosively vaporizes, ejecting both, matrix and analyte molecules. In addition to this vaporization, the laser beam also leads to an ionization of the analytes. The mass analysis is performed by the TOF (time of flight)-analysator. The evaporated ions are accelerated in an electric field. Typical acceleration voltages for this are 10-30 kV. The velocity of an ion depends on its mass and the charge. An ion detector converts the incoming ions into an electrical signal. The advantage of this method is the rapid analysis of a relatively large mass range. |
The MALDI-TOF analysis was performed with the [http://www.bdal.com/products/maldi/ultraflextreme-series/overview.html ultrafleXtreme<html>™</html>] by Bruker Daltonics. | The MALDI-TOF analysis was performed with the [http://www.bdal.com/products/maldi/ultraflextreme-series/overview.html ultrafleXtreme<html>™</html>] by Bruker Daltonics. | ||
| Line 130: | Line 130: | ||
[[File:Bielefeld-Germany-2011-Tecan.png|200px|thumb|right|One of our fluorescence assay devices]] | [[File:Bielefeld-Germany-2011-Tecan.png|200px|thumb|right|One of our fluorescence assay devices]] | ||
| - | The fluorescence assay takes advantage of | + | The fluorescence assay takes advantage of the property of certain molecules to emit light of one specific wavelength while absorbing light of a different wavelength. This feature is also found in several proteins, like GFP or RFP, so these molecules can be used as reporter proteins to detect other proteins with a fluorescence assay by crating fusion proteins. |
| - | For the fluorescence assay we had the [http://www.tecan.com/platform/apps/product/index.asp?MenuID=1812&ID=1916&Menu=1&Item=21.2.10.1 Infinite<html>®</html> M200 platereader] by Tecan and the [http://www.gelifesciences.com/aptrix/upp01077.nsf/Content/2d_electrophoresis~scanners~typhoon_9400?OpenDocument&parentid=286927&moduleid=166668 Typhoon<html>™</html> 9400] by GE Healthcare available. | + | For the fluorescence assay, we had the [http://www.tecan.com/platform/apps/product/index.asp?MenuID=1812&ID=1916&Menu=1&Item=21.2.10.1 Infinite<html>®</html> M200 platereader] by Tecan and the [http://www.gelifesciences.com/aptrix/upp01077.nsf/Content/2d_electrophoresis~scanners~typhoon_9400?OpenDocument&parentid=286927&moduleid=166668 Typhoon<html>™</html> 9400] by GE Healthcare available. |
| Line 176: | Line 176: | ||
Flow cytometry describes a measurement method, that allows the analysis of cells which pass an electronic detection apparatus or a light beam at high speed. Depending on the shape, structure or coloration of the cells, different effects are generated, from which the properties of the cell can be derived. | Flow cytometry describes a measurement method, that allows the analysis of cells which pass an electronic detection apparatus or a light beam at high speed. Depending on the shape, structure or coloration of the cells, different effects are generated, from which the properties of the cell can be derived. | ||
| - | In our case, we used the [http://www.bdbiosciences.com/instruments/facscalibur/index.jsp FACSCalibur flow cytometer] by BD Biosciences to analyze the formation of our S- | + | In our case, we used the [http://www.bdbiosciences.com/instruments/facscalibur/index.jsp FACSCalibur flow cytometer] by BD Biosciences to analyze the formation of our S-layers on the surface of the silica beads. |
Latest revision as of 21:48, 28 October 2011


Contents |
PCR
The polymerase chain reaction (PCR) is a method to reproduce DNA in vitro. An enzyme, the polymerase, is used for this purpose. The term "chain reaction" in this context means, that the products of previous cycles are used as template for the next cycle and thus exponential amplification of specific DNA fragments is achieved. The formed DNA product results from defined primers, which are the start point for the polymerase.
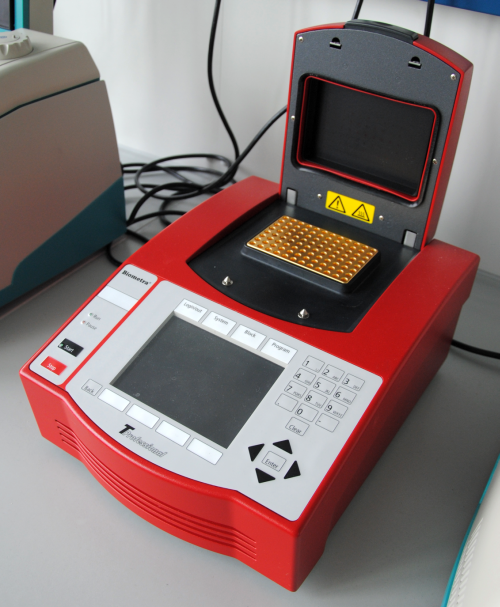
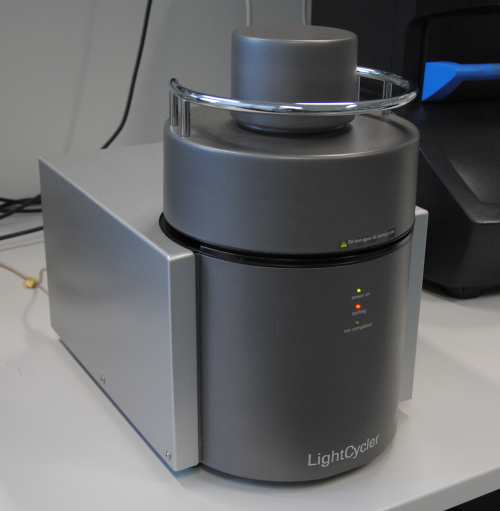
The PCR is used in biological and medical laboratories for a variety of different tasks. In our case we used the PCR for two different applications. It is possible to check successful cloning when using primers that bind at the prefix and suffix regions of the cloning plasmid and separate/analyze the PCR product by agarose gel electrophoresis (Colony PCR). The other application is the amplification and cloning of genomic DNA. We further used our thermocyclers for the qualification of our molecular beacons. A thermal profile was taken by measuring the fluorescence of the molecular beacons as a function of temperature by a real-time PCR device.
For the colony PCR we used the [http://www.biometra.com/thermocycler-silver.0.html TProfessional Thermocycler] by Biometra and the [http://www.analytik-jena.com/en/LifeScience-AnalytikJenaAG/Products-/Instruments/Thermal-cycler__2266/ FlexCycler] by Analytik Jena. The thermal profile assay was performed with the [http://www.roche-applied-science.com/sis/rtpcr/htc/index.jsp LightCycler® 480 System] by Roche.
We used the PCR to characterize the following BioBricks:
<partinfo>K525001</partinfo>;
<partinfo>K525002</partinfo>;
<partinfo>K525005</partinfo>;
<partinfo>K525006</partinfo>;
<partinfo>K525007</partinfo>;
<partinfo>K525008</partinfo>;
<partinfo>K525009</partinfo>;
<partinfo>K525010</partinfo>;
<partinfo>K525121</partinfo>;
<partinfo>K525123</partinfo>;
<partinfo>K525221</partinfo>;
<partinfo>K525222</partinfo>;
<partinfo>K525223</partinfo>;
<partinfo>K525224</partinfo>;
<partinfo>K525234</partinfo>;
<partinfo>K525301</partinfo>;
<partinfo>K525303</partinfo>;
<partinfo>K525304</partinfo>;
<partinfo>K525305</partinfo>;
<partinfo>K525306</partinfo>;
<partinfo>K525311</partinfo>;
<partinfo>K525312</partinfo>;
<partinfo>K525401</partinfo>;
<partinfo>K525403</partinfo>;
<partinfo>K525404</partinfo>;
<partinfo>K525405</partinfo>;
<partinfo>K525406</partinfo>;
<partinfo>K525411</partinfo>;
<partinfo>K525412</partinfo>;
<partinfo>K525499</partinfo>;
<partinfo>K525512</partinfo>;
<partinfo>K525515</partinfo>;
<partinfo>K525517</partinfo>;
<partinfo>K525551</partinfo>;
<partinfo>K525560</partinfo>;
<partinfo>K525562</partinfo>;
<partinfo>K525582</partinfo>;
<partinfo>K525710</partinfo>;
<partinfo>K525720</partinfo>;
<partinfo>K525730</partinfo>;
<partinfo>K525740</partinfo>;
<partinfo>K525998</partinfo>;
<partinfo>K525999</partinfo>
HPLC
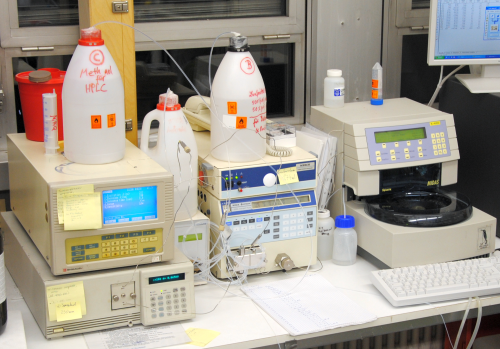
High performance liquid chromatography (HPLC), a sort of liquid chromatography, is an analytical method in chemistry, not only to separate substances, but also to identify and quantify these substances using internal standards.
The examined substance, together with a mobile phase, is pumped through a separation column, the stationary phase. You can classify an HPLC according to the principle of separation in normal phase (NP), reverse phase (RP), ion exchange (IEC), size exclusion (SEC) and chiral chromatography. The substance to be tested is injected into the stream of the mobile phase in small amounts. The movement of the sample through the column depends on the nature of the sample on the one hand and the stationary phase on the other hand. If one component of the tested substance interacts strongly with the stationary phase, it remains on the column relatively long. If the interaction of a substance is weak, its velocity to leave the column is higher. The time at which a specific substance elutes is called retention time and is suitable for identification under particular conditions.
You can find the specifications of our HPLC device here.
We used the HPLC to characterize the following BioBricks:
<partinfo>K525311</partinfo>;
<partinfo>K525512</partinfo>;
<partinfo>K525515</partinfo>;
<partinfo>K525517</partinfo>;
<partinfo>K525551</partinfo>;
<partinfo>K525560</partinfo>;
<partinfo>K525562</partinfo>;
<partinfo>K525582</partinfo>
MS/MS
Tandem mass spectrometry (MS/MS) is an analytical physics technique with multiple mass spectrometry sections combined. Between two analyzers, a collision cell is mounted to apply energy to the ions by colliding them with an inert gas (usually nitrogen or argon). Thereafter the ions disintegrate very specific to other, lighter ions.
LC-MS
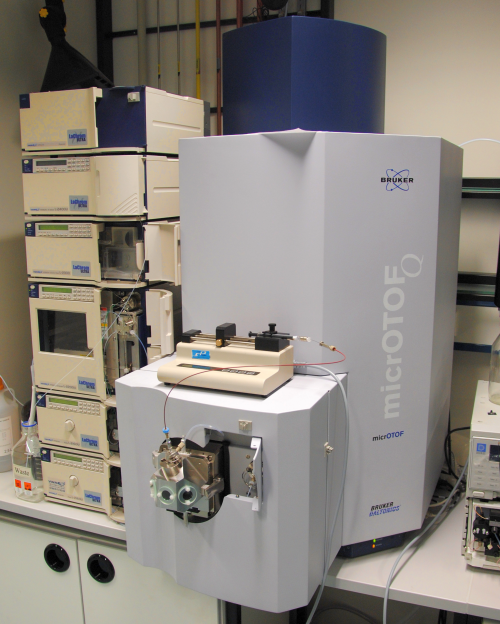
Liquid chromatography–mass spectrometry (LC-MS), a sort of tandem mass spectrometry, is an analytical chemistry technique which combines the physical separation of liquid chromatography (LC or HPLC) with the analysis of the substances by mass spectrometry (MS).
For the LC-ESI-qTOF-MS we had the [http://www.bdal.com/products/lc-ms/o-tof/microtof-q-ii/overview.html micrOTOF-Q II™] by Bruker Daltonics available.
We used an LC-ESI-qTOF-MS to characterize the following BioBricks:
<partinfo>K525512</partinfo>;
<partinfo>K525515</partinfo>;
<partinfo>K525517</partinfo>
MALDI-TOF
Matrix-assisted Laser Desorption/Ionization – Time of flight (MALDI-TOF) is a procedure to analyze large biomolecules by their mass.
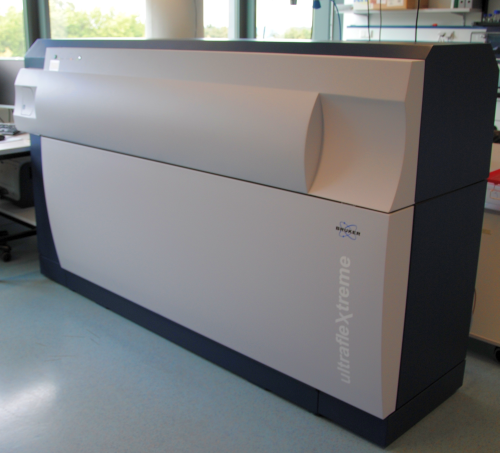
Before measurement, the analyte is co-crystallized on a metal plate within a solid matrix. 3,5-dimethoxy-4-hydroxycinnamic acid (sinapinic acid) and 2,5-dihydroxybenzoic acid (DHB) are most commonly used. Desorption of the analyte is taken by a laser beam, commonly with a wavelength of 337 nm. The matrix absorbs the laser light and the upper layer explosively vaporizes, ejecting both, matrix and analyte molecules. In addition to this vaporization, the laser beam also leads to an ionization of the analytes. The mass analysis is performed by the TOF (time of flight)-analysator. The evaporated ions are accelerated in an electric field. Typical acceleration voltages for this are 10-30 kV. The velocity of an ion depends on its mass and the charge. An ion detector converts the incoming ions into an electrical signal. The advantage of this method is the rapid analysis of a relatively large mass range.
The MALDI-TOF analysis was performed with the [http://www.bdal.com/products/maldi/ultraflextreme-series/overview.html ultrafleXtreme™] by Bruker Daltonics.
We used the MALDI-TOF Analysis to characterize the following BioBricks:
<partinfo>K525121</partinfo>;
<partinfo>K525123</partinfo>;
<partinfo>K525221</partinfo>;
<partinfo>K525222</partinfo>;
<partinfo>K525223</partinfo>;
<partinfo>K525224</partinfo>;
<partinfo>K525710</partinfo>
Fluorescence Assay
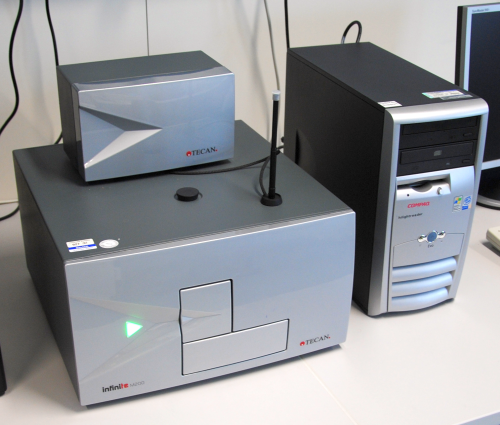
The fluorescence assay takes advantage of the property of certain molecules to emit light of one specific wavelength while absorbing light of a different wavelength. This feature is also found in several proteins, like GFP or RFP, so these molecules can be used as reporter proteins to detect other proteins with a fluorescence assay by crating fusion proteins.
For the fluorescence assay, we had the [http://www.tecan.com/platform/apps/product/index.asp?MenuID=1812&ID=1916&Menu=1&Item=21.2.10.1 Infinite® M200 platereader] by Tecan and the [http://www.gelifesciences.com/aptrix/upp01077.nsf/Content/2d_electrophoresis~scanners~typhoon_9400?OpenDocument&parentid=286927&moduleid=166668 Typhoon™ 9400] by GE Healthcare available.
We used the fluorescence assay to characterize the following BioBricks:
<partinfo>K525121</partinfo>;
<partinfo>K525123</partinfo>;
<partinfo>K525221</partinfo>;
<partinfo>K525222</partinfo>;
<partinfo>K525223</partinfo>;
<partinfo>K525224</partinfo>;
<partinfo>K525304</partinfo>;
<partinfo>K525305</partinfo>;
<partinfo>K525306</partinfo>;
<partinfo>K525404</partinfo>;
<partinfo>K525405</partinfo>;
<partinfo>K525406</partinfo>;
<partinfo>K525710</partinfo>;
<partinfo>K525740</partinfo>;
Luminescence Assay
The luminescence assay uses the ability of specific enzyme reactions to produce light for the measuring of product formation. On the other hand, this assay can also be used to detect enzymes or substrates which are required for these reactions.
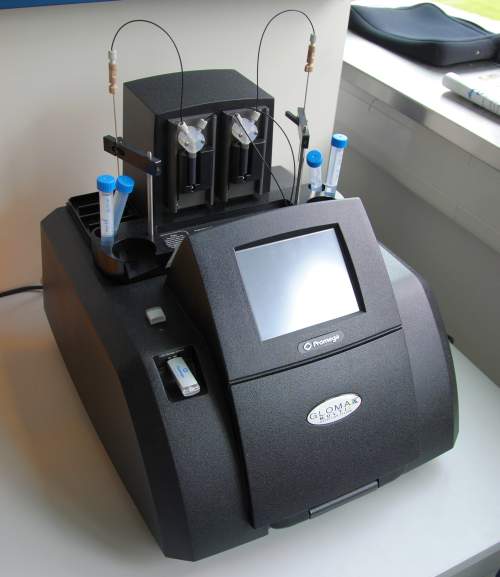
For the luminescence assay we had the [http://www.promega.com/b/de/Glomax/glomax_multi.aspx GloMax®-Multi Detection System] by Promega available.
We used the Luminescence assay tho characterize the following BioBricks:
<partinfo>K525311</partinfo>;
<partinfo>K525411</partinfo>;
<partinfo>K525710</partinfo>;
<partinfo>K525740</partinfo>;
<partinfo>K525999</partinfo>
FACS
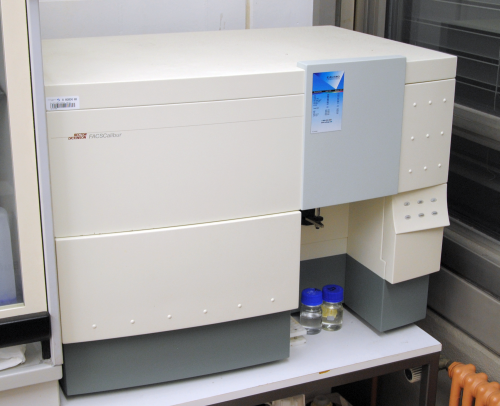
Flow cytometry describes a measurement method, that allows the analysis of cells which pass an electronic detection apparatus or a light beam at high speed. Depending on the shape, structure or coloration of the cells, different effects are generated, from which the properties of the cell can be derived.
In our case, we used the [http://www.bdbiosciences.com/instruments/facscalibur/index.jsp FACSCalibur flow cytometer] by BD Biosciences to analyze the formation of our S-layers on the surface of the silica beads.
We used the flow cytometry analysis to characterize the following BioBricks:
[http://partsregistry.org/wiki/index.php?title=Part:BBa_K525305 BBa_K525305];
Microscopy
AFM
Atomic force microscopy (AFM) is a special type of scanning probe microscopy, with a gained resolution below a nanometer, a thousand times higher than the optical diffraction limit. During the measurement, a nanosized needle, fixed on a leaf spring, is directed across the surface of a probe. The leaf spring is bent in different amplitudes, depending on the surface structure of the sample. This bending or deflection of the spring can be measured with optical sensors and is a result of the atomic forces, occurring between the needle and the surface. By recording the deflections respective forces point by point, an image of the sample surface is generated like a digital photo with each pixel being an illustration of a specific physical or chemical parameter. The possible resolution is determined by the radius of curvature of the spring leaf and ranges from 0.1 to 10 nm. Thus, the atomic force microscope reaches the highest resolution of any microscopic technique.
We used the AFM to characterize the following BioBricks:
[http://partsregistry.org/wiki/index.php?title=Part:BBa_K525301 BBa_K525301];
[http://partsregistry.org/wiki/index.php?title=Part:BBa_K525303 BBa_K525303];
[http://partsregistry.org/wiki/index.php?title=Part:BBa_K525304 BBa_K525304];
[http://partsregistry.org/wiki/index.php?title=Part:BBa_K525305 BBa_K525305];
[http://partsregistry.org/wiki/index.php?title=Part:BBa_K525306 BBa_K525306];
[http://partsregistry.org/wiki/index.php?title=Part:BBa_K525311 BBa_K525311]
CLSM
Confocal laser scanning microscopy (CLSM) is a type of confocal microscopy, whereas, in contrast to the normal conventional light microscopy, not the entire sample is illuminated, but only a fraction, in most cases only a limited spot. The intensities of light reflected or emitted are measured consecutively at all locations of the sample, so that a subsequent construction of the image is possible.
The CLSM was performed with the [http://www.zeiss.de/c12567be00459794/Contents-Frame/377f01c62dc109cec12574e10035d20a LSM 700] by Zeiss.
We used the CLSM to characterize the following BioBricks:
[http://partsregistry.org/wiki/index.php?title=Part:BBa_K525301 BBa_K525301];
[http://partsregistry.org/wiki/index.php?title=Part:BBa_K525303 Baa_K525303];
[http://partsregistry.org/wiki/index.php?title=Part:BBa_K525304 BBa_K525304];
[http://partsregistry.org/wiki/index.php?title=Part:BBa_K525305 BBa_K525305];
[http://partsregistry.org/wiki/index.php?title=Part:BBa_K525306 BBa_K525306];
[http://partsregistry.org/wiki/index.php?title=Part:BBa_K525311 BBa_K525311]
SEM
Scanning electron microscopy (SEM) is a type of electron microscopy, where a beam of high-energy electrons is directed across the surface of a sample to be imaged in a raster scan pattern. The interactions between the electrons and the surface of the object can be measured and are used to generate an image of the sample. The maximum theoretical magnification factor is approximately about 1,000,000:1.
The SEM was performed with the [http://www.zeiss.de/c1256e4600305472/Contents-Frame/84e6e310b4773cb3c1256e54003a31fe EVO® MA] by Zeiss.
We used the SEM to characterize the following BioBricks:
[http://partsregistry.org/wiki/index.php?title=Part:BBa_K525301 BBa_K525301];
[http://partsregistry.org/wiki/index.php?title=Part:BBa_K525303 Baa_K525303];
[http://partsregistry.org/wiki/index.php?title=Part:BBa_K525304 BBa_K525304];
[http://partsregistry.org/wiki/index.php?title=Part:BBa_K525305 BBa_K525305];
[http://partsregistry.org/wiki/index.php?title=Part:BBa_K525306 BBa_K525306];
[http://partsregistry.org/wiki/index.php?title=Part:BBa_K525311 BBa_K525311]
References
H. Engelhardt (ed.): Practice of High Performance Liquid Chromatography - Applications, Equipment and Quantitative Analysis. Springer-Verlag, Berlin/Heidelberg/New York/Tokyo 1986, ISBN 3-540-12589-2.
M. H. Gey: Instrumentelle Analytik und Bioanalytik, 2. Aufl., Springer Verlag, Berlin 2008.
C. Hamann, M. Hietschold: Raster-Tunnel-Mikroskopie. Akademie Verlag, Berlin 1991, ISBN 3-05-501272-0.
Handbook of biological Confocal Microscopy, 3rd ed., Springer-Verlag, New York 2006, ISBN 978-0-387-25921-5
J. R. Lakowicz: Principles of fluorescence spectroscopy. Springer 2006, ISBN 9780387312781.
C. Mülhardt: Der Experimentator: Molekularbiologie / Genomics. 6. Aufl., Spektrum Akademischer Verlag, 2008, ISBN 978-3-8274-2036-7.
M. G. Ormerod (ed.): Flow Cytometry — A practical approach. 3rd edition, Oxford University Press, Oxford (UK.) 2000, ISBN 0199638241
J. Peter-Katalinic (ed.), F. Hillenkamp: MALDI MS: A Practical Guide to Instrumentation, Methods and Applications. Wiley-VCH, Weinheim 2007, ISBN 3-527-31440-7.
O. Shimomura: Bioluminescence: Chemical Principles and Methods. Word Scientific Publishing Company 2006, ISBN 981-256-801-8.
D. Skoog, J. Leary: Instrumentelle Analytik. Grundlagen, Geräte, Anwendung. Berlin 1996. (ger. translation of the 4th edition of Principles of Instrumental Analysis, Orlando 1992).
 "
"

