Team:ETH Zurich/Biology/Validation
From 2011.igem.org
(→Experimental results) |
(→AraC - the arabinose sensor) |
||
| (98 intermediate revisions not shown) | |||
| Line 3: | Line 3: | ||
{{:Team:ETH Zurich/Templates/SectionStart}} | {{:Team:ETH Zurich/Templates/SectionStart}} | ||
= Experimental results = | = Experimental results = | ||
| - | '''For the 3 subparts of SmoColi we designed additional test systems to test the functionality of the single parts. Alike all new or improved biobricks were tested and characterized before they were implemented in the subparts.''' For the sensors we tested the repressors or activators in the presence of the corresponding small molecule. For the P<sub>u</sub> promoter we show [[Team:ETH_Zurich/Biology/Validation#Results_of_BBa_K625003_characterization | + | '''For the 3 subparts of SmoColi we designed additional test systems to test the functionality of the single parts. Alike all new or improved biobricks were tested and characterized before they were implemented in the subparts.''' For the sensors we tested the repressors or activators in the presence of the corresponding small molecule. For the P<sub>u</sub> promoter we show a[[Team:ETH_Zurich/Biology/Validation#Results_of_BBa_K625003_characterization| dose response for xylene]] over air. In the case of arabinose, by knocking out the transporter, we could also change the ON-/OFF character of AraC to a [[#AraC_-_the_arabinose_sensor|dose response for arabinose]]. The fungal AlcR sensor however seems not to work as an network element in ''E.coli''. |
| - | + | ||
{{:Team:ETH Zurich/Templates/SectionEnd}} | {{:Team:ETH Zurich/Templates/SectionEnd}} | ||
| Line 21: | Line 20: | ||
= XylR - the xylene sensor = | = XylR - the xylene sensor = | ||
| - | |||
| - | |||
| - | + | [[File:ETHZ Pu.png|300px|left|thumb|'''Figure 1: P<sub>u</sub> promoter''']] | |
| - | We inoculated 50 mL of LB medium with an overnight culture of the co-transformed strains and set the OD<sub>600</sub> to 0.1. Upon reaching the exponential growth phase, the cultures were induced with m-xylene. Therefore we put a sterile test tube with m-xylene | + | E. coli strain JM101 was transformed with two plasmids containing the transcriptional regulator XylR, the degradation cassette ''xylMABN'' and a GFP reporter coupled to [http://partsregistry.org/Part:BBa_K625002 BBa_K625002] respectively [http://partsregistry.org/Part:BBa_K625003 BBa_K625003]. [http://partsregistry.org/Part:BBa_K625002 BBa_K625002] is an improved version of the P<sub>u</sub> promoter [http://partsregistry.org/Part:BBa_I723138 BBa_I723138] were we inserted a stop codon to prevent fusion proteins. [http://partsregistry.org/Part:BBa_K625003 BBa_K625003] is a minimal version of the P<sub>u</sub> promoter, where the partial XylU sequence is deleted. The regulator and degradation pathway was provided by Sven Panke on the plasmid pCK04AxylR according to [[#Ref5|[5]]]. The reporter plasmid was constructed by using [http://partsregistry.org/Part:BBa_K625005 BBa_K625005] as a backbone. |
| + | |||
| + | We inoculated 50 mL of LB medium with an overnight culture of the co-transformed strains and set the OD<sub>600</sub> to 0.1. Upon reaching the exponential growth phase, the cultures were induced with m-xylene. Therefore we put a sterile test tube with m-xylene into the flask and tightly sealed it with parafilm in order to get an '''air-induced response''' (see Figure 4 below). This way of inducing was chosen due to the very high volatility of Xylene, when dissolved in water, which makes it impossible to set its concentration in an open system. | ||
OD<sub>600</sub> and GFP fluorescence was measured after different time periods in a 96-well plate. Afterwards the data was normalized in order to get more consistent results. | OD<sub>600</sub> and GFP fluorescence was measured after different time periods in a 96-well plate. Afterwards the data was normalized in order to get more consistent results. | ||
| Line 34: | Line 33: | ||
==Comparison of the two promoter versions== | ==Comparison of the two promoter versions== | ||
| - | [[File:ETHZ Pu promoter test.png|300px|right|thumb|'''Figure | + | [[File:ETHZ Pu promoter test.png|300px|right|thumb|'''Figure 2: Characterization of BBa_K625002 and BBa_K625003''' ''m''-xylene was added by air-induction.]] |
| - | After 3 h we could observe a clear increase in GFP fluorescence when ''m''-xylene was added in a test tube. Thus GFP production can be induced by ''m''-xylene present from the air. The results of the experiments can be seen in Figure 8. By comparing [http://partsregistry.org/Part:BBa_K625002 BBa_K625002] and [http://partsregistry.org/Part:BBa_K625003 BBa_K625003], we can see | + | After 3 h we could observe a clear increase in GFP fluorescence when ''m''-xylene was added in a test tube. Thus GFP production can be induced by ''m''-xylene present from the air. The results of the experiments can be seen in Figure 8. By comparing [http://partsregistry.org/Part:BBa_K625002 BBa_K625002] and [http://partsregistry.org/Part:BBa_K625003 BBa_K625003], we can see higher expression rates for the shortened promoter [http://partsregistry.org/Part:BBa_K625003 BBa_K625003] compared to the longer one, both in induced and noninduced state. The increase of promoter strength is thought to be some unknown mechanism of the deleted part of the promoter like mRNA secondary structure formation or a change of mRNA degradation rate. |
| - | Nevertheless, we could also see a higher level of induction in the setup with [http://partsregistry.org/Part:BBa_K625003 BBa_K625003] (around 7-fold) compared to the [http://partsregistry.org/Part:BBa_K625002 BBa_K625002] setup (around 5-fold). Thus both of the provided promoters can be used for transcriptional regulation with XylR. | + | Nevertheless, we could also see a higher level of induction in the setup with [http://partsregistry.org/Part:BBa_K625003 BBa_K625003] (around 7-fold) compared to the [http://partsregistry.org/Part:BBa_K625002 BBa_K625002] setup (around 5-fold). Thus both of the provided promoters can be used for transcriptional regulation with XylR with different strength. |
<br clear="all" /> | <br clear="all" /> | ||
| - | == | + | ==[http://partsregistry.org/Part:BBa_K625003 BBa_K625003] characterization== |
| - | [[File:IMG 6655.JPG| | + | [[File:IMG 6655.JPG|250px|right|thumb|'''Figure 4: Erlenmeyer flask with xylene induced GFP.''']] |
| + | |||
| + | [[File:Eth Time course of xylene induction.png|250px|left|thumb|'''Figure 3: Timecourse of GFP expression from [http://partsregistry.org/Part:BBa_K625003 BBa_K625003]''' ]] | ||
| + | |||
| + | The short version of the P<sub>U</sub> promoter was characterized in more detail. These experiments were performed in M9 medium containing 0.5 % glucose, in the hope of less leaky transcription through more defined medium. The extent of xylene induction was modulated by performing the induction over air not only with pure xylene, but also with mixtures of xylene and paraffin oil, which gives lower xylene concentration within the medium due to a lower partial pressure. Therefore a 50 ml shaking flask culture of JM101 containing the sensor plasmid PcK04AxylR and a medium copy plasmid with a sfGFP reporter under [http://partsregistry.org/Part:BBa_K625003 BBa_K625003] control was induced in exponential phase with different dilutions of xylene in paraffin oil. The specific fluorescence was measured in a platereader and dose-responsiveness could be shown for all timepoints (Figure 3), with the overnight one having the lowest detection limit. | ||
| + | |||
| + | |||
| + | |||
| + | These promising results made us [[Team:ETH_Zurich/xylene| calculate]] the xylene distribution in our thermodynamically closed system, to get a proper dose response for XylR. (The induction with 25 % xylene in paraffin oil in excess would for example correspond to a concentration in the medium of 775 μM, which means a responsiveness in the micromolar range, which is expected) | ||
| + | |||
| + | |||
| + | In another experiment (some shaking flasks containing the test tubes for induction shown in Figure 4), the dose response curve for the same cells was collected in the same way after overnight growth (Figure 5). Xylene was already detected in the lower micromolar range. For the highest induction rates in the low millimolar range, a certain toxicity was already observed, as can be seen by a decreased OD<sub>600</sub> (Figure 6). The promoter was found to be rather strong, as it showed expression rates of about a quarter of a [http://partsregistry.org/Part:BBa_K180000 Tac] promoter induced with 100μM IPTG (positive control) and its leakyness was found to be negligible (negative control). (see Figure 7) | ||
| + | |||
| - | |||
| - | |||
<gallery widths=260px heights=260px perrow=3> | <gallery widths=260px heights=260px perrow=3> | ||
| - | File:ETH Columns for xylene.png|'''Figure 5: Characterization of BBa_K625003''' different concentration of m-xylene were added by air-induction | + | File:ETH Columns for xylene.png|'''Figure 5: Characterization of BBa_K625003''' different concentration of m-xylene were added by air-induction. sfGFP expression could be induced by lower micromolar concentrations of xylene. |
| - | File:Influence on cell growth.png|'''Figure 6: Influence of xylene on the cell growth of E.coli.''' | + | File:Influence on cell growth.png|'''Figure 6: Influence of xylene on the cell growth of E.coli.''' Xylene shows toxic effects on ''E.coli'' in the lower millimolar range. |
| - | File:ETH Induction level comparison.png|'''Figure 7: Positive and negative control in comparison to induced and non induced GFP expression by | + | File:ETH Induction level comparison.png|'''Figure 7: Positive and negative control ''' in comparison to fully xylene-induced (+) and non induced (-) GFP expression by [http://partsregistry.org/Part:BBa_K625003 BBa_K625003]. (Positive control being fully induced Lac promoter, negative promoter the same strain without GFP) |
</gallery> | </gallery> | ||
| + | |||
| + | ===Dose response curve=== | ||
| + | |||
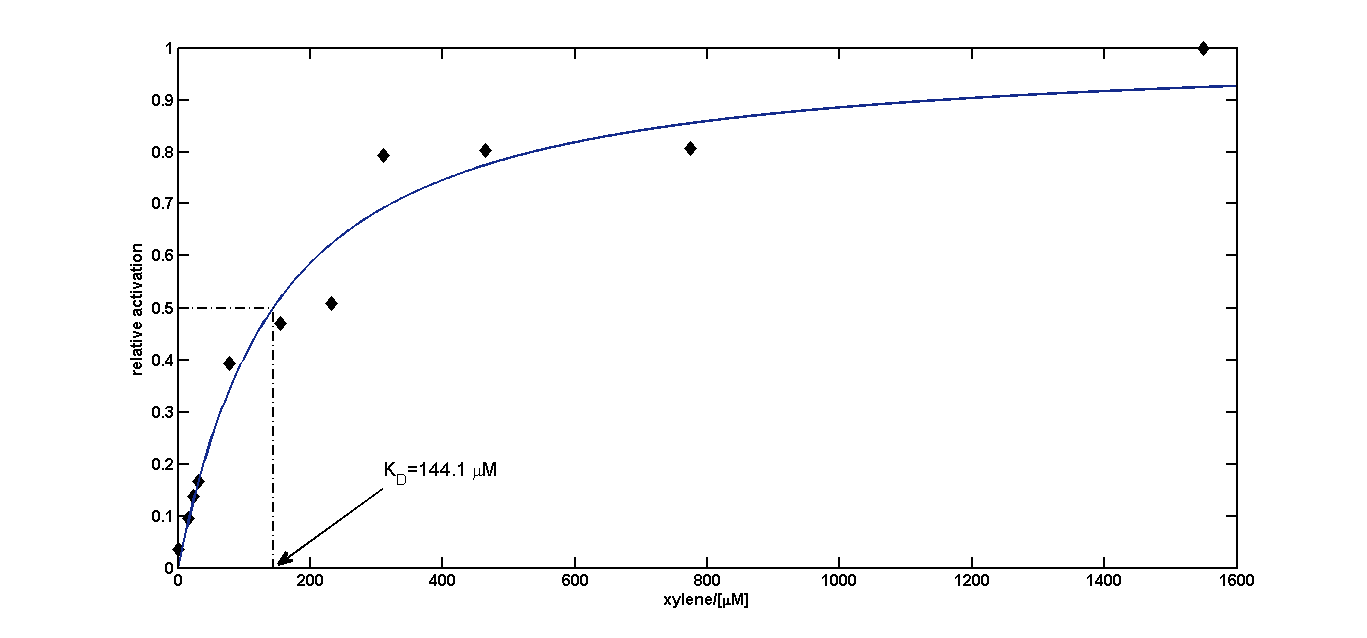
| + | We fitted the activation data in dependency of the xylene concentration to a Hill function. Since for a xylene concentration of 3100 μM the measured OD<sub>600</sub> value was significantly reduced compared to the other xylene concentrations, this data point was removed from the analysis (this concentration can be considered to be toxic for the cells). For a xylene concentration of 1550 μM the fluorescence signal was considered to have reached steady state (see Figure 5). Thus, we defined the relative activation for a given xylene concentration as the ratio between a given fluorescence signal and the fluorescence signal for a xylene concentration of 1550 μM (see Figure 8). | ||
| + | |||
| + | To this data (see Figure 8) we fitted the Hill function | ||
| + | |||
| + | [[File:ETHZ-Xylene-Activation.png|center|239px]] | ||
| + | <br clear="all"> | ||
| + | with K<sub>D</sub> the dissociation constant and n the Hill coefficient. We obtained optimal values of | ||
| + | |||
| + | K<sub>D</sub>=144.1 μM≈144 μM; | ||
| + | |||
| + | n=1.055≈1 | ||
| + | |||
| + | Since the Hill coefficient is close to 1, we can assume non-cooperative activation of XylR. This data was subsequently used to redefine the corresponding parameters for the [[Team:ETH_Zurich/Modeling/SingleCell#Xylene_Sensor| xylene model ]]. | ||
| + | |||
| + | [[File:ETH_Xylene_FitPlot.png|700px|center|thumb|'''Figure 8: Dose response curve of XylR activation depending on xylene.''' A Hill type function (blue solid curve) was fitted to the measured data (black diamonds). The dotted black lines display the position of the K<sub>D</sub> value.]] | ||
| + | |||
| + | |||
{{:Team:ETH Zurich/Templates/SectionEnd}} | {{:Team:ETH Zurich/Templates/SectionEnd}} | ||
{{:Team:ETH Zurich/Templates/SectionStart}} | {{:Team:ETH Zurich/Templates/SectionStart}} | ||
= AraC - the arabinose sensor = | = AraC - the arabinose sensor = | ||
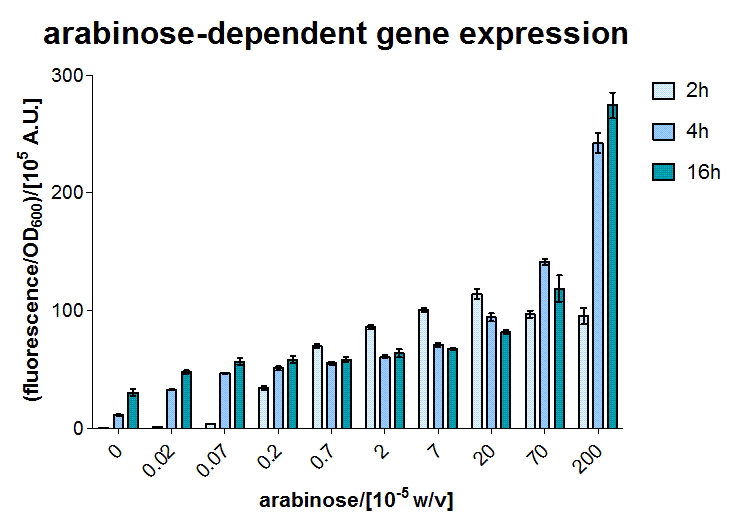
| - | [[File:Arabinose test.png|300px|right|thumb|'''Figure | + | [[File:Arabinose test.png|300px|right|thumb|'''Figure 9: Characterization of arabinose sensor for different concentration of arabinose. ''']] |
| - | + | The ''E.coli'' AraC sensor was used as a proof of concept input for our SmoColi system, as it is a well established expression system with an easily diffusing and easy to handle inducer. | |
| + | |||
| + | To test the sensor, the [[Team:ETH_Zurich/Biology/Detector#How_we_used_it_3| BW27783 ]] ''E.coli'' strain (containing a genomic version of AraC) was transformed with a medium copy plasmid containing a sfGFP reporter under control of the P<sub>BAD</sub> promoter [http://partsregistry.org/Part:BBa_I13453 BBa_I13453]. During exponential phase, LB liquid cultures were induced with various amounts of arabinose. Specific fluorescence was measured after 2, 4 and 16 hours. The results shown in Figure 9 exhibited an interesting behaviour. The values after 2 hours are in perfect correspondence with the data from the original publication introducing the strain [[#Ref2|[2]]]. For the datasets after 4 and 16 hours, the dynamic range of the fluorescent output is moved towards higher concentrations. At the moment we believe those effects to be due to nonlinear dynamics due to active arabinose import, which will be further explored by a modelling investigation. | ||
| + | |||
{{:Team:ETH Zurich/Templates/SectionEnd}} | {{:Team:ETH Zurich/Templates/SectionEnd}} | ||
| Line 62: | Line 94: | ||
= AlcR- the acetaldehyde sensor = | = AlcR- the acetaldehyde sensor = | ||
| - | [[File:Testsystem.png|300px|left|thumb|'''Figure | + | [[File:Testsystem.png|300px|left|thumb|'''Figure 10: Design of the AlcR testsystem''' AlcR gets produced upon addition of anhydrotetracycline. A 6x His-tag was added to the C-terminal end of AlcR to test the expression of ''alcR''.]] |
As described in the [[Team:ETH_Zurich/Biology/Detector#AlcR_Promoter| Smoke detectors section]] we designed two artificial AlcR-dependent promoters which get repressed upon binding of AlcR to acetaldehyde. For testing of our design we created a system with a sfGFP output in order to characterize the gene expression with different levels of AlcR production and acetaldehyde induction. | As described in the [[Team:ETH_Zurich/Biology/Detector#AlcR_Promoter| Smoke detectors section]] we designed two artificial AlcR-dependent promoters which get repressed upon binding of AlcR to acetaldehyde. For testing of our design we created a system with a sfGFP output in order to characterize the gene expression with different levels of AlcR production and acetaldehyde induction. | ||
| - | The system works in the following way (see Figure | + | The system works in the following way (see Figure 10): |
A) In normal medium conditions the TetR transcription factor is produced and binds to its cognate promoter, thus inhibiting the expression of ''alcR''. In this case no AlcR is present and GFP is produced. | A) In normal medium conditions the TetR transcription factor is produced and binds to its cognate promoter, thus inhibiting the expression of ''alcR''. In this case no AlcR is present and GFP is produced. | ||
| Line 75: | Line 107: | ||
<br clear="all" /> | <br clear="all" /> | ||
| - | ==Experiments and results for | + | ==Experiments and results for fungal AlcR== |
| - | In a first experiment, the ''alc''-promoters were tested by using a non-codon optimized natural variant of ''alcR''. Because of this we tested the compatibility of the codon usage in the variant from ''Aspergillus nidulans'' with the one from ''E. coli''. We received a codon adaptation index (CAI) of 0.7 [[# | + | In a first experiment, the ''alc''-promoters were tested by using a non-codon optimized natural variant of ''alcR''. Because of this we tested the compatibility of the codon usage in the variant from ''Aspergillus nidulans'' with the one from ''E. coli''. We received a codon adaptation index (CAI) of 0.7 [[#Ref3|[3]]]. Nevertheless, five rare arginine codons in ''E.coli'' were present within the first 20 amino acids of the gene. After a first experiment without any significant results (data not shown), the first three rare arginine codons of ''alcR'' were exchanged by PCR and a fully codon-optimized variant was ordered. All of the following experiments were performed with ''alcR'' codon-optimized within the first 20 amino acids. |
| - | The AlcR test was established as a two plasmid system containing ampicillin and kanamycin resistances and pMB1 respectively pSC101 origins of replication. These plasmids were co-transformed into ''E. coli'' JM101 strain. M9 medium was inoculated with an overnight culture of the strain. The bacteria were induced with different amounts of acetaldehyde (0, 10, 1000 µM) and anhydrotetracycline (0, 1, 100 ng/mL) during the exponential growth phase. In order to avoid evaporation of acetaldehyde, all equipment was cooled down to -20 degrees prior to preparation of the stock solutions. All solutions were afterwards prepared in tubes at | + | The AlcR test was established as a two plasmid system containing ampicillin and kanamycin resistances and pMB1 respectively pSC101 origins of replication. These plasmids were co-transformed into ''E. coli'' JM101 strain. M9 medium was inoculated with an overnight culture of the strain. The bacteria were induced with different amounts of acetaldehyde (0, 10, 1000 µM) and anhydrotetracycline (0, 1, 100 ng/mL) during the exponential growth phase. In order to avoid evaporation of acetaldehyde, all equipment was cooled down to -20 degrees prior to preparation of the stock solutions. All solutions were afterwards prepared in tubes at 4 °C. Finally, the cell suspension was added to the solutions and the tubes were tightly closed to prevent loss of acetaldehyde. Fluorescence and OD<sub>600</sub> measurements were performed in a 96-well plate several hours after induction. |
| - | [[File:Test Palc1.png|390px|left|thumb|'''Figure | + | [[File:Test Palc1.png|390px|left|thumb|'''Figure 11: Test results for [[Team:ETH_Zurich/Biology/Detector#AlcR_Promoter| P<sub>alc1</sub>''']]]] |
| - | [[File:Test Palc2.png|414px|right|thumb|'''Figure | + | [[File:Test Palc2.png|414px|right|thumb|'''Figure 12: Test results for [[Team:ETH_Zurich/Biology/Detector#AlcR_Promoter| P<sub>alc2</sub>''']]]] |
<br clear="all" /> | <br clear="all" /> | ||
| - | As visible on the two images above, no significant change in GFP fluorescence could be observed neither between different acetaldehyde concentrations nor between different AlcR induction levels. Because of these negative results and the non codon-optimized ''alcR'', we performed expression tests for the protein in ''E. coli'' strain JM101. In these experiments, gene expression was induced with different amounts of anhydrotetracycline during the exponential growth phase of the bacteria. After cultivation, cells were harvested and lysed either by using a Retsch mill or by lysozyme. After resuspension of the cell extract we performed both SDS-PAGE gels and western blots to check for ''alcR'' expression. Buffer was added to the cell debris and heated to | + | As visible on the two images above, no significant change in GFP fluorescence could be observed neither between different acetaldehyde concentrations nor between different AlcR induction levels. Because of these negative results and the non codon-optimized ''alcR'', we performed expression tests for the protein in ''E. coli'' strain JM101. In these experiments, gene expression was induced with different amounts of anhydrotetracycline during the exponential growth phase of the bacteria. After cultivation, cells were harvested and lysed either by using a Retsch mill or by lysozyme. After resuspension of the cell extract we performed both SDS-PAGE gels and western blots to check for ''alcR'' expression. Buffer was added to the cell debris and heated to 95 °C for 10 minutes in order to resolubilize potential inclusion bodies. |
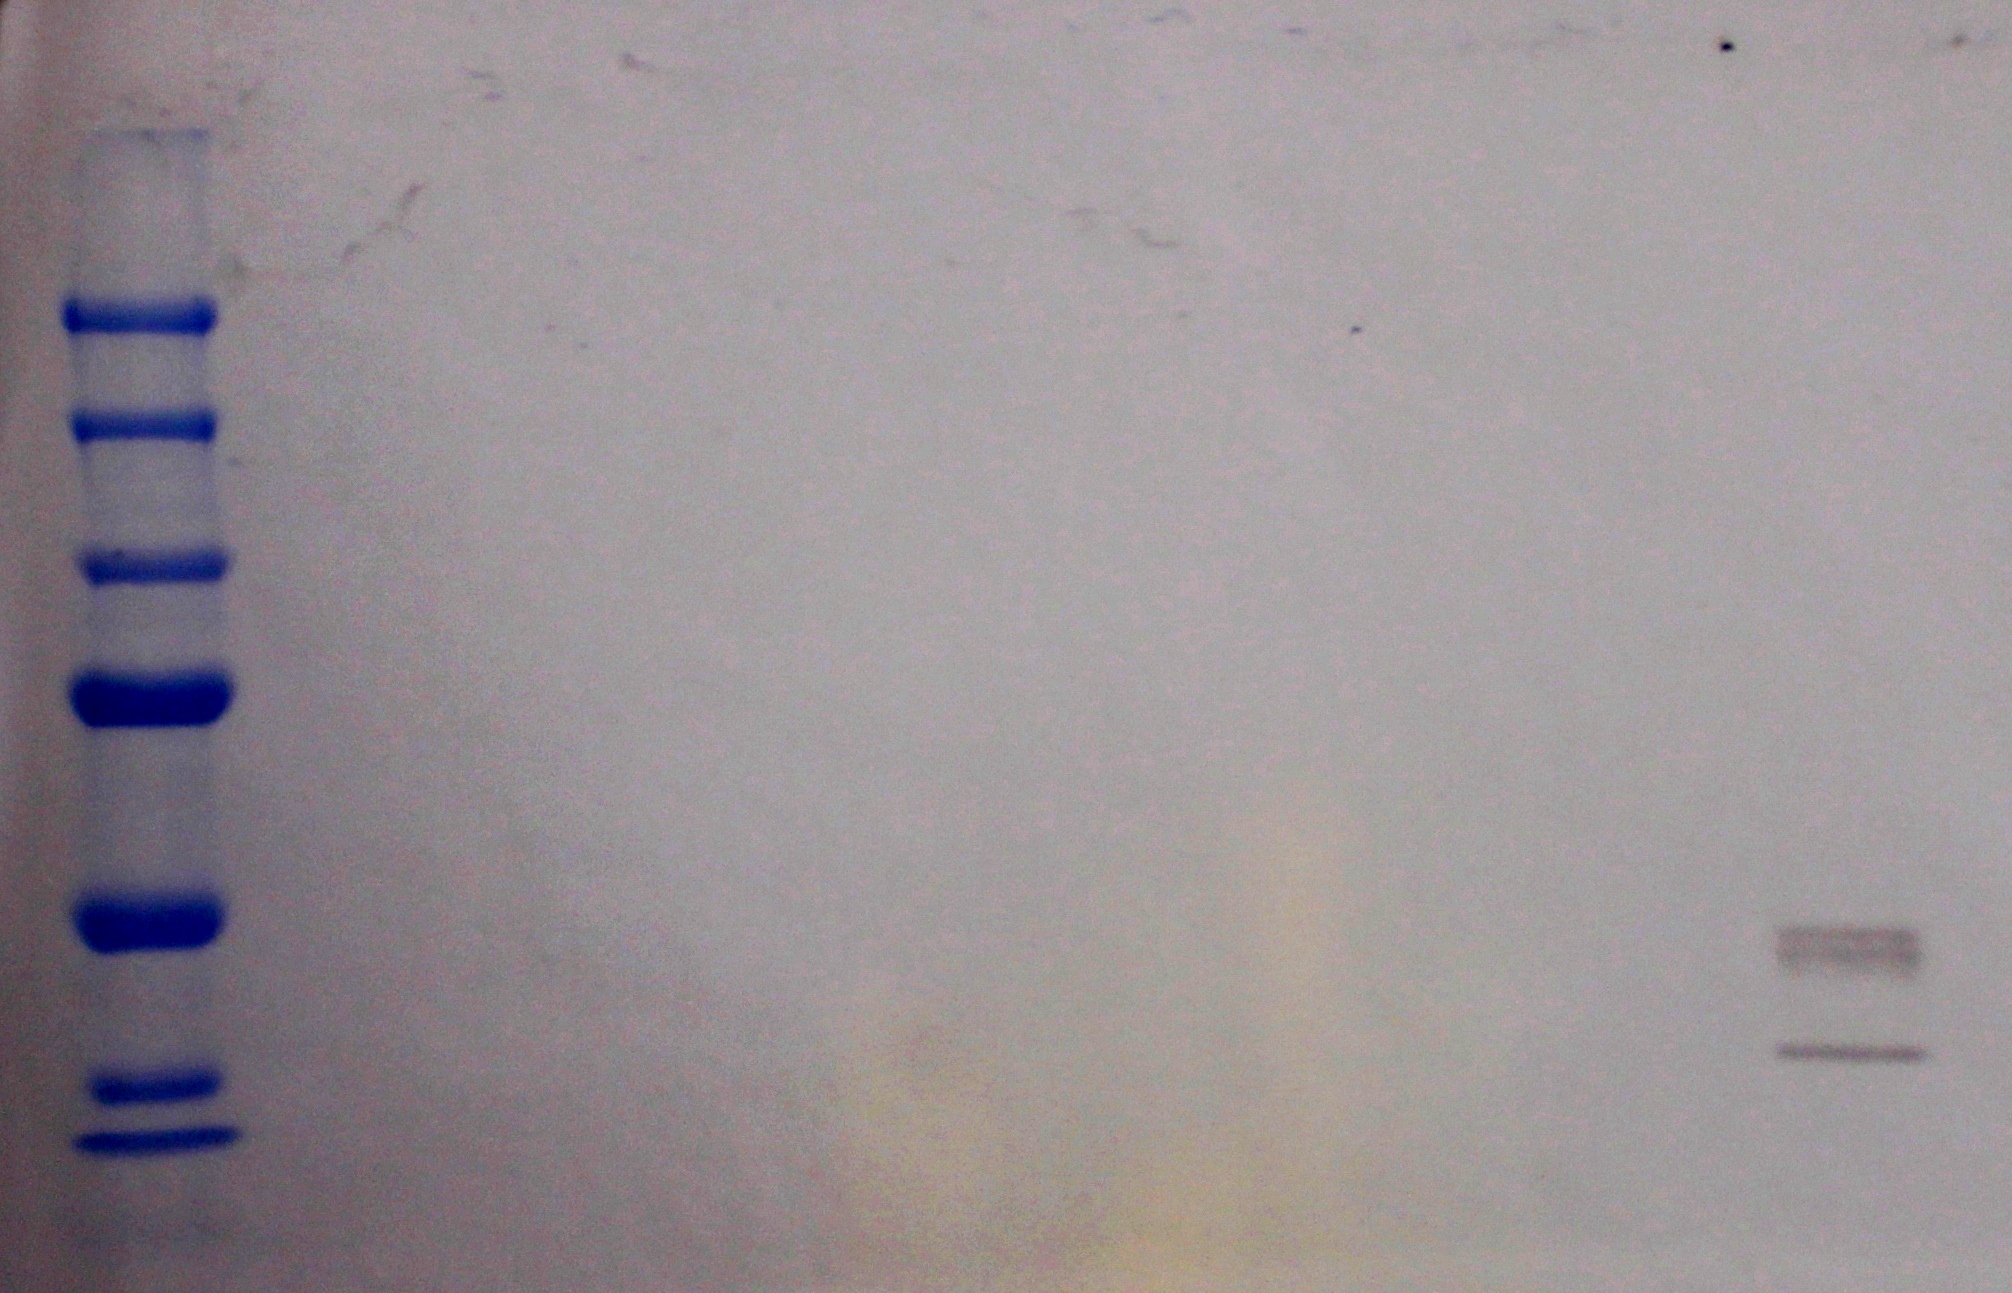
| - | AlcR has a molecular mass of about 96 kDa and thus its band was suspected to be on the same level as the red box marked in the SDS-PAGE gel (see Figure | + | AlcR has a molecular mass of about 96 kDa and thus its band was suspected to be on the same level as the red box marked in the SDS-PAGE gel (see Figure 13) [[#Ref4|[4]]]. Despite increasing amounts of anhydrotetracycline (wells 1 and 3: 0 ng/mL, 2 and 4: 1 ng/mL, 3 and 6: 100 ng/mL), no change could be observed in this area of the gel for any of the probes. A reason for this could be that ''alcR'' is not expressed at all. |
| - | To check again whether ''alcR'' is expressed at all we performed a western blot. Therefore, a 6x His-tag was added to the C-terminal end of AlcR and we used an anti-His antibody kit in order to detect it. A probe with another concentrated 6x His-tagged protein was added as positive control so that we could exclude systematic errors during the blotting procedure (see Figure | + | To check again whether ''alcR'' is expressed at all we performed a western blot. Therefore, a 6x His-tag was added to the C-terminal end of AlcR and we used an anti-His antibody kit in order to detect it. A probe with another concentrated 6x His-tagged protein was added as positive control so that we could exclude systematic errors during the blotting procedure (see Figure 14). |
| - | [[File:SDSfinal.png|300px|left|thumb|'''Figure | + | [[File:SDSfinal.png|300px|left|thumb|'''Figure 13: SDS-PAGE performed with cell extract supernatant for AlcR expression testing''' The red box indicates the level where a band of AlcR should be expected.]] |
| - | [[File:Western.JPG|300px|center|thumb|'''Figure | + | [[File:Western.JPG|300px|center|thumb|'''Figure 14: Western blot of cell extract supernatant for AlcR expression testing''' The visible bands are from a His-tagged positive control protein.]] |
Because we could not show any expression of ''alcR'' at all we suppose that there is no AlcR produced in the cells, probably due to the usage of rare codons in the gene. Due to a long delay in the synthesis of the codon-optimized part, we were not able to test our system with this variant until now. | Because we could not show any expression of ''alcR'' at all we suppose that there is no AlcR produced in the cells, probably due to the usage of rare codons in the gene. Due to a long delay in the synthesis of the codon-optimized part, we were not able to test our system with this variant until now. | ||
| Line 100: | Line 132: | ||
= Bandpass-Characterization of lacI<sub>M1</sub> = | = Bandpass-Characterization of lacI<sub>M1</sub> = | ||
| - | [[File:LacIM1.png|390px|left|thumb|'''Figure | + | [[File:LacIM1.png|390px|left|thumb|'''Figure 15: Design for the LacI<sub>M1</sub> characterization''']] |
| - | LacI<sub>M1</sub> ([http://partsregistry.org/Part:BBa_K625000 Bba_K625000]) is a LacI variant with the same protein sequence as the wild-type LacI, but with a completely codon-modified DNA sequence. [[# | + | LacI<sub>M1</sub> ([http://partsregistry.org/Part:BBa_K625000 Bba_K625000]) is a LacI variant with the same protein sequence as the wild-type LacI, but with a completely codon-modified DNA sequence. [[#Ref6|[6]]] This enables to use both sequences on two different plasmids (with two different promoters) without recombination happening between them, which is necessary for in our system to establish the bandpass filter. By entering this BioBrick into the registry, we wanted to check its functionality. Thus we engineered a test system for our BioBrick by adding a lac-dependent GFP reporter. A Tet promoter (P<sub>Tet</sub>) was put in front of ''lacI<sub>M1</sub>'' and TetR constitutively produced, thus preventing ''lacI<sub>M1</sub>'' from expression. |
In the non-induced state of the system, ''lacI<sub>M1</sub>'' expression is repressed and the cells produce GFP. | In the non-induced state of the system, ''lacI<sub>M1</sub>'' expression is repressed and the cells produce GFP. | ||
If anhydrotetracycline is added, TetR is released from the Tet promoter (P<sub>tet</sub>) and LacI is produced. LacI inhibits gfp transcription and the fluorescence decreases. Addition of IPTG although leads to the opposite case: LacI gets inhibited and the fluorescence increases. | If anhydrotetracycline is added, TetR is released from the Tet promoter (P<sub>tet</sub>) and LacI is produced. LacI inhibits gfp transcription and the fluorescence decreases. Addition of IPTG although leads to the opposite case: LacI gets inhibited and the fluorescence increases. | ||
| - | The test system for | + | The test system for [http://partsregistry.org/Part:BBa_K625000 BBa_K625000] was established as a single plasmid system. In the experiments we used the two different plasmids pSB1AK3 and pSB3C5 as backbones of the designed network. Experiments were performed in ''E.coli'' strain JM101, which was grown in M9 medium until exponential growth and then induced with increasing amounts of anhydrotetracyline (0 ng/mL, 1 ng/mL, 100 ng/mL) and IPTG (0 µM, 1 µM, 10 µM, 100 µM, 1000 µM). The cells were incubated in a 96-well plate at 37 °C and every 15 minutes OD<sub>600</sub> and GFP fluorescence was measured. |
'''Results''' | '''Results''' | ||
| - | <gallery widths= | + | <gallery widths=260px heights=180px perrow=3 caption="pSB3C5"> |
File:3c5_0.png | File:3c5_0.png | ||
File:3c5_1.png | File:3c5_1.png | ||
File:3c5_100.png | File:3c5_100.png | ||
</gallery> | </gallery> | ||
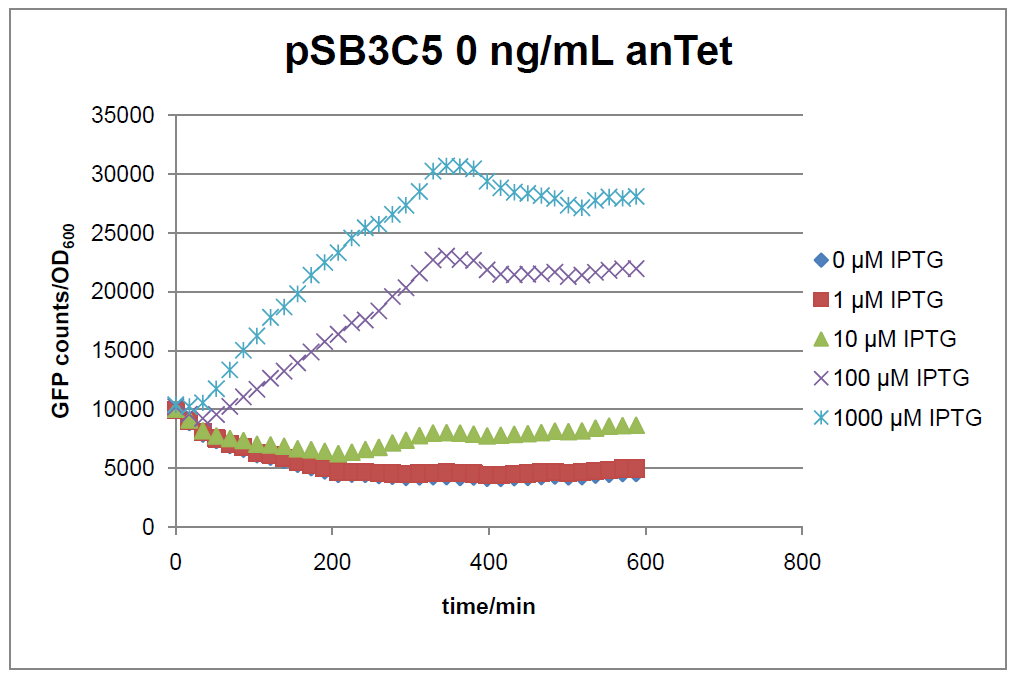
| - | '''Figure | + | '''Figure 16: time course of fluorescence''' depending on different expression levels of the transcriptional regulator LacI<sub>M1</sub>. pSB3C5 was used as plasmid backbone for the test system. |
| - | <gallery widths= | + | <gallery widths=260px heights=180px perrow=3 caption="pSB1AK3"> |
File:1ak3_0.png | File:1ak3_0.png | ||
File:1ak3_1.png | File:1ak3_1.png | ||
File:1ak3_100.png | File:1ak3_100.png | ||
</gallery> | </gallery> | ||
| - | '''Figure | + | '''Figure 17: time course of fluorescence''' depending on different expression levels of the transcriptional regulator LacI<sub>M1</sub>. pSB1AK3 was used as plasmid backbone for the test system. |
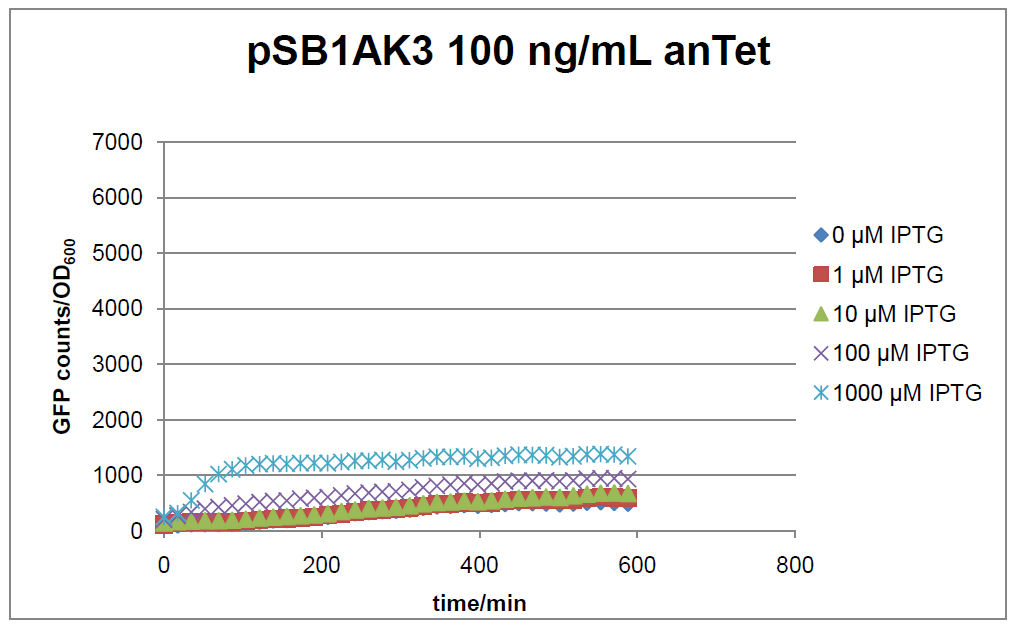
| - | In general the test system for characterization of our BioBrick parts BBa_K625000 respectively BBa_K625001 worked as expected. In both system we can see that the fluorescence decreases with increasing amounts of anhydrotetracycline. This indicates that LacI<sub>M1</sub> is induced and thus represses the expression of ''gfp''. By addition of IPTG LacI<sub>M1</sub> gets inhibited and therefore the GFP response increses. This tendency can be observed both in figure | + | In general the test system for characterization of our BioBrick parts [http://partsregistry.org/Part:BBa_K625000 BBa_K625000] respectively [http://partsregistry.org/Part:BBa_K625001 BBa_K625001] worked as expected. In both system we can see that the fluorescence decreases with increasing amounts of anhydrotetracycline. This indicates that LacI<sub>M1</sub> is induced and thus represses the expression of ''gfp''. By addition of IPTG LacI<sub>M1</sub> gets inhibited and therefore the GFP response increses. This tendency can be observed both in figure 16 and figure 17. |
| - | At a concentration of 100 ng/mL anhydrotetracycline, only a slight increase in fluorescence can be observed for increasing IPTG concentrations. We are supposing that the expression of ''lacI<sub>M1</sub>'' is fully induced at this level and thus the IPTG amount present in the system is not sufficient anymore to | + | At a concentration of 100 ng/mL anhydrotetracycline, only a slight increase in fluorescence can be observed for increasing IPTG concentrations. We are supposing that the expression of ''lacI<sub>M1</sub>'' is fully induced at this level and thus the IPTG amount present in the system is not sufficient anymore to derepressing all of the LacI<sub>M1</sub>. |
In the case where no anhydrotetracycline is present in the medium, there can still be observed a change in fluorescence depending on the level of IPTG. The same pattern of induction can be observed here as in the weakly induced systems. The reason for this is likely due to the leaky expression of the ''lacI<sub>M1</sub>'' gene, resulting in a small amount of LacI<sub>M1</sub> always present in the cells and thus inhibiting the GFP production. | In the case where no anhydrotetracycline is present in the medium, there can still be observed a change in fluorescence depending on the level of IPTG. The same pattern of induction can be observed here as in the weakly induced systems. The reason for this is likely due to the leaky expression of the ''lacI<sub>M1</sub>'' gene, resulting in a small amount of LacI<sub>M1</sub> always present in the cells and thus inhibiting the GFP production. | ||
| Line 137: | Line 169: | ||
= Alarm = | = Alarm = | ||
| - | [[File:ETH Alarm.png|300px|left|thumb|'''Figure | + | [[File:ETH Alarm.png|300px|left|thumb|'''Figure 18: Design of the quorum sensing based alarm system.''']] |
<!--[[File:ETHZ Test alarm.png|390px|left|thumb|'''Figure 12: Design of the quorum sensing based alarm system.''']] | <!--[[File:ETHZ Test alarm.png|390px|left|thumb|'''Figure 12: Design of the quorum sensing based alarm system.''']] | ||
| - | To test the alarm system we used a sender and receiver cell setup up. Sender cell produce the synthase LuxI which than | + | To test the alarm system we used a sender and receiver cell setup up. Sender cell produce the synthase LuxI which than produces AHL by a IPTG input. AHL diffuses to the receiver cells, binds and activates LuxR which itself inhibits RFP production. For the experimental setup we designed two plasmids, a sender plasmid containing P<sub>lac</sub>-''luxI''-terminator and a receiver plasmid with P<sub>const</sub>-''luxR''-terminator-P<sub>lux</sub>-''rfp''-terminator. The receiver and sender plasmids were transformed in JM101.--> |
| - | When | + | When finally having [https://2011.igem.org/Team:ETH_Zurich/Biology/MolecularMechanism#Cloning_successes_and_problems finished cloning] the complete system with arabinose as an inducer, we were really astonished that all colonies on the cotransformation of the three final plasmids turned red on standard LB agar plates, thus having a fully induced alarm signal. From the logic design, an alarm signal would only be expected at very high arabinose concentrations. This made us design test systems for the bandpass and the alarm separately, whereas here are the results for the latter one. |
| - | '' | + | |
| + | |||
| + | [[File:Ethz_Alarm_test_no_good.png|300px|right|thumb|'''Figure 19: Corepression by AHL of mCherry ''' driven by the [https://2011.igem.org/Team:ETH_Zurich/Biology/Detector#How_we_used_it_6 P<sub>lux</sub>] promoter]] | ||
| + | |||
| + | ''E.coli'' JM101 was transformed with a medium copy test plasmid containing the construct P<sub>const</sub>-''luxR''-terminator-P<sub>lux</sub>-''rfp''-terminator (The [https://2011.igem.org/Team:ETH_Zurich/Biology/Detector#How_we_used_it_6 P<sub>lux</sub>] being an engineered version of the natural one, where the operon site for LuxR is placed between the -10 and -35 region of the promoter, rendering LuxR a repressor). After grown to exponential phase, they were corepressed with different concentrations of commercial AHL. Upon bindung of AHL to LuxR it is supposed to repress RFP production, thus this should be a test system for the two parts (P<sub>const</sub>-luxR and P<sub>lux</sub>-mCherry contained on the plasmid, which are also used in the final system. | ||
| + | |||
| + | The corepression was performed with a wide range of AHL concentrations during the exponential growth phase, and specific fluorescence measured 5 hours later on a platereader. As can be seen in Figure 19, we could not find any response upon AHL sensing. Our hypothesis is that the engineered P<sub>lux</sub> is really sensitive on its surroundings and our construct with mCherry might impair with the regulation mechanism. This promoter has already previously raised intrigues, as nicely documented by the [http://partsregistry.org/Part:BBa_R0061:Experience#iGEM_Chiba_2010 2010 iGEM Chiba] team. This hyothesis will be tested by another experiment with a test construct containing the wild type Lux promoter around our P<sub>const</sub>-luxR construct. | ||
| + | |||
| + | |||
| + | |||
{{:Team:ETH Zurich/Templates/SectionEnd}} | {{:Team:ETH Zurich/Templates/SectionEnd}} | ||
{{:Team:ETH Zurich/Templates/SectionStart}} | {{:Team:ETH Zurich/Templates/SectionStart}} | ||
| Line 147: | Line 188: | ||
= Copy number test = | = Copy number test = | ||
'''Results for BBa_K625005''' | '''Results for BBa_K625005''' | ||
| - | [[File:Veeeeeeery final copy number test.png|210px|left|thumb|'''Figure | + | [[File:Veeeeeeery final copy number test.png|210px|left|thumb|'''Figure 20: Agarose gel''' with 2-log-ladder loaded in in lane one, digests of triplicates of the EcoRI digests of pSB6A1 (lane 2-4) and pSB6A5 (lane5-7).]] |
[http://partsregistry.org/Part:BBa_K625005 pSB6A5] is the version 5 BioBrick vector backbone of the medium copy (minimal pBR322 origin) pSB6A1 plasmid. This means, that the cassettes for the ORI and antibiotic resistance have been minimized (reduction of the size and transcriptional terminators flanking the prefix and the suffix have been added, to trancriptionally insulate the inserted parts from the vector backbone machinery and vice versa. This minimization yielded a reduction in size from 4022 bp to 2743 bp. | [http://partsregistry.org/Part:BBa_K625005 pSB6A5] is the version 5 BioBrick vector backbone of the medium copy (minimal pBR322 origin) pSB6A1 plasmid. This means, that the cassettes for the ORI and antibiotic resistance have been minimized (reduction of the size and transcriptional terminators flanking the prefix and the suffix have been added, to trancriptionally insulate the inserted parts from the vector backbone machinery and vice versa. This minimization yielded a reduction in size from 4022 bp to 2743 bp. | ||
| - | [[Image:Veeeeeeery final copy number test gel.png|210px|right|thumb|'''Figure | + | [[Image:Veeeeeeery final copy number test gel.png|210px|right|thumb|'''Figure 21: Agarose gel''' with 2-log-ladder loaded in in lane one, digests of triplicates of the EcoRI digests of pSB6A1 (lane 2-4) and pSB6A5 (lane5-7).]] |
| - | For comparison of the copy number of the plasmids, triplicates of OD normalized bacterial cultures containing the respective plasmids were miniprepped. The DNA concentration was then determined by an agarose DNA gel electrophoresis of EcoRI digests of the purified plasmids (Figure | + | For comparison of the copy number of the plasmids, triplicates of OD normalized bacterial cultures containing the respective plasmids were miniprepped. The DNA concentration was then determined by an agarose DNA gel electrophoresis of EcoRI digests of the purified plasmids (Figure 21). This experiment showed a clear reduction in copy number of the minimized version of the original plasmid (Figure 20). Possible reasons for this could be deletion of some unknown regulatory sequences during minimization of the ORI or transcription from within the insert into the origin region in psB6A1 impacting the replication machinery. |
{{:Team:ETH Zurich/Templates/SectionEnd}} | {{:Team:ETH Zurich/Templates/SectionEnd}} | ||
{{:Team:ETH Zurich/Templates/SectionStart}} | {{:Team:ETH Zurich/Templates/SectionStart}} | ||
= References = | = References = | ||
| - | |||
| - | |||
<span id="Ref1">[1] [http://www.pnas.org/content/97/12/6640.full.pdf+html Kirill A. Datsenko and Barry L. Wanner: '''One-step inactivation of chromosomal genes in Escherichia coli K-12 using PCR products''' 2000, Proc Natl Acad Sci USA, 97: 6640-5]</span> | <span id="Ref1">[1] [http://www.pnas.org/content/97/12/6640.full.pdf+html Kirill A. Datsenko and Barry L. Wanner: '''One-step inactivation of chromosomal genes in Escherichia coli K-12 using PCR products''' 2000, Proc Natl Acad Sci USA, 97: 6640-5]</span> | ||
| - | <span id="Ref2">[2] [http://www.ncbi.nlm.nih.gov/pubmed/3072264 Beatrice Felenbok et al. '''The ethanol regulon in ''Aspergillus nidulans'': characterization and sequence of the positive regulatory gene alcR Gene''' 1988 ; 73(2): 385-96]</span> | + | <span id="Ref2">[2] [http://mic.sgmjournals.org/content/147/12/3241/F4.expansion.html A. Khlebnikov, K. Datsenko, T. Skaug, B. Wanner and J. Keasling: '''Homogeneous expression of the P<sub>BAD</sub> promoter in Escherichia coli by constitutive expression of the low-affinity high-capacity AraE transporter,''' Microbiology, 2001, (147): 3241–3247]</span> |
| + | |||
| + | <span id="Ref3">[3] [http://www.ncbi.nlm.nih.gov/pubmed/3072264 Beatrice Felenbok et al. '''The ethanol regulon in ''Aspergillus nidulans'': characterization and sequence of the positive regulatory gene alcR Gene''' 1988 ; 73(2): 385-96]</span> | ||
| - | <span id=" | + | <span id="Ref4">[4] [http://www.ncbi.nlm.nih.gov/pubmed/11550794 Beatrice Felenbok, Michel Flipphi and Igor Nikolaev: '''Ethanol Catabolism in ''Aspergillus nidulans'': A Model System for Studying Gene Regulation, Progress in Nucleic Acid Research and Molecular Biology''', 69: 149-204]</span> |
| - | <span id=" | + | <span id="Ref5">[5] [http://aem.asm.org/cgi/content/abstract/64/2/748 S. Panke, J. M. Sanchez Romero, V. de Lorenzo: '''Engineering of Quasi-Natural Pseudomonas putida Strains for Toluene Metabolism through an ortho-Cleavage Degradation Pathway''' , Applied and Environmental Microbiology, 1998, 64: 748-751]</span> |
| - | <span id=" | + | <span id="Ref6">[6] [http://www.nature.com/nature/journal/v434/n7037/full/nature03461.html Subhayu Basu, Yoram Gerchman1, Cynthia H. Collins, Frances H. Arnold & Ron Weiss: '''A synthetic multicellular system for programmed pattern formation''', Nature 2005, 434: 1130-11342]</span> |
{{:Team:ETH Zurich/Templates/SectionEnd}} | {{:Team:ETH Zurich/Templates/SectionEnd}} | ||
{{:Team:ETH Zurich/Templates/HeaderNewEnd}} | {{:Team:ETH Zurich/Templates/HeaderNewEnd}} | ||
Latest revision as of 03:17, 29 October 2011

Contents |
Experimental results
For the 3 subparts of SmoColi we designed additional test systems to test the functionality of the single parts. Alike all new or improved biobricks were tested and characterized before they were implemented in the subparts. For the sensors we tested the repressors or activators in the presence of the corresponding small molecule. For the Pu promoter we show a dose response for xylene over air. In the case of arabinose, by knocking out the transporter, we could also change the ON-/OFF character of AraC to a dose response for arabinose. The fungal AlcR sensor however seems not to work as an network element in E.coli.
XylR - the xylene sensor
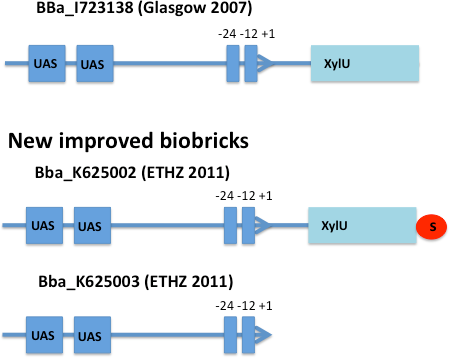
E. coli strain JM101 was transformed with two plasmids containing the transcriptional regulator XylR, the degradation cassette xylMABN and a GFP reporter coupled to [http://partsregistry.org/Part:BBa_K625002 BBa_K625002] respectively [http://partsregistry.org/Part:BBa_K625003 BBa_K625003]. [http://partsregistry.org/Part:BBa_K625002 BBa_K625002] is an improved version of the Pu promoter [http://partsregistry.org/Part:BBa_I723138 BBa_I723138] were we inserted a stop codon to prevent fusion proteins. [http://partsregistry.org/Part:BBa_K625003 BBa_K625003] is a minimal version of the Pu promoter, where the partial XylU sequence is deleted. The regulator and degradation pathway was provided by Sven Panke on the plasmid pCK04AxylR according to [5]. The reporter plasmid was constructed by using [http://partsregistry.org/Part:BBa_K625005 BBa_K625005] as a backbone.
We inoculated 50 mL of LB medium with an overnight culture of the co-transformed strains and set the OD600 to 0.1. Upon reaching the exponential growth phase, the cultures were induced with m-xylene. Therefore we put a sterile test tube with m-xylene into the flask and tightly sealed it with parafilm in order to get an air-induced response (see Figure 4 below). This way of inducing was chosen due to the very high volatility of Xylene, when dissolved in water, which makes it impossible to set its concentration in an open system.
OD600 and GFP fluorescence was measured after different time periods in a 96-well plate. Afterwards the data was normalized in order to get more consistent results.
Comparison of the two promoter versions
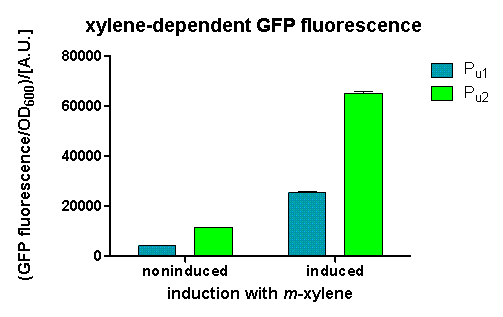
After 3 h we could observe a clear increase in GFP fluorescence when m-xylene was added in a test tube. Thus GFP production can be induced by m-xylene present from the air. The results of the experiments can be seen in Figure 8. By comparing [http://partsregistry.org/Part:BBa_K625002 BBa_K625002] and [http://partsregistry.org/Part:BBa_K625003 BBa_K625003], we can see higher expression rates for the shortened promoter [http://partsregistry.org/Part:BBa_K625003 BBa_K625003] compared to the longer one, both in induced and noninduced state. The increase of promoter strength is thought to be some unknown mechanism of the deleted part of the promoter like mRNA secondary structure formation or a change of mRNA degradation rate.
Nevertheless, we could also see a higher level of induction in the setup with [http://partsregistry.org/Part:BBa_K625003 BBa_K625003] (around 7-fold) compared to the [http://partsregistry.org/Part:BBa_K625002 BBa_K625002] setup (around 5-fold). Thus both of the provided promoters can be used for transcriptional regulation with XylR with different strength.
[http://partsregistry.org/Part:BBa_K625003 BBa_K625003] characterization
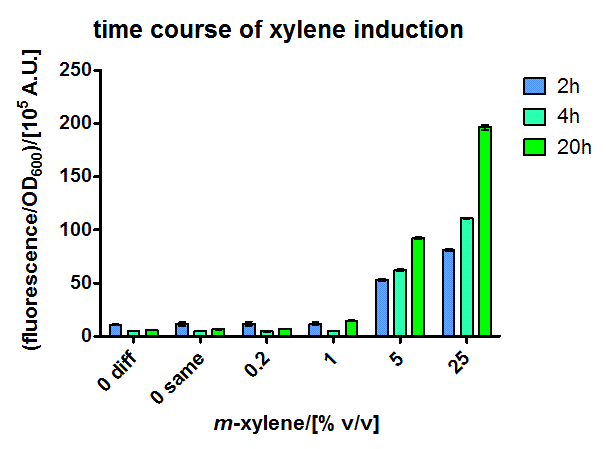
The short version of the PU promoter was characterized in more detail. These experiments were performed in M9 medium containing 0.5 % glucose, in the hope of less leaky transcription through more defined medium. The extent of xylene induction was modulated by performing the induction over air not only with pure xylene, but also with mixtures of xylene and paraffin oil, which gives lower xylene concentration within the medium due to a lower partial pressure. Therefore a 50 ml shaking flask culture of JM101 containing the sensor plasmid PcK04AxylR and a medium copy plasmid with a sfGFP reporter under [http://partsregistry.org/Part:BBa_K625003 BBa_K625003] control was induced in exponential phase with different dilutions of xylene in paraffin oil. The specific fluorescence was measured in a platereader and dose-responsiveness could be shown for all timepoints (Figure 3), with the overnight one having the lowest detection limit.
These promising results made us calculate the xylene distribution in our thermodynamically closed system, to get a proper dose response for XylR. (The induction with 25 % xylene in paraffin oil in excess would for example correspond to a concentration in the medium of 775 μM, which means a responsiveness in the micromolar range, which is expected)
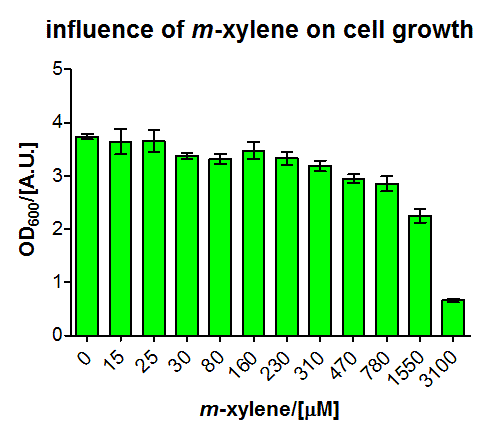
In another experiment (some shaking flasks containing the test tubes for induction shown in Figure 4), the dose response curve for the same cells was collected in the same way after overnight growth (Figure 5). Xylene was already detected in the lower micromolar range. For the highest induction rates in the low millimolar range, a certain toxicity was already observed, as can be seen by a decreased OD600 (Figure 6). The promoter was found to be rather strong, as it showed expression rates of about a quarter of a [http://partsregistry.org/Part:BBa_K180000 Tac] promoter induced with 100μM IPTG (positive control) and its leakyness was found to be negligible (negative control). (see Figure 7)
Dose response curve
We fitted the activation data in dependency of the xylene concentration to a Hill function. Since for a xylene concentration of 3100 μM the measured OD600 value was significantly reduced compared to the other xylene concentrations, this data point was removed from the analysis (this concentration can be considered to be toxic for the cells). For a xylene concentration of 1550 μM the fluorescence signal was considered to have reached steady state (see Figure 5). Thus, we defined the relative activation for a given xylene concentration as the ratio between a given fluorescence signal and the fluorescence signal for a xylene concentration of 1550 μM (see Figure 8).
To this data (see Figure 8) we fitted the Hill function
with KD the dissociation constant and n the Hill coefficient. We obtained optimal values of
KD=144.1 μM≈144 μM;
n=1.055≈1
Since the Hill coefficient is close to 1, we can assume non-cooperative activation of XylR. This data was subsequently used to redefine the corresponding parameters for the xylene model .
AraC - the arabinose sensor
The E.coli AraC sensor was used as a proof of concept input for our SmoColi system, as it is a well established expression system with an easily diffusing and easy to handle inducer.
To test the sensor, the BW27783 E.coli strain (containing a genomic version of AraC) was transformed with a medium copy plasmid containing a sfGFP reporter under control of the PBAD promoter [http://partsregistry.org/Part:BBa_I13453 BBa_I13453]. During exponential phase, LB liquid cultures were induced with various amounts of arabinose. Specific fluorescence was measured after 2, 4 and 16 hours. The results shown in Figure 9 exhibited an interesting behaviour. The values after 2 hours are in perfect correspondence with the data from the original publication introducing the strain [2]. For the datasets after 4 and 16 hours, the dynamic range of the fluorescent output is moved towards higher concentrations. At the moment we believe those effects to be due to nonlinear dynamics due to active arabinose import, which will be further explored by a modelling investigation.
AlcR- the acetaldehyde sensor
As described in the Smoke detectors section we designed two artificial AlcR-dependent promoters which get repressed upon binding of AlcR to acetaldehyde. For testing of our design we created a system with a sfGFP output in order to characterize the gene expression with different levels of AlcR production and acetaldehyde induction.
The system works in the following way (see Figure 10):
A) In normal medium conditions the TetR transcription factor is produced and binds to its cognate promoter, thus inhibiting the expression of alcR. In this case no AlcR is present and GFP is produced.
B) Upon addition of increasing amounts of anhydrotetracycline, TetR gets released from the promoter and AlcR is produced. The amount of AlcR should increase with increasing amounts of anhydrotetracycline.
C) By addition of acetaldehyde AlcR binds to the alc-promoter and the GFP response decreases.
Experiments and results for fungal AlcR
In a first experiment, the alc-promoters were tested by using a non-codon optimized natural variant of alcR. Because of this we tested the compatibility of the codon usage in the variant from Aspergillus nidulans with the one from E. coli. We received a codon adaptation index (CAI) of 0.7 [3]. Nevertheless, five rare arginine codons in E.coli were present within the first 20 amino acids of the gene. After a first experiment without any significant results (data not shown), the first three rare arginine codons of alcR were exchanged by PCR and a fully codon-optimized variant was ordered. All of the following experiments were performed with alcR codon-optimized within the first 20 amino acids.
The AlcR test was established as a two plasmid system containing ampicillin and kanamycin resistances and pMB1 respectively pSC101 origins of replication. These plasmids were co-transformed into E. coli JM101 strain. M9 medium was inoculated with an overnight culture of the strain. The bacteria were induced with different amounts of acetaldehyde (0, 10, 1000 µM) and anhydrotetracycline (0, 1, 100 ng/mL) during the exponential growth phase. In order to avoid evaporation of acetaldehyde, all equipment was cooled down to -20 degrees prior to preparation of the stock solutions. All solutions were afterwards prepared in tubes at 4 °C. Finally, the cell suspension was added to the solutions and the tubes were tightly closed to prevent loss of acetaldehyde. Fluorescence and OD600 measurements were performed in a 96-well plate several hours after induction.
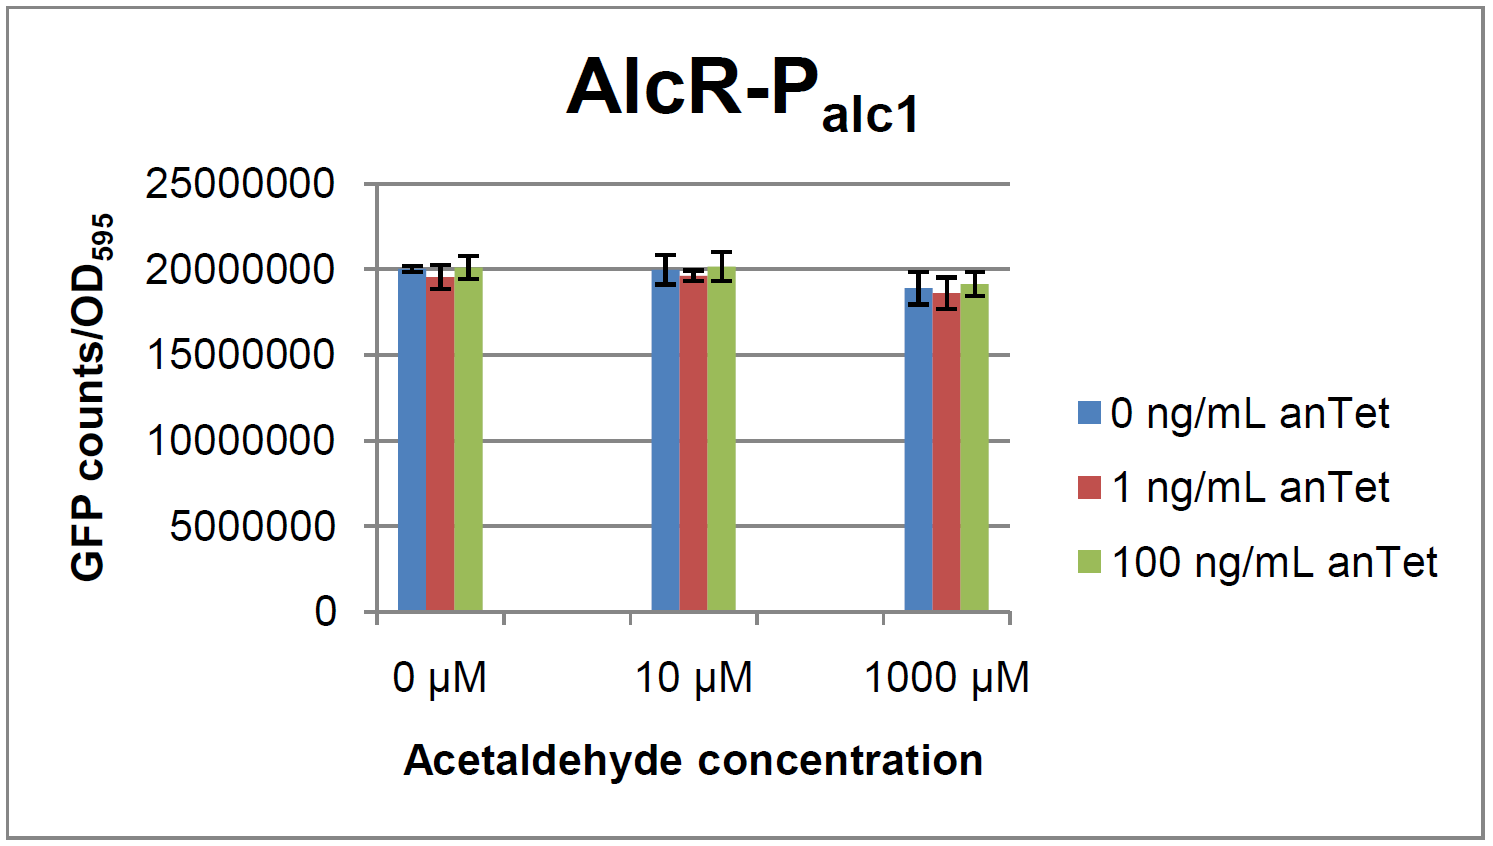
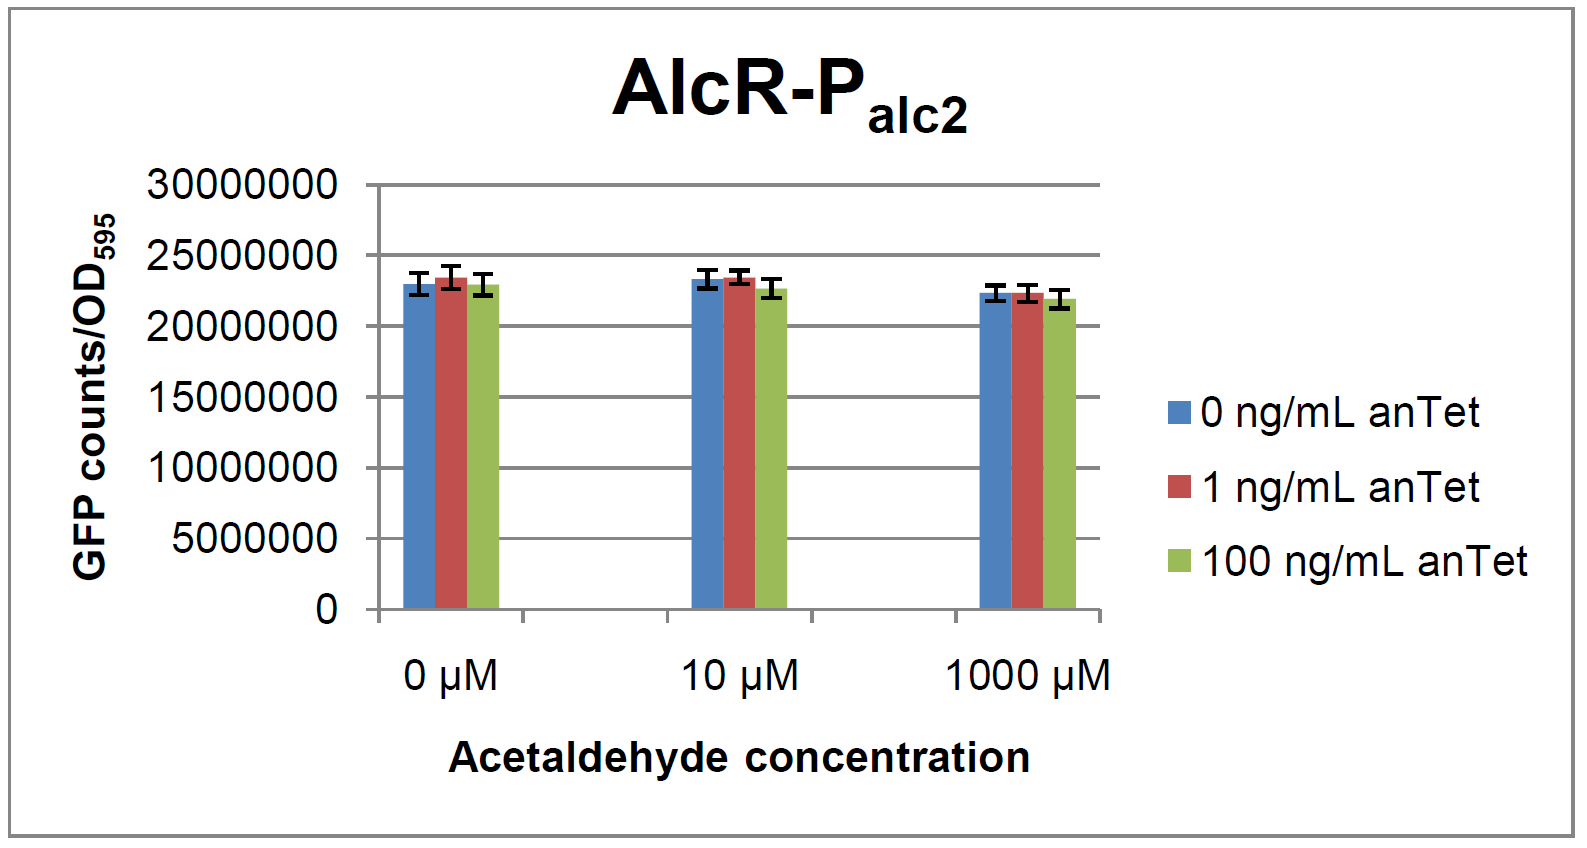
As visible on the two images above, no significant change in GFP fluorescence could be observed neither between different acetaldehyde concentrations nor between different AlcR induction levels. Because of these negative results and the non codon-optimized alcR, we performed expression tests for the protein in E. coli strain JM101. In these experiments, gene expression was induced with different amounts of anhydrotetracycline during the exponential growth phase of the bacteria. After cultivation, cells were harvested and lysed either by using a Retsch mill or by lysozyme. After resuspension of the cell extract we performed both SDS-PAGE gels and western blots to check for alcR expression. Buffer was added to the cell debris and heated to 95 °C for 10 minutes in order to resolubilize potential inclusion bodies.
AlcR has a molecular mass of about 96 kDa and thus its band was suspected to be on the same level as the red box marked in the SDS-PAGE gel (see Figure 13) [4]. Despite increasing amounts of anhydrotetracycline (wells 1 and 3: 0 ng/mL, 2 and 4: 1 ng/mL, 3 and 6: 100 ng/mL), no change could be observed in this area of the gel for any of the probes. A reason for this could be that alcR is not expressed at all.
To check again whether alcR is expressed at all we performed a western blot. Therefore, a 6x His-tag was added to the C-terminal end of AlcR and we used an anti-His antibody kit in order to detect it. A probe with another concentrated 6x His-tagged protein was added as positive control so that we could exclude systematic errors during the blotting procedure (see Figure 14).
Because we could not show any expression of alcR at all we suppose that there is no AlcR produced in the cells, probably due to the usage of rare codons in the gene. Due to a long delay in the synthesis of the codon-optimized part, we were not able to test our system with this variant until now.
Bandpass-Characterization of lacIM1
LacIM1 ([http://partsregistry.org/Part:BBa_K625000 Bba_K625000]) is a LacI variant with the same protein sequence as the wild-type LacI, but with a completely codon-modified DNA sequence. [6] This enables to use both sequences on two different plasmids (with two different promoters) without recombination happening between them, which is necessary for in our system to establish the bandpass filter. By entering this BioBrick into the registry, we wanted to check its functionality. Thus we engineered a test system for our BioBrick by adding a lac-dependent GFP reporter. A Tet promoter (PTet) was put in front of lacIM1 and TetR constitutively produced, thus preventing lacIM1 from expression.
In the non-induced state of the system, lacIM1 expression is repressed and the cells produce GFP. If anhydrotetracycline is added, TetR is released from the Tet promoter (Ptet) and LacI is produced. LacI inhibits gfp transcription and the fluorescence decreases. Addition of IPTG although leads to the opposite case: LacI gets inhibited and the fluorescence increases.
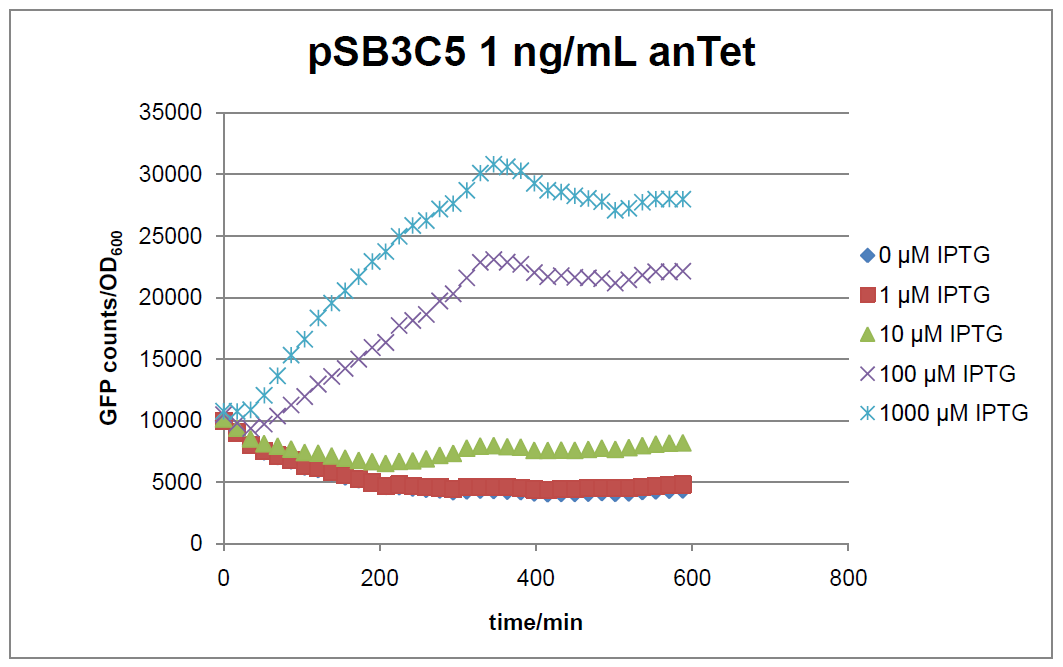
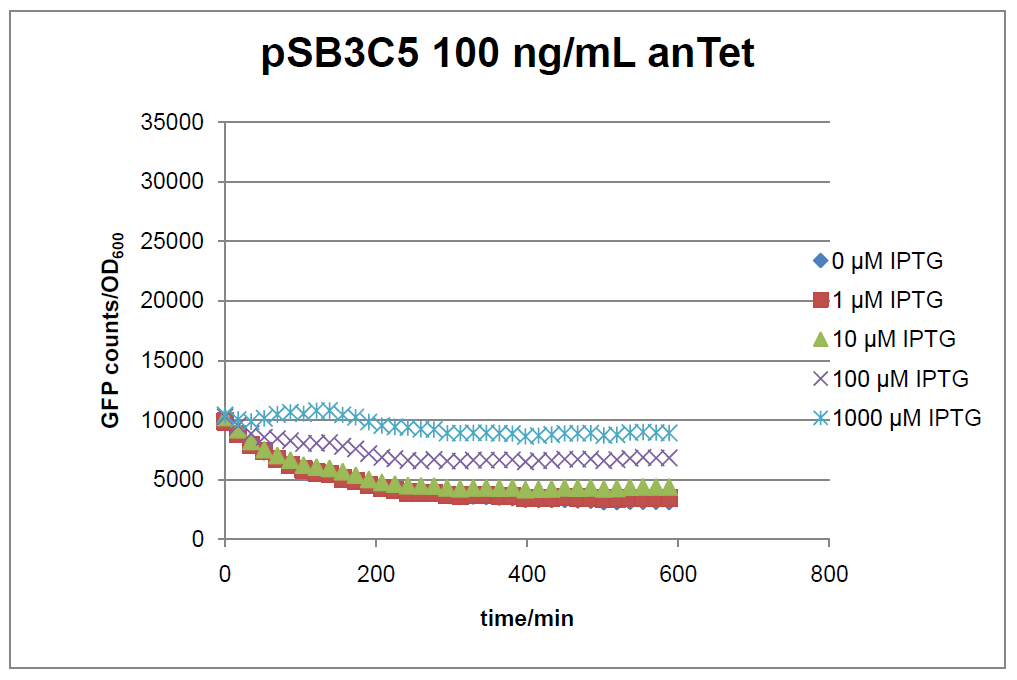
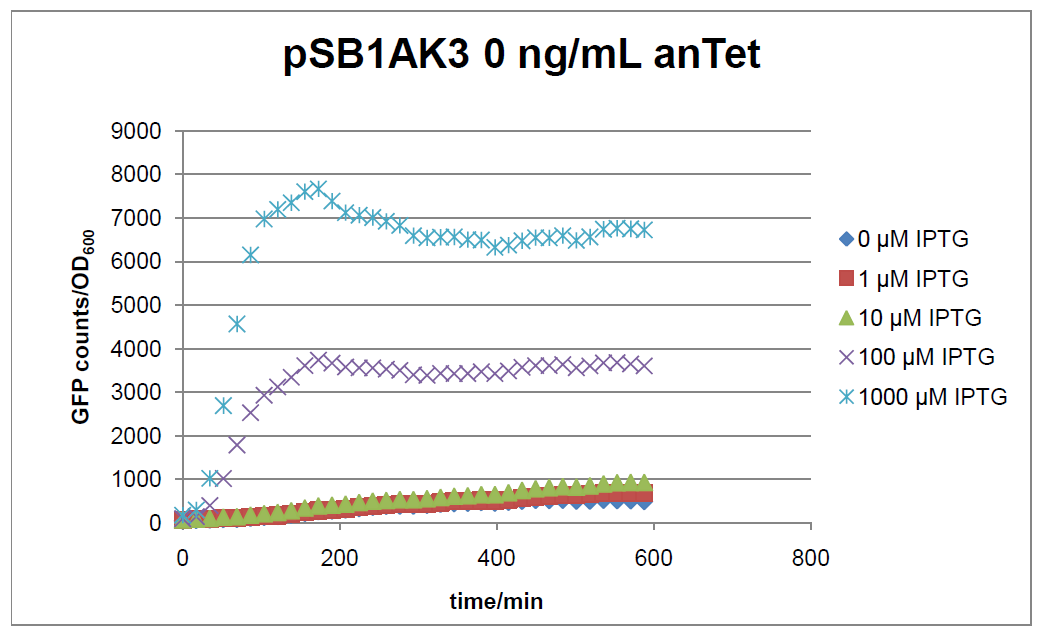
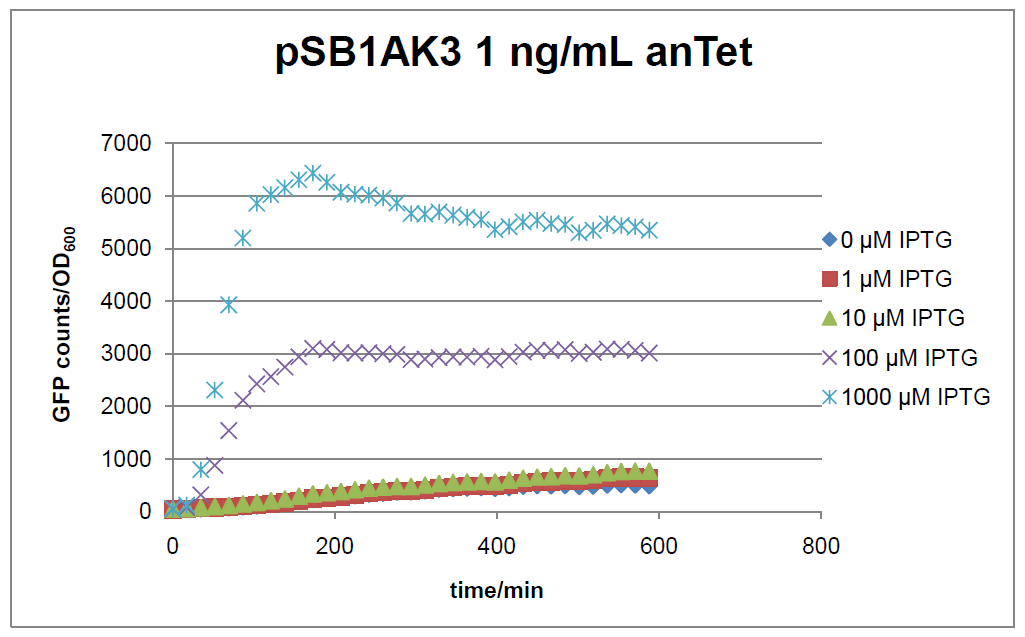
The test system for [http://partsregistry.org/Part:BBa_K625000 BBa_K625000] was established as a single plasmid system. In the experiments we used the two different plasmids pSB1AK3 and pSB3C5 as backbones of the designed network. Experiments were performed in E.coli strain JM101, which was grown in M9 medium until exponential growth and then induced with increasing amounts of anhydrotetracyline (0 ng/mL, 1 ng/mL, 100 ng/mL) and IPTG (0 µM, 1 µM, 10 µM, 100 µM, 1000 µM). The cells were incubated in a 96-well plate at 37 °C and every 15 minutes OD600 and GFP fluorescence was measured.
Results
Figure 16: time course of fluorescence depending on different expression levels of the transcriptional regulator LacIM1. pSB3C5 was used as plasmid backbone for the test system.
Figure 17: time course of fluorescence depending on different expression levels of the transcriptional regulator LacIM1. pSB1AK3 was used as plasmid backbone for the test system.
In general the test system for characterization of our BioBrick parts [http://partsregistry.org/Part:BBa_K625000 BBa_K625000] respectively [http://partsregistry.org/Part:BBa_K625001 BBa_K625001] worked as expected. In both system we can see that the fluorescence decreases with increasing amounts of anhydrotetracycline. This indicates that LacIM1 is induced and thus represses the expression of gfp. By addition of IPTG LacIM1 gets inhibited and therefore the GFP response increses. This tendency can be observed both in figure 16 and figure 17.
At a concentration of 100 ng/mL anhydrotetracycline, only a slight increase in fluorescence can be observed for increasing IPTG concentrations. We are supposing that the expression of lacIM1 is fully induced at this level and thus the IPTG amount present in the system is not sufficient anymore to derepressing all of the LacIM1.
In the case where no anhydrotetracycline is present in the medium, there can still be observed a change in fluorescence depending on the level of IPTG. The same pattern of induction can be observed here as in the weakly induced systems. The reason for this is likely due to the leaky expression of the lacIM1 gene, resulting in a small amount of LacIM1 always present in the cells and thus inhibiting the GFP production.
After about 300 min for pSB3C5 and about 200 min for pSB1AK3, the cells enter stationary phase and the flourescence intensity and OD600 do not increase anymore.
Alarm
When finally having finished cloning the complete system with arabinose as an inducer, we were really astonished that all colonies on the cotransformation of the three final plasmids turned red on standard LB agar plates, thus having a fully induced alarm signal. From the logic design, an alarm signal would only be expected at very high arabinose concentrations. This made us design test systems for the bandpass and the alarm separately, whereas here are the results for the latter one.
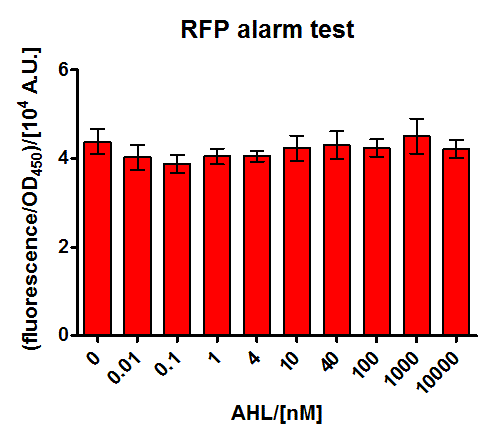
E.coli JM101 was transformed with a medium copy test plasmid containing the construct Pconst-luxR-terminator-Plux-rfp-terminator (The Plux being an engineered version of the natural one, where the operon site for LuxR is placed between the -10 and -35 region of the promoter, rendering LuxR a repressor). After grown to exponential phase, they were corepressed with different concentrations of commercial AHL. Upon bindung of AHL to LuxR it is supposed to repress RFP production, thus this should be a test system for the two parts (Pconst-luxR and Plux-mCherry contained on the plasmid, which are also used in the final system.
The corepression was performed with a wide range of AHL concentrations during the exponential growth phase, and specific fluorescence measured 5 hours later on a platereader. As can be seen in Figure 19, we could not find any response upon AHL sensing. Our hypothesis is that the engineered Plux is really sensitive on its surroundings and our construct with mCherry might impair with the regulation mechanism. This promoter has already previously raised intrigues, as nicely documented by the [http://partsregistry.org/Part:BBa_R0061:Experience#iGEM_Chiba_2010 2010 iGEM Chiba] team. This hyothesis will be tested by another experiment with a test construct containing the wild type Lux promoter around our Pconst-luxR construct.
Copy number test
Results for BBa_K625005
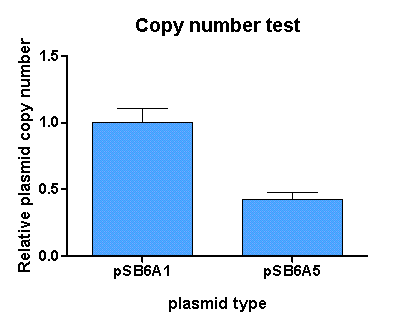
[http://partsregistry.org/Part:BBa_K625005 pSB6A5] is the version 5 BioBrick vector backbone of the medium copy (minimal pBR322 origin) pSB6A1 plasmid. This means, that the cassettes for the ORI and antibiotic resistance have been minimized (reduction of the size and transcriptional terminators flanking the prefix and the suffix have been added, to trancriptionally insulate the inserted parts from the vector backbone machinery and vice versa. This minimization yielded a reduction in size from 4022 bp to 2743 bp.
For comparison of the copy number of the plasmids, triplicates of OD normalized bacterial cultures containing the respective plasmids were miniprepped. The DNA concentration was then determined by an agarose DNA gel electrophoresis of EcoRI digests of the purified plasmids (Figure 21). This experiment showed a clear reduction in copy number of the minimized version of the original plasmid (Figure 20). Possible reasons for this could be deletion of some unknown regulatory sequences during minimization of the ORI or transcription from within the insert into the origin region in psB6A1 impacting the replication machinery.
References
[1] [http://www.pnas.org/content/97/12/6640.full.pdf+html Kirill A. Datsenko and Barry L. Wanner: One-step inactivation of chromosomal genes in Escherichia coli K-12 using PCR products 2000, Proc Natl Acad Sci USA, 97: 6640-5]
[2] [http://mic.sgmjournals.org/content/147/12/3241/F4.expansion.html A. Khlebnikov, K. Datsenko, T. Skaug, B. Wanner and J. Keasling: Homogeneous expression of the PBAD promoter in Escherichia coli by constitutive expression of the low-affinity high-capacity AraE transporter, Microbiology, 2001, (147): 3241–3247]
[3] [http://www.ncbi.nlm.nih.gov/pubmed/3072264 Beatrice Felenbok et al. The ethanol regulon in Aspergillus nidulans: characterization and sequence of the positive regulatory gene alcR Gene 1988 ; 73(2): 385-96]
[4] [http://www.ncbi.nlm.nih.gov/pubmed/11550794 Beatrice Felenbok, Michel Flipphi and Igor Nikolaev: Ethanol Catabolism in Aspergillus nidulans: A Model System for Studying Gene Regulation, Progress in Nucleic Acid Research and Molecular Biology, 69: 149-204]
[5] [http://aem.asm.org/cgi/content/abstract/64/2/748 S. Panke, J. M. Sanchez Romero, V. de Lorenzo: Engineering of Quasi-Natural Pseudomonas putida Strains for Toluene Metabolism through an ortho-Cleavage Degradation Pathway , Applied and Environmental Microbiology, 1998, 64: 748-751]
[6] [http://www.nature.com/nature/journal/v434/n7037/full/nature03461.html Subhayu Basu, Yoram Gerchman1, Cynthia H. Collins, Frances H. Arnold & Ron Weiss: A synthetic multicellular system for programmed pattern formation, Nature 2005, 434: 1130-11342]
 "
"

