Team:Bielefeld-Germany/SinceAmsterdam
From 2011.igem.org
(→Limit of detection) |
(→Model for the fusion protein between FNR, BisdA and BisdB) |
||
| (37 intermediate revisions not shown) | |||
| Line 1: | Line 1: | ||
{{Bielefeld_2011_Header}} | {{Bielefeld_2011_Header}} | ||
| + | <html><img src="https://static.igem.org/mediawiki/2011/0/09/Bielefeld-header-since.png"/><p></p></html> | ||
=What we improved since the European Regional Jamboree= | =What we improved since the European Regional Jamboree= | ||
==BPA degradation== | ==BPA degradation== | ||
| - | |||
| - | In order to access the specificity of the bisphenol A degradation by the bisdA | bisdB fusion protein we tested how well two similar bisphenols, bisphenol F (BPF) and bisphenol S (BPS), were | + | ===Specificity of bisphenol A degradation with ''E. coli''=== |
| + | In order to access the specificity of the bisphenol A degradation by the bisdA | bisdB fusion protein, we tested how well two similar bisphenols, bisphenol F (BPF) and bisphenol S (BPS), were utilized. The structure of those bisphenols differs only in the chemical group linking the two phenols from that of bisphenol A (see Figure 1). | ||
[[Image:Bielefeld_2011_Bisphenols.png|500px|center|thumb| '''Figure 1: Chemical structure of BPA, BPF and BPS showing the different chemical groups linking the two phenols.''']] | [[Image:Bielefeld_2011_Bisphenols.png|500px|center|thumb| '''Figure 1: Chemical structure of BPA, BPF and BPS showing the different chemical groups linking the two phenols.''']] | ||
| - | BPF and BPS are used in a broad range of applications that involve the use of polycarbonates or epoxy resins and thus can often be found were BPA is also present. Accordingly their presence is a potential disruptive factor that could lead to a false positive signal with our biosensor. This is especially true for BPS that in some cases is used as a substitute for BPA in baby bottles [http://www.nytimes.com/2011/04/18/business/global/18iht-rbog-plastic-18.html]. Studies concerning the environmental pollution with BPF ([http://www.sciencedirect.com/science/article/pii/S0043135401003670 Fromme ''et al.'' (2002)]) and the acute toxicity, mutagenicity and estrogenicity of BPF and BPS ([http://onlinelibrary.wiley.com/doi/10.1002/tox.10035/abstract Chen ''et al.'' (2001)] and [http://toxsci.oxfordjournals.org/content/84/2/249 Kitamura ''et al.'' (2005)]) indicate their potential harmfulness but further research is needed to fully | + | BPF and BPS are used in a broad range of applications that involve the use of polycarbonates or epoxy resins and thus can often be found were BPA is also present. Accordingly their presence is a potential disruptive factor that could lead to a false positive signal with our biosensor. This is especially true for BPS that in some cases is used as a substitute for BPA in baby bottles [http://www.nytimes.com/2011/04/18/business/global/18iht-rbog-plastic-18.html]. Studies concerning the environmental pollution with BPF ([http://www.sciencedirect.com/science/article/pii/S0043135401003670 Fromme ''et al.'' (2002)]) and the acute toxicity, mutagenicity and estrogenicity of BPF and BPS ([http://onlinelibrary.wiley.com/doi/10.1002/tox.10035/abstract Chen ''et al.'' (2001)] and [http://toxsci.oxfordjournals.org/content/84/2/249 Kitamura ''et al.'' (2005)]) indicate their potential harmfulness but further research is needed to fully assess their impact on human health. |
| - | ''E. coli'' KRX carrying genes for the bisdA | bisdB fusion protein behind the medium strong constitutive promoter <partinfo>J23110</partinfo> with RBS <partinfo>B0034</partinfo> was cultivated at 30 °C for 36 h with LB-Medium containing 120 mg L<sup>-1</sup> BPA, BPF respectively BPS. The BPF and BPS concentration | + | ''E. coli'' KRX carrying genes for the bisdA | bisdB fusion protein behind the medium strong constitutive promoter <partinfo>J23110</partinfo> with RBS <partinfo>B0034</partinfo> was cultivated at 30 °C for 36 h with LB-Medium containing 120 mg L<sup>-1</sup> BPA, BPF respectively BPS. The BPF and BPS concentration were determined by HPLC using the same method as with BPA. Figure 2 shows the degradation of the respective bisphenol after 24 h of cultivation in percent. |
| - | [[Image:Bielefeld_2011_517_BPA-BPF-BPS_Degradation_24h_2.png|500px|center|thumb| '''Figure 2: Degradation of BPA, BPF and BPS after 24 h cultivation with ''E.coli'' KRX carrying genes for the bisdA <html>|</html> bisdB fusion protein behind the medium strong constitutive promoter <partinfo>J23110</partinfo> with RBS <partinfo>B0034</partinfo>. [[Team:Bielefeld-Germany/Protocols/Downstream-processing#Expression_of_bisphenol_A_degrading_BioBricks_in_E._coli | Cultivations]] were carried out at different temperatures in LB + Amp + bisphenol medium (starting concentration 120 mg L-1 BPA, BPF or BPS respectively) for 24 h in 300 mL shaking flasks without baffles with silicon plugs. Samples were taken at the end of the cultivation. Two biological replicates were analyzed. While BPA is fully degraded only a small fraction of BPF (~7%) and BPS (~3%) was degraded.''']] | + | [[Image:Bielefeld_2011_517_BPA-BPF-BPS_Degradation_24h_2.png|500px|center|thumb| '''Figure 2: Degradation of BPA, BPF and BPS after 24 h cultivation with ''E.coli'' KRX carrying genes for the bisdA <html>|</html> bisdB fusion protein behind the medium strong constitutive promoter <partinfo>J23110</partinfo> with RBS <partinfo>B0034</partinfo>. [[Team:Bielefeld-Germany/Protocols/Downstream-processing#Expression_of_bisphenol_A_degrading_BioBricks_in_E._coli | Cultivations]] were carried out at different temperatures in LB + Amp + bisphenol medium (starting concentration 120 mg L<sup>-1</sup> BPA, BPF or BPS respectively) for 24 h in 300 mL shaking flasks without baffles with silicon plugs. Samples were taken at the end of the cultivation. Two biological replicates were analyzed. While BPA is fully degraded, only a small fraction of BPF (~7%) and BPS (~3%) was degraded.''']] |
The results of the experiment indicate that the bisdA | bisdB fusion protein has a '''high specificity for the degradation of BPA'''. In addition it is possible that the decrease in BPF and BPS concentration is due to internalization of those bisphenols or a endogenous enzyme of ''E. coli'' KRX and not the bisdA | bisdB fusion protein was responsible. It can be assumed that false positive signals because of BPF or BPS present in a sample are unlikely. | The results of the experiment indicate that the bisdA | bisdB fusion protein has a '''high specificity for the degradation of BPA'''. In addition it is possible that the decrease in BPF and BPS concentration is due to internalization of those bisphenols or a endogenous enzyme of ''E. coli'' KRX and not the bisdA | bisdB fusion protein was responsible. It can be assumed that false positive signals because of BPF or BPS present in a sample are unlikely. | ||
| + | |||
===BPA degradation with constructs containing FNR=== | ===BPA degradation with constructs containing FNR=== | ||
| + | Constructs containing FNR, BisdA and BisdB polycistronic (<partinfo>K525551</partinfo>), FNR and a fusion protein of BisdA and BisdB (<partinfo>K525582</partinfo>) and a fusion protein of FNR, BisdA and BisdB (<partinfo>K525560</partinfo>) were tested for their ability to degrade BPA. [[Team:Bielefeld-Germany/Protocols/Downstream-processing#Expression_of_bisphenol_A_degrading_BioBricks_in_E._coli | Cultivations]] were done using the same conditions as with previous constructs. The results are shown in Figure 3 below. | ||
| - | + | [[Image:Bielefeld_2011_552_562_582_BPA_Degradation_24h.png|500px|center|thumb| '''Figure 3: Degradation of BPA after 24 h cultivation with ''E.coli'' KRX carrying genes for FNR, BisdA and BisdB polycistronic <partinfo>K525551</partinfo>, FNR and a fusion protein of BisdA and BisdB <partinfo>K525582</partinfo> and a fusion protein of FNR, BisdA and BisdB <partinfo>K525560</partinfo> behind the medium strong constitutive promoter <partinfo>J23110</partinfo> with RBS <partinfo>B0034</partinfo>. [[Team:Bielefeld-Germany/Protocols/Downstream-processing#Expression_of_bisphenol_A_degrading_BioBricks_in_E._coli | Cultivations]] were carried out at 30 °C in LB + Amp + 120 mg L<sup>-1</sup> BPA for 24 h in 300 mL shaking flasks without baffles with silicon plugs. Samples were taken every 3 hours. Two to four biological replicates were analyzed. All constructs were able to degrade BPA, with the constructs containing fusion proteins outperforming the construct where all proteins were expressed polycistronic.''']] | |
| - | + | ||
| - | [[Image:Bielefeld_2011_552_562_582_BPA_Degradation_24h.png|500px|center|thumb| '''Figure 3: Degradation of BPA after 24 h cultivation with ''E.coli'' KRX carrying genes for FNR, BisdA and BisdB polycistronic <partinfo>K525551</partinfo>, FNR and a fusion protein of BisdA and BisdB <partinfo>K525582</partinfo> and a fusion protein of FNR, BisdA and BisdB <partinfo>K525560</partinfo> behind the medium strong constitutive promoter <partinfo>J23110</partinfo> with RBS <partinfo>B0034</partinfo>. [[Team:Bielefeld-Germany/Protocols/Downstream-processing#Expression_of_bisphenol_A_degrading_BioBricks_in_E._coli | Cultivations]] were carried out at 30 °C | + | |
The results indicate that the BPA degradation was improved using fusion proteins compared to the completely polycistronic construct. Also the '''fusion protein of all three enzymes''' (<partinfo>K525560</partinfo>) involved in the degradation of BPA worked as intended which is quite impressive. | The results indicate that the BPA degradation was improved using fusion proteins compared to the completely polycistronic construct. Also the '''fusion protein of all three enzymes''' (<partinfo>K525560</partinfo>) involved in the degradation of BPA worked as intended which is quite impressive. | ||
| - | === | + | ===Comparison of all constructs used for BPA degradation=== |
| - | + | ||
Figure 4 gives an overview of the constructs employed for the degradation of BPA. | Figure 4 gives an overview of the constructs employed for the degradation of BPA. | ||
| Line 35: | Line 35: | ||
All constructs were cultivated under the same conditions as described under [[Team:Bielefeld-Germany/Protocols/Downstream-processing#Expression_of_bisphenol_A_degrading_BioBricks_in_E._coli | Cultivations]]. BPA concentrations were measured using [[Team:Bielefeld-Germany/Protocols/Analytics#Bisphenol_A_analysis | HPLC]]. Figure 5 shows the percentage of BPA degraded in 24 h of cultivation and the specific BPA degradation rate calculated with the [[Team:Bielefeld-Germany/Modell#Regular_model | regular model]] and in the case of <partinfo>K525560</partinfo> with [[Team:Bielefeld-Germany/Modell#Model_for_the_fusion_protein_between_FNR.2C_BisdA_and_BisdB | the model for the fusion protein between FNR, BisdA and BisdB]]. | All constructs were cultivated under the same conditions as described under [[Team:Bielefeld-Germany/Protocols/Downstream-processing#Expression_of_bisphenol_A_degrading_BioBricks_in_E._coli | Cultivations]]. BPA concentrations were measured using [[Team:Bielefeld-Germany/Protocols/Analytics#Bisphenol_A_analysis | HPLC]]. Figure 5 shows the percentage of BPA degraded in 24 h of cultivation and the specific BPA degradation rate calculated with the [[Team:Bielefeld-Germany/Modell#Regular_model | regular model]] and in the case of <partinfo>K525560</partinfo> with [[Team:Bielefeld-Germany/Modell#Model_for_the_fusion_protein_between_FNR.2C_BisdA_and_BisdB | the model for the fusion protein between FNR, BisdA and BisdB]]. | ||
| - | [[Image:Vergleich_aller_Konstrukte.png|700px|center|thumb| '''Figure 5: Results of the BPA degradation experiments with [http://partsregistry.org/wiki/index.php/Part:BBa_K525512 BBa_K525511], <partinfo>K525515</partinfo>, <partinfo>K525551</partinfo>, [http://partsregistry.org/wiki/index.php/Part:BBa_K525582 BBa_K525580] and <partinfo>K525560</partinfo> and the corresponding specific BPA degradation rates calculated with the model. The construct consisting only of BisdA shows almost no degradation activity, which was expected since BisdA alone can't facilitate the degradation of BPA. In comparsion the fusion protein of BisdA and BisdB degraded BPA considerbly more efficent than the polycistronic construct, indicating that the fusing of the two proteins improved its activity. Regarding the constructs containing FNR the completely polycistronic construct lags distinctively behind the other two constructs. Again, the fusing of the BisdA and BisdB proteins improved the BPA degradation activity. Using the fusion protein between FNR, BisdA and BisdB we measured the highest specific BPA degradation rate of all constructs. | + | [[Image:Vergleich_aller_Konstrukte.png|700px|center|thumb| '''Figure 5: Results of the BPA degradation experiments with [http://partsregistry.org/wiki/index.php/Part:BBa_K525512 BBa_K525511], <partinfo>K525515</partinfo>, <partinfo>K525551</partinfo>, [http://partsregistry.org/wiki/index.php/Part:BBa_K525582 BBa_K525580] and <partinfo>K525560</partinfo> and the corresponding specific BPA degradation rates calculated with the model. The construct consisting only of BisdA shows almost no degradation activity, which was expected since BisdA alone can't facilitate the degradation of BPA. In comparsion the fusion protein of BisdA and BisdB degraded BPA considerbly more efficent than the polycistronic construct, indicating that the fusing of the two proteins improved its activity. Regarding the constructs containing FNR the completely polycistronic construct lags distinctively behind the other two constructs. Again, the fusing of the BisdA and BisdB proteins improved the BPA degradation activity. Using the fusion protein between FNR, BisdA and BisdB we measured the highest specific BPA degradation rate of all constructs. Although it has to be taken into account that a different model had to be used for this particular construct. |
''']] | ''']] | ||
| - | We are especially impressed that the '''fusion protein of FNR, BisdA and BisdB''' (<partinfo>K525560</partinfo>) not only was '''capable to degrade BPA''' but also was '''the fastest construct''' we employed. This also contributes to the feasibility of our approach for a cell free BPA biosensor since in a cell free | + | We are especially impressed that the '''fusion protein of FNR, BisdA and BisdB''' (<partinfo>K525560</partinfo>) not only was '''capable to degrade BPA''' but also was '''the fastest construct''' we employed. This also contributes to the feasibility of our approach for a cell free BPA biosensor since in a cell free environment fusion proteins are beneficial when compared to their non-fused counter parts. |
===Model for the fusion protein between FNR, BisdA and BisdB=== | ===Model for the fusion protein between FNR, BisdA and BisdB=== | ||
| - | + | The cultivations and BPA degradation of ''E. coli'' KRX carrying a fusion protein consisting of ferredoxin-NADP<sup>+</sup> oxidoreductase, ferredoxin<sub>bisd</sub> and cytochrome P450<sub>bisd</sub> differ from the cultivations with the other BPA degrading BioBricks. Thus, the model for these cultivations has to be adjusted to this behaviour. First of all, no diauxic growth is observed so the growth can be modeled more easily like | |
| - | The cultivations and BPA degradation of ''E. coli'' KRX carrying a fusion protein consisting of ferredoxin-NADP<sup>+</sup> oxidoreductase, ferredoxin<sub>bisd</sub> and cytochrome P450<sub>bisd</sub> differ from the cultivations with the other BPA degrading BioBricks. Thus, the model for these cultivations has to be adjusted to this behaviour. First of all, no diauxic growth is observed so the growth can be | + | |
| Line 48: | Line 47: | ||
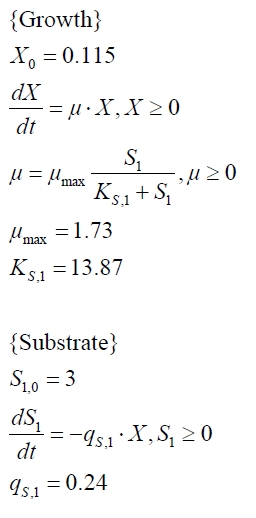
| - | The BPA degradation starts when the imaginary substrate is depleted, like observed in the other cultivations with BPA degrading BioBricks. But it seems that the BPA degradation is getting slower with longer cultivation time. So it is | + | The BPA degradation starts when the imaginary substrate is depleted, like observed in the other cultivations with BPA degrading BioBricks. But it seems that the BPA degradation is getting slower with longer cultivation time. So it is modeled with a Monod-like term in which the specific BPA degradation rate is dependent on the BPA concentration: |
| - | [[Image:IGEM-Bielefeld2011-BPAdegradcomp.jpg|center| | + | [[Image:IGEM-Bielefeld2011-BPAdegradcomp.jpg|center|270px]] <div align="right">(7)</div> |
with the maximal specific BPA degradation rate q<sub>D,max</sub> and the constant K<sub>D</sub>. | with the maximal specific BPA degradation rate q<sub>D,max</sub> and the constant K<sub>D</sub>. | ||
| - | Figures | + | Figures 6-10 show a comparison between modeled and measured data for cultivations with BPA degrading fusion protein ''E. coli''. In Table 1 the parameters for the model are given, obtained by curve fitting the model to the data. |
| + | ===Comparison between modeled and measured data=== | ||
| + | [[Image:IGEM-Bielefeld2011-Modell_K525512.png|left|430px|thumb|'''Figure 6: Comparison between modeled (lines) and measured (dots) data for [[Team:Bielefeld-Germany/Protocols/Downstream-processing#Expression_of_bisphenol_A_degrading_BioBricks_in_E._coli | cultivations]] of ''E. coli'' KRX carrying BPA degrading BioBrick <partinfo>K525512</partinfo>. The BioBrick <partinfo>K525512</partinfo> (polycistronic ''bisdAB'' genes behind medium strong promoter) was cultivated seven times in ''E. coli'' KRX in LB + Amp + BPA medium at 30 °C, using 300 mL shaking flasks without baffles with silicon plugs. The BPA concentration (closed dots) and the cell density (open dots) is plotted against the cultivation time. ''']] | ||
| - | + | [[Image:IGEM-Bielefeld2011-ModellK525517.png|left|430px|thumb|'''Figure 7: Comparison between modeled (lines) and measured (dots) data for [[Team:Bielefeld-Germany/Protocols/Downstream-processing#Expression_of_bisphenol_A_degrading_BioBricks_in_E._coli | cultivations]] of ''E. coli'' KRX carrying BPA degrading BioBrick <partinfo>K525517</partinfo>. The BioBrick <partinfo>K525517</partinfo> (fusion protein between BisdA and BisdB behind medium strong promoter) was cultivated five times in ''E. coli'' KRX in LB + Amp + BPA medium at 30 °C, using 300 mL shaking flasks without baffles with silicon plugs. The BPA concentration (closed dots) and the cell density (open dots) is plotted against the cultivation time. ''']] | |
| - | + | ||
| - | + | ||
| - | + | ||
| - | [[Image:IGEM-Bielefeld2011-ModellK525517.png|left|430px|thumb|'''Figure | + | |
<br style="clear: both" /> | <br style="clear: both" /> | ||
| - | [[Image:IGEM-Bielefeld2011-ModellK525552.png|left|430px|thumb|'''Figure | + | [[Image:IGEM-Bielefeld2011-ModellK525552.png|left|430px|thumb|'''Figure 8: Comparison between modeled (lines) and measured (dots) data for [[Team:Bielefeld-Germany/Protocols/Downstream-processing#Expression_of_bisphenol_A_degrading_BioBricks_in_E._coli | cultivations]] of ''E. coli'' KRX carrying BPA degrading BioBrick <partinfo>K525552</partinfo>. The BioBrick <partinfo>K525552</partinfo> (polycistronic ''fnr'' : ''bisdA'' : ''bisdB'' genes behind medium strong promoter) was cultivated four times in ''E. coli'' KRX in LB + Amp + BPA medium at 30 °C, using 300 mL shaking flasks without baffles with silicon plugs. The BPA concentration (closed dots) and the cell density (open dots) is plotted against the cultivation time. ''']] |
| - | [[Image:IGEM-Bielefeld2011-ModellK525582.png|left|430px|thumb|'''Figure | + | [[Image:IGEM-Bielefeld2011-ModellK525582.png|left|430px|thumb|'''Figure 9: Comparison between modeled (lines) and measured (dots) data for [[Team:Bielefeld-Germany/Protocols/Downstream-processing#Expression_of_bisphenol_A_degrading_BioBricks_in_E._coli | cultivations]] of ''E. coli'' KRX carrying BPA degrading BioBrick <partinfo>K525582</partinfo>. The BioBrick <partinfo>K525582</partinfo> (polycistronic ''fnr'' : BisdAB (fusion protein) genes behind medium strong promoter) was cultivated four times in ''E. coli'' KRX in LB + Amp + BPA medium at 30 °C, using 300 mL shaking flasks without baffles with silicon plugs. The BPA concentration (closed dots) and the cell density (open dots) is plotted against the cultivation time. ''']] |
<br style="clear: both" /> | <br style="clear: both" /> | ||
| - | [[Image:IGEM-Bielefeld2011-ModellK525562.png|center|430px|thumb|'''Figure | + | [[Image:IGEM-Bielefeld2011-ModellK525562.png|center|430px|thumb|'''Figure 10: Comparison between modeled (lines) and measured (dots) data for [[Team:Bielefeld-Germany/Protocols/Downstream-processing#Expression_of_bisphenol_A_degrading_BioBricks_in_E._coli | cultivations]] of ''E. coli'' KRX carrying BPA degrading BioBrick <partinfo>K525562</partinfo>. The BioBrick <partinfo>K525562</partinfo> (fusion protein between FNR, BisdA and BisdB behind medium strong promoter) was cultivated four times in ''E. coli'' KRX in LB + Amp + BPA medium at 30 °C, using 300 mL shaking flasks without baffles with silicon plugs. The BPA concentration (closed dots) and the cell density (open dots) is plotted against the cultivation time. ''']] |
<br style="clear: both" /> | <br style="clear: both" /> | ||
| Line 79: | Line 76: | ||
<center> | <center> | ||
| - | ''' | + | '''Table 1: Parameters of the model. ''' |
{| cellpadding="10" style="border-collapse: collapse; border-width: 1px; border-style: solid; border-color: #000" | {| cellpadding="10" style="border-collapse: collapse; border-width: 1px; border-style: solid; border-color: #000" | ||
|- | |- | ||
| Line 177: | Line 174: | ||
</center> | </center> | ||
| + | The specific BPA degradation rate per cell q<sub>D</sub> is about 50 % higher when using the fusion protein compared to the polycistronic ''bisdAB'' gene. On average, this results in a 9 hours faster, complete BPA degradation by ''E. coli'' carrying <partinfo>K525517</partinfo> compared to <partinfo>K525512</partinfo> as observed during [[Team:Bielefeld-Germany/Results#Bisphenol_A_degradation_with_E._coli | our cultivations]]. The fusion protein between BisdA and BisdB improves the BPA degradation by ''E. coli''. Introducing a polycistronic ferredoxin-NADP<sup>+</sup> reductase gene into these systems does not lead to a higher specific BPA degradation rate. The rates are a bit lower, though. The effect that the BisdA | BisdB fusion protein is more efficient than BisdB when expressed polycistronically with BisdA can still be observed in this setup. The cultivations with the expression of the fusion protein FNR | BisdA | BisdB differ from the expression of the other BPA degrading BioBricks. The BPA degradation rate is concentration dependent which is typical for enzymatic reactions but was not observed in the other cultivations. In addition, the growth was faster and not diauxic. The maximal specific BPA degradation rate of this BioBrick is higher than the observed specific BPA degradation rates in the other cultivations. But due to the dependence of the BPA degradation from the BPA concentration the BPA degradation with this BioBrick is not as efficient and not complete. Anyway, the fact that this BioBrick is working, is impressive. | ||
| + | ==S-layer== | ||
| - | The | + | ===Purification=== |
| + | The purification strategy could be accelerated by using a His-6-affinity tag and is more simple and pure now. | ||
| - | + | Scheme of purification strategy for SgsE (fusion) proteins with His-tag: | |
| - | === | + | |
| - | === | + | [[Image:IGEM-Bielefeld2011-322_Aufreinigung_symbol.png|800px|center]] |
| - | === | + | |
| + | By fusing the SgsE | mCitrine with a C-terminal [http://partsregistry.org/Part:BBa_K157011 His-6-tag] the S-layer protein could be simply purified by using a denaturating His-tag affinity chromatography. This purification strategy has the advantage that no time-consuming and complex inclusion body purification and filtration is necessary to decrease the amount of native ''E. coli'' proteins. Additional to the simplification, a higher purity of the S-layer protein could be reached. | ||
| + | |||
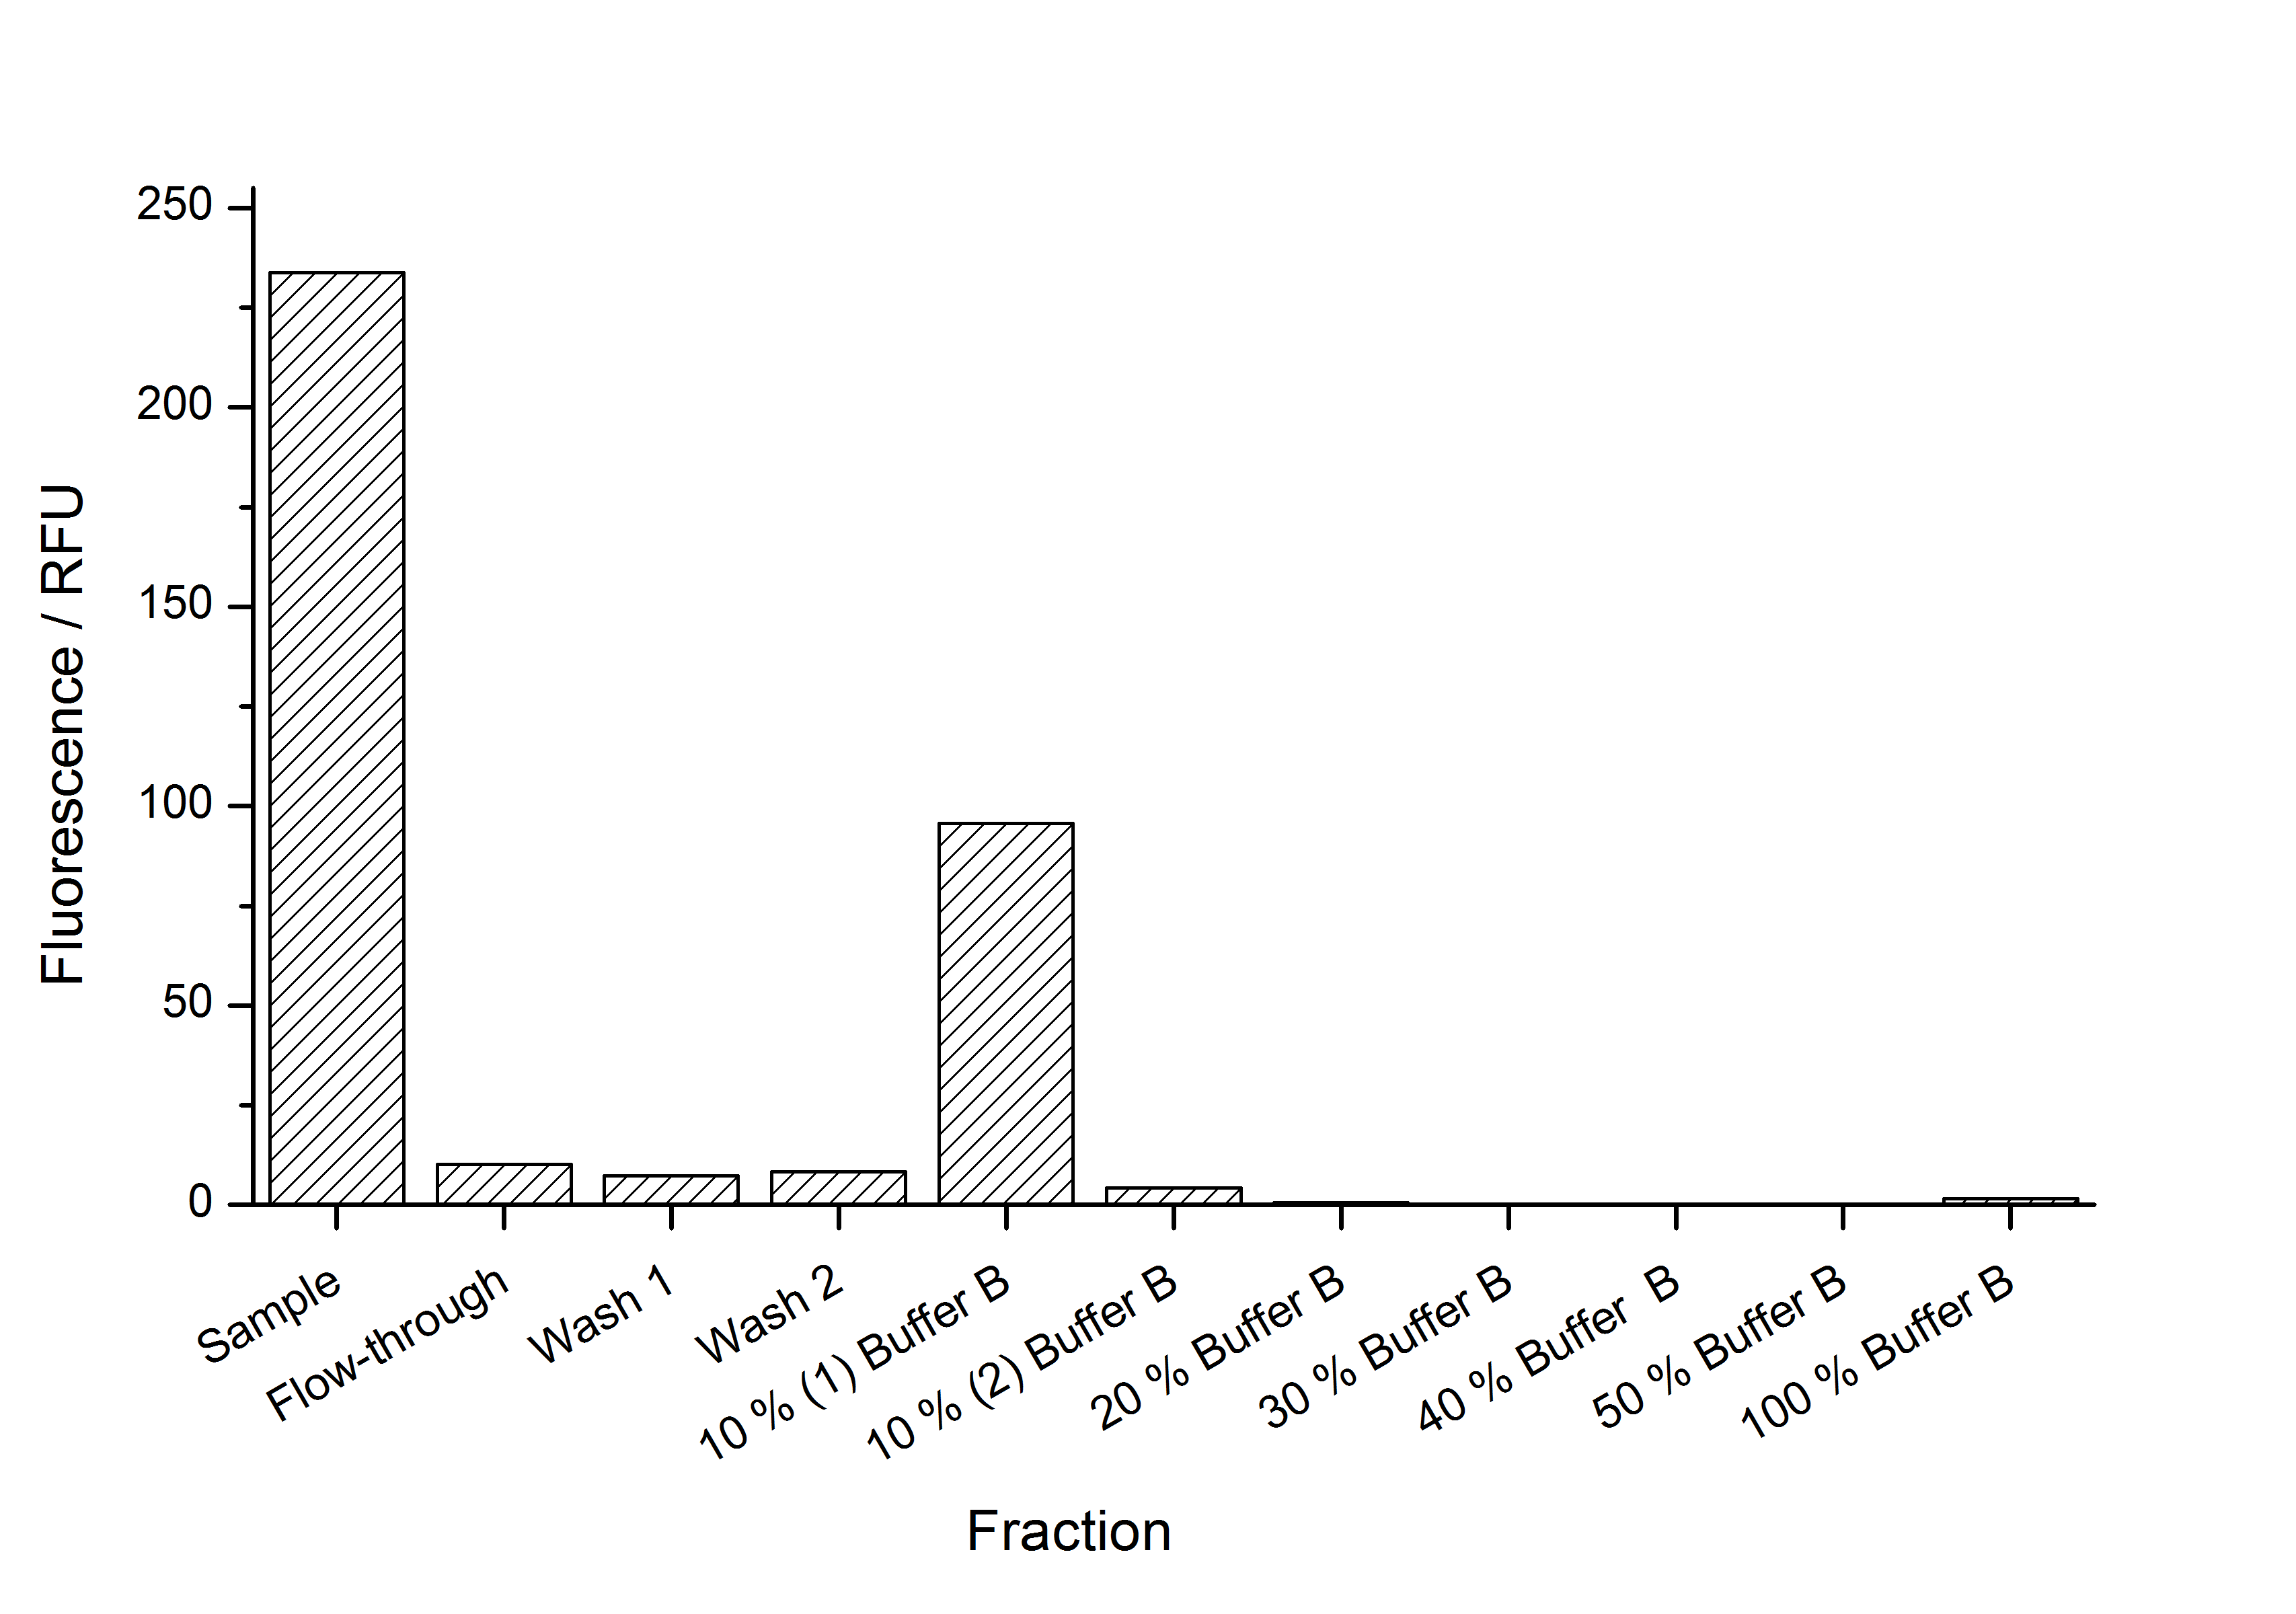
| + | This purification was made using the SgsE fusion protein containing an N-terminal mCitrine for identification and a C-terminal His-6-tag. The SDS-PAGE gel (Figure 11) and the fluorescence (Figure 12) in the collected fractions showed that the majority of fusion protein was eluated with a imidazole concentration of ca. 50 mM. There was also fluorescence measurable in the flowthrough and wash fractions. This indicates that the used 1 mL ''HisTrap FF crude'' (GE Healthcare) was overloaded or the protein was bound only weakly to the affinity matrix. The resulting purity in the elution fraction, the saving of time and the easiness makes this procedure to the preferred purification method. | ||
| + | |||
| + | [[Image:Bielefeld_Germany_322_Histrap.png|700px|thumb|centre|'''Figure 11: SDS-PAGE gel of a denaturating immobilized metal affinity chromatography (IMAC) of a SgsE fusion protein containing an N-terminal mCitrine and a C-terminal His-6-tag. A 1 mL ''HisTrap FF crude'' by GE Healthcare (Ni-NTA) was used for purification. The binding buffer contained 10 mM imidazole and the elution buffer (buffer B) 500 mM imidazole. The bound proteins were eluated by a stepwise increasing imidazole gradient (10 % buffer B per step). The SgsE fusion protein (111,2 kDa) was eluated in the 10 % buffer B fraction in a high purity.''']] | ||
| + | |||
| + | |||
| + | [[Image:Bielefeld_Germany_322_fluoreszence.png|700px|thumb|centre|'''Figure 12: Fluorescence in the fractions of a denaturating immobilized metal affinity chromatography (IMAC) of a SgsE fusion protein containing an N-terminal mCitrine and a C-terminal His-6-tag. A 1 mL HisTrap FF crude by GE Healthcare (Ni-NTA) was used for purification. The binding buffer contained 10 mM imidazole and the elution buffer (buffer B) 500 mM imidazole. The bound proteins were eluated by a stepwise rising imidazole gradient (10 % buffer B per step). The SgsE fusion protein (111,2 kDa) was eluated in the 10 % buffer B fraction in a high purity.''']] | ||
| + | |||
| + | Because the method is so quick and easy now we developed a [[Team:Bielefeld-Germany/Results/S-Layer/Guide | guide to do it yourself nanobiotechnology]] in which the method is presented in a vivid way. | ||
| + | |||
| + | |||
| + | Sometimes, the inclusion body purification does not give very clean fractions. Therefore, we developed another purification strategy for <partinfo>K525405</partinfo> monomers after inclusion body purification. This strategy consists of a capture with an IEX followed by a purification with HIC. Because of issues with the PES membranes we used to rebuffer our samples (see below - PES binds most of the S-layers) we lost a lot of our proteins in this step between the two chromatographies. So there was not enough protein left to colour it with Coomassie in an SDS-PAGE and time ran out to perform a silver staining. The fluorescence of the collected fractions of the chromatographies is shown in the figures below. | ||
| + | |||
| + | [[Image:Bielefeld_Germany-405IEX.png|700px|thumb|centre|'''Figure 13: Fluorescence in the fractions of an anion exchange chromatography (IEX) with monomeric SbpA <html>|</html> mCitrine solution. A 1 mL HighTrap DEAE sepharose column by GE Healthcare was used for purification. The binding buffer (buffer A) contained 25 mM sodium chloride and the elution buffer (buffer B) 1 M sodium chloride (both 25 mM acetate buffer, pH 6.0). Abbreviations: FT = flow through, W = wash, E = elution. ''']] | ||
| + | |||
| + | [[Image:Bielefeld_Germany-405HIC.png|700px|thumb|centre|'''Figure 14: Fluorescence in the fractions of a hydrophobic interaction chromatography (HIC) with monomeric SbpA <html>|</html> mCitrine solution eluted from an IEX (see above). A 1 mL HighTrap butyl sepharose column by GE Healthcare was used for purification. The binding buffer (buffer A) contained 1200 mM ammonium sulfate and the elution buffer (buffer B) no ammonium sulfate (both 50 mM ammonium phosphate buffer, pH 7.0). Abbreviations: FT = flow through, E = elution. ''']] | ||
| + | |||
| + | ===Enzyme reaction fused to S-layer protein=== | ||
| + | To test an exemplary enzymatic reaction fused to an S-layer protein SgsE | luciferase was assembled and expressed. The fusion protein shows high luciferase activity inside the cells but unfortunately the purification and stability at room temperature has some issues which have to be solved in future applications. | ||
| + | |||
| + | |||
| + | ====Expression in ''E. coli''==== | ||
| + | For characterization experiments the SgsE gene under the control of a T7 / ''lac'' promoter (<partinfo>K525303</partinfo>) was fused to firefly luciferase (<partinfo>K525999</partinfo>) using Freiburg BioBrick assembly. | ||
| + | |||
| + | The SgsE | luciferase fusion protein was overexpressed in ''E. coli'' KRX after induction of T7 polymerase with 0.2 % L-rhamnose and induction of lac operator with 1 mM IPTG. | ||
| + | |||
| + | The following cultivation was carried out in a [http://www.gmi-inc.com/BioEngineering-KLF-Small-Laboratory-Fermenter.html#product_desc Bioengineering KLF] bioreactor with Bioengineering DCU and software. A sequencer which automatically pumped an inducer solution after 4 h cultivation time to start protein expression was implemented. Other parameters were: | ||
| + | |||
| + | * Medium: [https://2011.igem.org/Team:Bielefeld-Germany/Protocols/Materials#HSG_medium HSG medium] with 20 mg L<sup>-1</sup> chloramphenicol | ||
| + | * Culture volume: 2.5 L | ||
| + | * Starting OD<sub>600</sub>: 0.4 | ||
| + | * DO: 60 % air saturation (controlled with stirrer cascade starting with 200 rpm) | ||
| + | * pH: 7.0 (controlled with 20 % phosphoric acid and 2 M NaOH) | ||
| + | * Antifoam: BASF pluronic PE-8100 | ||
| + | * Induction solution: 0.2 % L-rhamnose and 1 mM IPTG | ||
| + | |||
| + | |||
| + | The following figure shows the expression of the SgsE | luciferase S-layer fusion protein (<partinfo>K525311</partinfo>) in ''E. coli'' KRX in HSG medium with autoinduction sequencer as described above. Optical density, activity of the fused luciferase, dissolved oxygen and agitator speed are plotted against the cultivation time. | ||
| + | |||
| + | [[Image:IGEM-Bielefeld2011-Cultivation311.jpg|750px|thumb|center|'''Figure 15: Bioreactor cultivation of ''E. coli'' KRX expressing the fusion protein SgsE :: luciferase <partinfo>K525311</partinfo> under the control of a T7 / ''lac'' promoter. Induction with 1 mM IPTG and 0.2 % L-rhamnose after 4 h controlled by sequencer. Cultivation in [http://www.gmi-inc.com/BioEngineering-KLF-Small-Laboratory-Fermenter.html#product_desc Bioengineering KLF] bioreactor with 2.5 L [https://2011.igem.org/Team:Bielefeld-Germany/Protocols/Materials#HSG_medium HSG medium] with 20 mg L<sup>-1</sup> chloramphenicol starting with OD<sub>600</sub> = 0.4. Dissolved oxygen was regulated to 60 % air saturation (controlled with stirrer cascade starting with 200 rpm) and the pH to 7.0 (controlled with 20 % phosphoric acid and 2 M NaOH). The dissolved oxygen sensor had to be recalibrated after about 140 min. ''']] | ||
| + | |||
| + | ====Purification==== | ||
| + | After the analysis of cultivations with expression of SgsE | luciferase fusion proteins, different cell fractions were analyzed. It could be seen that the proteins form inclusion bodies in ''E. coli'' but that there are some soluble proteins left. This has the advantage that the proteins carrying an enzyme as fusion protein do not have to be treated with denaturating agents like urea which destroys the enzyme (data not shown). | ||
| + | |||
| + | To capture the protein from the cell lysate an ion exchange chromatography (IEX) was carried out (binding with pH 7.0, 25 mM NaCl, quaternary amine beads, elution with 100 mM NaCl). A lot of protein was found in the flow-through. When concentrating and rebuffering the proteins with PES (polyethylene sulfone) membranes a lot of protein was lost. The S-layer proteins stuck to the membrane. Some could be removed again from the membrane after cutting out the filter and incubate it in ddH<sub>2</sub>O over-night. This problem has to be kept in mind when using this S-layer. | ||
| + | |||
| + | The results of the purification approach are shown in Figure 16: | ||
| + | |||
| + | [[Image:IGEM-Bielefeld2011-311purification.png|500px|thumb|center|'''Figure 16: Luminescence corrected with the volume of the collected fraction plotted against the fraction during purification of <partinfo>K525311</partinfo>. Abbreviations: s.n. = supernatant, F = filtrate, R = retentate, FT = flow through, E10 = elution with 100 mM NaCl.''']] | ||
| + | |||
| + | The purification strategy has to be improved. The inclusion bodies cannot be purified because urea damages the luciferase irreversible (data not shown). The loss due to adsorption of the SgsE | luciferase fusion protein to PES membranes could be avoided by using different membranes. The binding conditions of the IEX have to be improved as well. Anyway, the idea behind this purification strategy could be a starting point for a better strategy. Possibilities for improvement are: | ||
| + | * Different membranes for ultra- / diafiltration | ||
| + | * Other binding conditions for the IEX capturing step (higher pH) | ||
| + | * Hydrophobic interaction chromatography as purification step after IEX (works in general, data not shown) | ||
| + | * Size exclusion chromatography (SEC) for polishing | ||
| + | |||
| + | ====Stability==== | ||
| + | To test whether the S-layer protein enhances the half-life of the firefly luciferase, immobilization experiments were carried out. After the IEX described above, the elution fraction was immobilized on silicon dioxide beads or just diluted with HBSS buffer which is used for the immobilization / recrystallization of SgsE S-layer proteins. The immobilization is carried out at room temperature for 4 h. It could be seen that the luciferase activity nearly expired during this time (in the positive and the negative control). So the S-layer SgsE could not stabilize the luciferase at room temperature. The results of this experiment is shown in Figure 17: | ||
| + | |||
| + | [[Image:IGEM-Bielefeld2011-311immobilization.png|500px|thumb|center|'''Figure 17: Results of immobilization experiments with <partinfo>K525311</partinfo>. The stability of the luciferase activity at room temperature is decreasing quickly.''']] | ||
==NAD<sup>+</sup> detection== | ==NAD<sup>+</sup> detection== | ||
===Identification of LigA=== | ===Identification of LigA=== | ||
| - | [[Image:Bielefeld-Germany-2011 LigA-purification_MALDI.png|600px|thumb|centre| '''Figure | + | The gel bands of SDS-PAGE for His-tag purified LigA were analysed by MALDI-TOF MS and the comparison with the Swiss-Prot database clearly identified the purified protein as LigA (Figure 18, Table 2). As it is reported in literature the majority of LigA usually occurs in its adenylated form after extraction from ''E. coli''. An indication for this is the double band on the right edge of Figure 18. The proteins in both gel bands were identified as LigA from ''E. coli'' suggesting that gel band 3 is the adenylated form and gel band 4 is the deadenylated form. |
| + | |||
| + | [[Image:Bielefeld-Germany-2011 LigA-purification_MALDI.png|600px|thumb|centre| '''Figure 18: SDS-PAGE analysis of LigA after His-tag purification as a preparation for MALDI-TOF MS analysis. The cleared lysate from <partinfo>BBa_K525710</partinfo> overexpressing ''E. coli'' KRX cells was loaded on a HisTrap™ FF crude column (1 mL), the protein was eluted with 100 mM imidazole and collected in 1 mL fractions. The framed and numbered fields indicate the gel bands which were analysed by MALDI-TOF MS. M: [http://www.fermentas.de/admin/images/media/labaid_pageruler_L7P.pdf prestained protein marker].''']] | ||
<br style="clear: both" /> | <br style="clear: both" /> | ||
| - | '''Table 2: Identification of LigA by MALDI-TOF MS. | + | '''Table 2: Identification of LigA by MALDI-TOF MS. The values correspond to the framed and numbered gel bands in Figure 18. The threshold for significance of the Mascot Score for MS is 63 and the one for MS/MS is 26. The MS-Coverage represents the sequence coverage of the investigated protein with the corresponding entry in the ''E. coli'' Swiss-Prot data base. The Sequence-Coverage shows the percentage of similarity to the translated BioBrick <partinfo>BBa_K525710</partinfo> (translation was perfomed with the [http://web.expasy.org/translate/ ExPASy Translate] tool).''' |
<center> | <center> | ||
{|cellspacing=0, spacepadding=0, border=1} | {|cellspacing=0, spacepadding=0, border=1} | ||
!Number | !Number | ||
!Method | !Method | ||
| - | ! | + | !Swiss-Prot<br> number |
!Protein | !Protein | ||
!Protein <br> Mascot <br> Score | !Protein <br> Mascot <br> Score | ||
| Line 287: | Line 350: | ||
|} | |} | ||
</center> | </center> | ||
| + | |||
===Limit of detection=== | ===Limit of detection=== | ||
| + | To determine the limit of detection of the NAD<sup>+</sup> bioassay the NAD<sup>+</sup> concentrations were decreased until the fluorescence enhancement was no longer distinguishable from added H<sub>2</sub>O. This was the case as soon as the NAD<sup>+</sup> concentration came below 2 nM. Deductively, the limit of detection of the molecular beacon based and LigA associated NAD<sup>+</sup> bioassay was set at 2 nM NAD<sup>+</sup>. Furthermore, this confirmed the linear dependence between the initial velocity and the NAD<sup>+</sup> concentration (Figure 19). | ||
| + | |||
| + | [[Image:Bielefeld-Germany-2011 NAD+ calibrationcurve.png|650px|thumb|centre| '''Figure 19: Initial velocity calibration curve for NAD<sup>+</sup>. The initial velocity, calculated from the average fluorescence enhancement rate in 200 s after NAD<sup>+</sup> addition, is plotted versus the employed NAD<sup>+</sup> concentration. Data is fitted with linear regression for NAD<sup>+</sup> concentrations ranging from 0 to 200 nM (R² = 0.991, n = 4).''']] | ||
| - | |||
===Selectivity test=== | ===Selectivity test=== | ||
| - | The specifity of LigA for its substrate NAD<sup>+</sup> is important in order to couple the NAD<sup>+</sup> detection with investigated processes including NADH-dependent enzyme reactions. The verification of the selectivity is an important matter to exclude any unspecific reactions which might result in a NAD<sup>+</sup>-independent fluorescence enhancement. Hence, a selectivity test for LigA was performed with the analytes NADH, NADP<sup>+</sup>, NADPH, 3-ADAP (NAD<sup>+</sup> with an exchanged functional group at the nicotinamide ring system), ATP and ADP, and the relative fluorescence enhancement rates in a NAD<sup>+</sup> bioassay were compared with the one for NAD<sup>+</sup> ( | + | The specifity of LigA for its substrate NAD<sup>+</sup> is important in order to couple the NAD<sup>+</sup> detection with investigated processes including NADH-dependent enzyme reactions. The verification of the selectivity is an important matter to exclude any unspecific reactions which might result in a NAD<sup>+</sup>-independent fluorescence enhancement. Hence, a selectivity test for LigA was performed with the analytes NADH, NADP<sup>+</sup>, NADPH, 3-ADAP (NAD<sup>+</sup> with an exchanged functional group at the nicotinamide ring system), ATP and ADP, and the relative fluorescence enhancement rates in a NAD<sup>+</sup> bioassay were compared with the one for NAD<sup>+</sup> (Figure 20). |
| - | [[Image:Bielefeld-Germany-2011_Selectivity-of-LigA.png|650px|thumb|centre| '''Figure | + | [[Image:Bielefeld-Germany-2011_Selectivity-of-LigA.png|650px|thumb|centre| '''Figure 20: LigA shows high selectivity for NAD<sup>+</sup>. The final concentration of all analytes was 100 nM. The responses were evaluated on the basis of the average fluorescence enhancement rate in a range of 200 s after addition of each analyte into the NAD<sup>+</sup> bioassay. The dotted line marks the threshold indicating the intensity of background signal. All data are normalized to the NAD<sup>+</sup> value (n = 2).''']] |
| Line 302: | Line 368: | ||
===Coupled enzyme reaction=== | ===Coupled enzyme reaction=== | ||
| - | The coupling of the LigA-including NAD<sup>+</sup> detection system was performed with a NADH-dependent enzymatic reaction which was in concrete the conversion of pyruvate to L-lactate by lactic acid dehydrogenase (LDH) from ''E. coli''. For this the LDH reaction was done with an excess of NADH and various pyruvate concentrations. Afterwards, the reaction mix was transferred to a NAD<sup>+</sup> bioassay and the fluorescence intensity was monitored. In | + | The coupling of the LigA-including NAD<sup>+</sup> detection system was performed with a NADH-dependent enzymatic reaction which was in concrete the conversion of pyruvate to L-lactate by lactic acid dehydrogenase (LDH) from ''E. coli''. For this the LDH reaction was done with an excess of NADH and various pyruvate concentrations. Afterwards, the reaction mix was transferred to a NAD<sup>+</sup> bioassay and the fluorescence intensity was monitored. In Figure 21 the normalized initial fluorescence enhancement rates for the employed pyruvate concentrations are indicated. The calculated initial velocity was then plotted against the pyruvate concentration (Figure 22). |
| - | [[Image:Bielefeld-Germany-2011_Fluorescence-enhancement-after addition-of-LDH-reaction-mix.png|650px|thumb|centre| '''Figure | + | [[Image:Bielefeld-Germany-2011_Fluorescence-enhancement-after addition-of-LDH-reaction-mix.png|650px|thumb|centre| '''Figure 21: Fluorescence enhancement rate after addition of LDH reaction mix with various pyruvate concentrations into a LigA-dependent NAD<sup>+</sup> bioassay. 50 ng/µL LDH was preincubated with 100 µM NADH and different pyruvate concentrations for 2 min at 37 °C. 1 µL of the LDH reaction mix was then added to a NAD<sup>+</sup> bioassay, composed of a nicked DNA substrate (250 nM molecular beacon hybridized to a split target) and 6.5 ng/µL LigA, and the fluorescence intensity was monitored. For illustration the fluorescence intensity is normalized for each measurement series to the first measured fluorescence value after LDH reaction mix addition (n = 4).''']] |
| - | [[Image:Bielefeld-Germany-2011_Pyruvate-calibration-curve.png|650px|thumb|centre| '''Figure | + | [[Image:Bielefeld-Germany-2011_Pyruvate-calibration-curve.png|650px|thumb|centre| '''Figure 22: Initial velocity calibration curve for pyruvate. The initial velocity, calculated from the average fluorescence enhancement rate in 100 s after LDH reaction mix addition into a LigA-dependent NAD<sup>+</sup> bioassay, is plotted versus the employed pyruvate concentration. Data is fitted with linear regression for pyruvate concentrations ranging from 0 to 10 µM (R² = 0.951, n = 4).''']] |
| Line 313: | Line 379: | ||
===Molecular cloning=== | ===Molecular cloning=== | ||
| - | Because DNA ligase from ''E. coli'' is commercially aquirable for cloning purposes LigA (<partinfo>BBa_K525710</partinfo>) was tested whether it is also suitable for molecular cloning procedures. Hence, cloning of ''rfp'' into a pSB1C3 vector was performed with LigA. Ligation was done with NAD<sup>+</sup> bioassay buffer containing 10 mM NAD<sup>+</sup> at 37 °C or 22 °C and the vectors were transformed into ''E. coli'' KRX by electroporation. After growth over night at 37 °C on petri dishes the results were documented ( | + | Because DNA ligase from ''E. coli'' is commercially aquirable for cloning purposes LigA (<partinfo>BBa_K525710</partinfo>) was tested whether it is also suitable for molecular cloning procedures. Hence, cloning of ''rfp'' into a pSB1C3 vector was performed with LigA. Ligation was done with NAD<sup>+</sup> bioassay buffer containing 10 mM NAD<sup>+</sup> at 37 °C or 22 °C and the vectors were transformed into ''E. coli'' KRX by electroporation. After growth over night at 37 °C on petri dishes the results were documented (Figure 23). |
| - | [[Image:Bielefeld-Germany-2011_LigAmolecularcloning-control.JPG|700px|thumb|centre| '''Figure | + | [[Image:Bielefeld-Germany-2011_LigAmolecularcloning-control.JPG|700px|thumb|centre| '''Figure 23: ''rfp'' cloning without any ligase (A) or with ligation by DNA ligase from ''E. coli'' (LigA) at 37 °C (B) and 22 °C (C). The picture shows the grown colonies after transformation of a control sample (''rfp'' and cut pSB1C3) or ligation sample (''rfp'' and cut pSB1C3 with LigA) into ''E. coli'' KRX.''']] |
| - | By analyzing the number of colony forming units and color of the colonies the ligation efficiency of LigA should be assessable. As shown for the sample without any ligase | + | By analyzing the number of colony forming units and color of the colonies the ligation efficiency of LigA should be assessable. As shown for the sample without any ligase only few clones were able to grow on chloramphenicol supplemented LB medium. A much bigger number of clones was observed when ligation by LigA was performed at 22 °C. Furthermore, there were a lot of red colonies indicating positive clones. Deductively, LigA might be useful for (large-scale) molecular cloning procedures which could be beneficial because of its easy production in ''E. coli'' and simple purification. |
<br style="clear: both" /> | <br style="clear: both" /> | ||
Latest revision as of 03:27, 29 October 2011


Contents |
What we improved since the European Regional Jamboree
BPA degradation
Specificity of bisphenol A degradation with E. coli
In order to access the specificity of the bisphenol A degradation by the bisdA | bisdB fusion protein, we tested how well two similar bisphenols, bisphenol F (BPF) and bisphenol S (BPS), were utilized. The structure of those bisphenols differs only in the chemical group linking the two phenols from that of bisphenol A (see Figure 1).
BPF and BPS are used in a broad range of applications that involve the use of polycarbonates or epoxy resins and thus can often be found were BPA is also present. Accordingly their presence is a potential disruptive factor that could lead to a false positive signal with our biosensor. This is especially true for BPS that in some cases is used as a substitute for BPA in baby bottles [http://www.nytimes.com/2011/04/18/business/global/18iht-rbog-plastic-18.html]. Studies concerning the environmental pollution with BPF ([http://www.sciencedirect.com/science/article/pii/S0043135401003670 Fromme et al. (2002)]) and the acute toxicity, mutagenicity and estrogenicity of BPF and BPS ([http://onlinelibrary.wiley.com/doi/10.1002/tox.10035/abstract Chen et al. (2001)] and [http://toxsci.oxfordjournals.org/content/84/2/249 Kitamura et al. (2005)]) indicate their potential harmfulness but further research is needed to fully assess their impact on human health.
E. coli KRX carrying genes for the bisdA | bisdB fusion protein behind the medium strong constitutive promoter <partinfo>J23110</partinfo> with RBS <partinfo>B0034</partinfo> was cultivated at 30 °C for 36 h with LB-Medium containing 120 mg L-1 BPA, BPF respectively BPS. The BPF and BPS concentration were determined by HPLC using the same method as with BPA. Figure 2 shows the degradation of the respective bisphenol after 24 h of cultivation in percent.
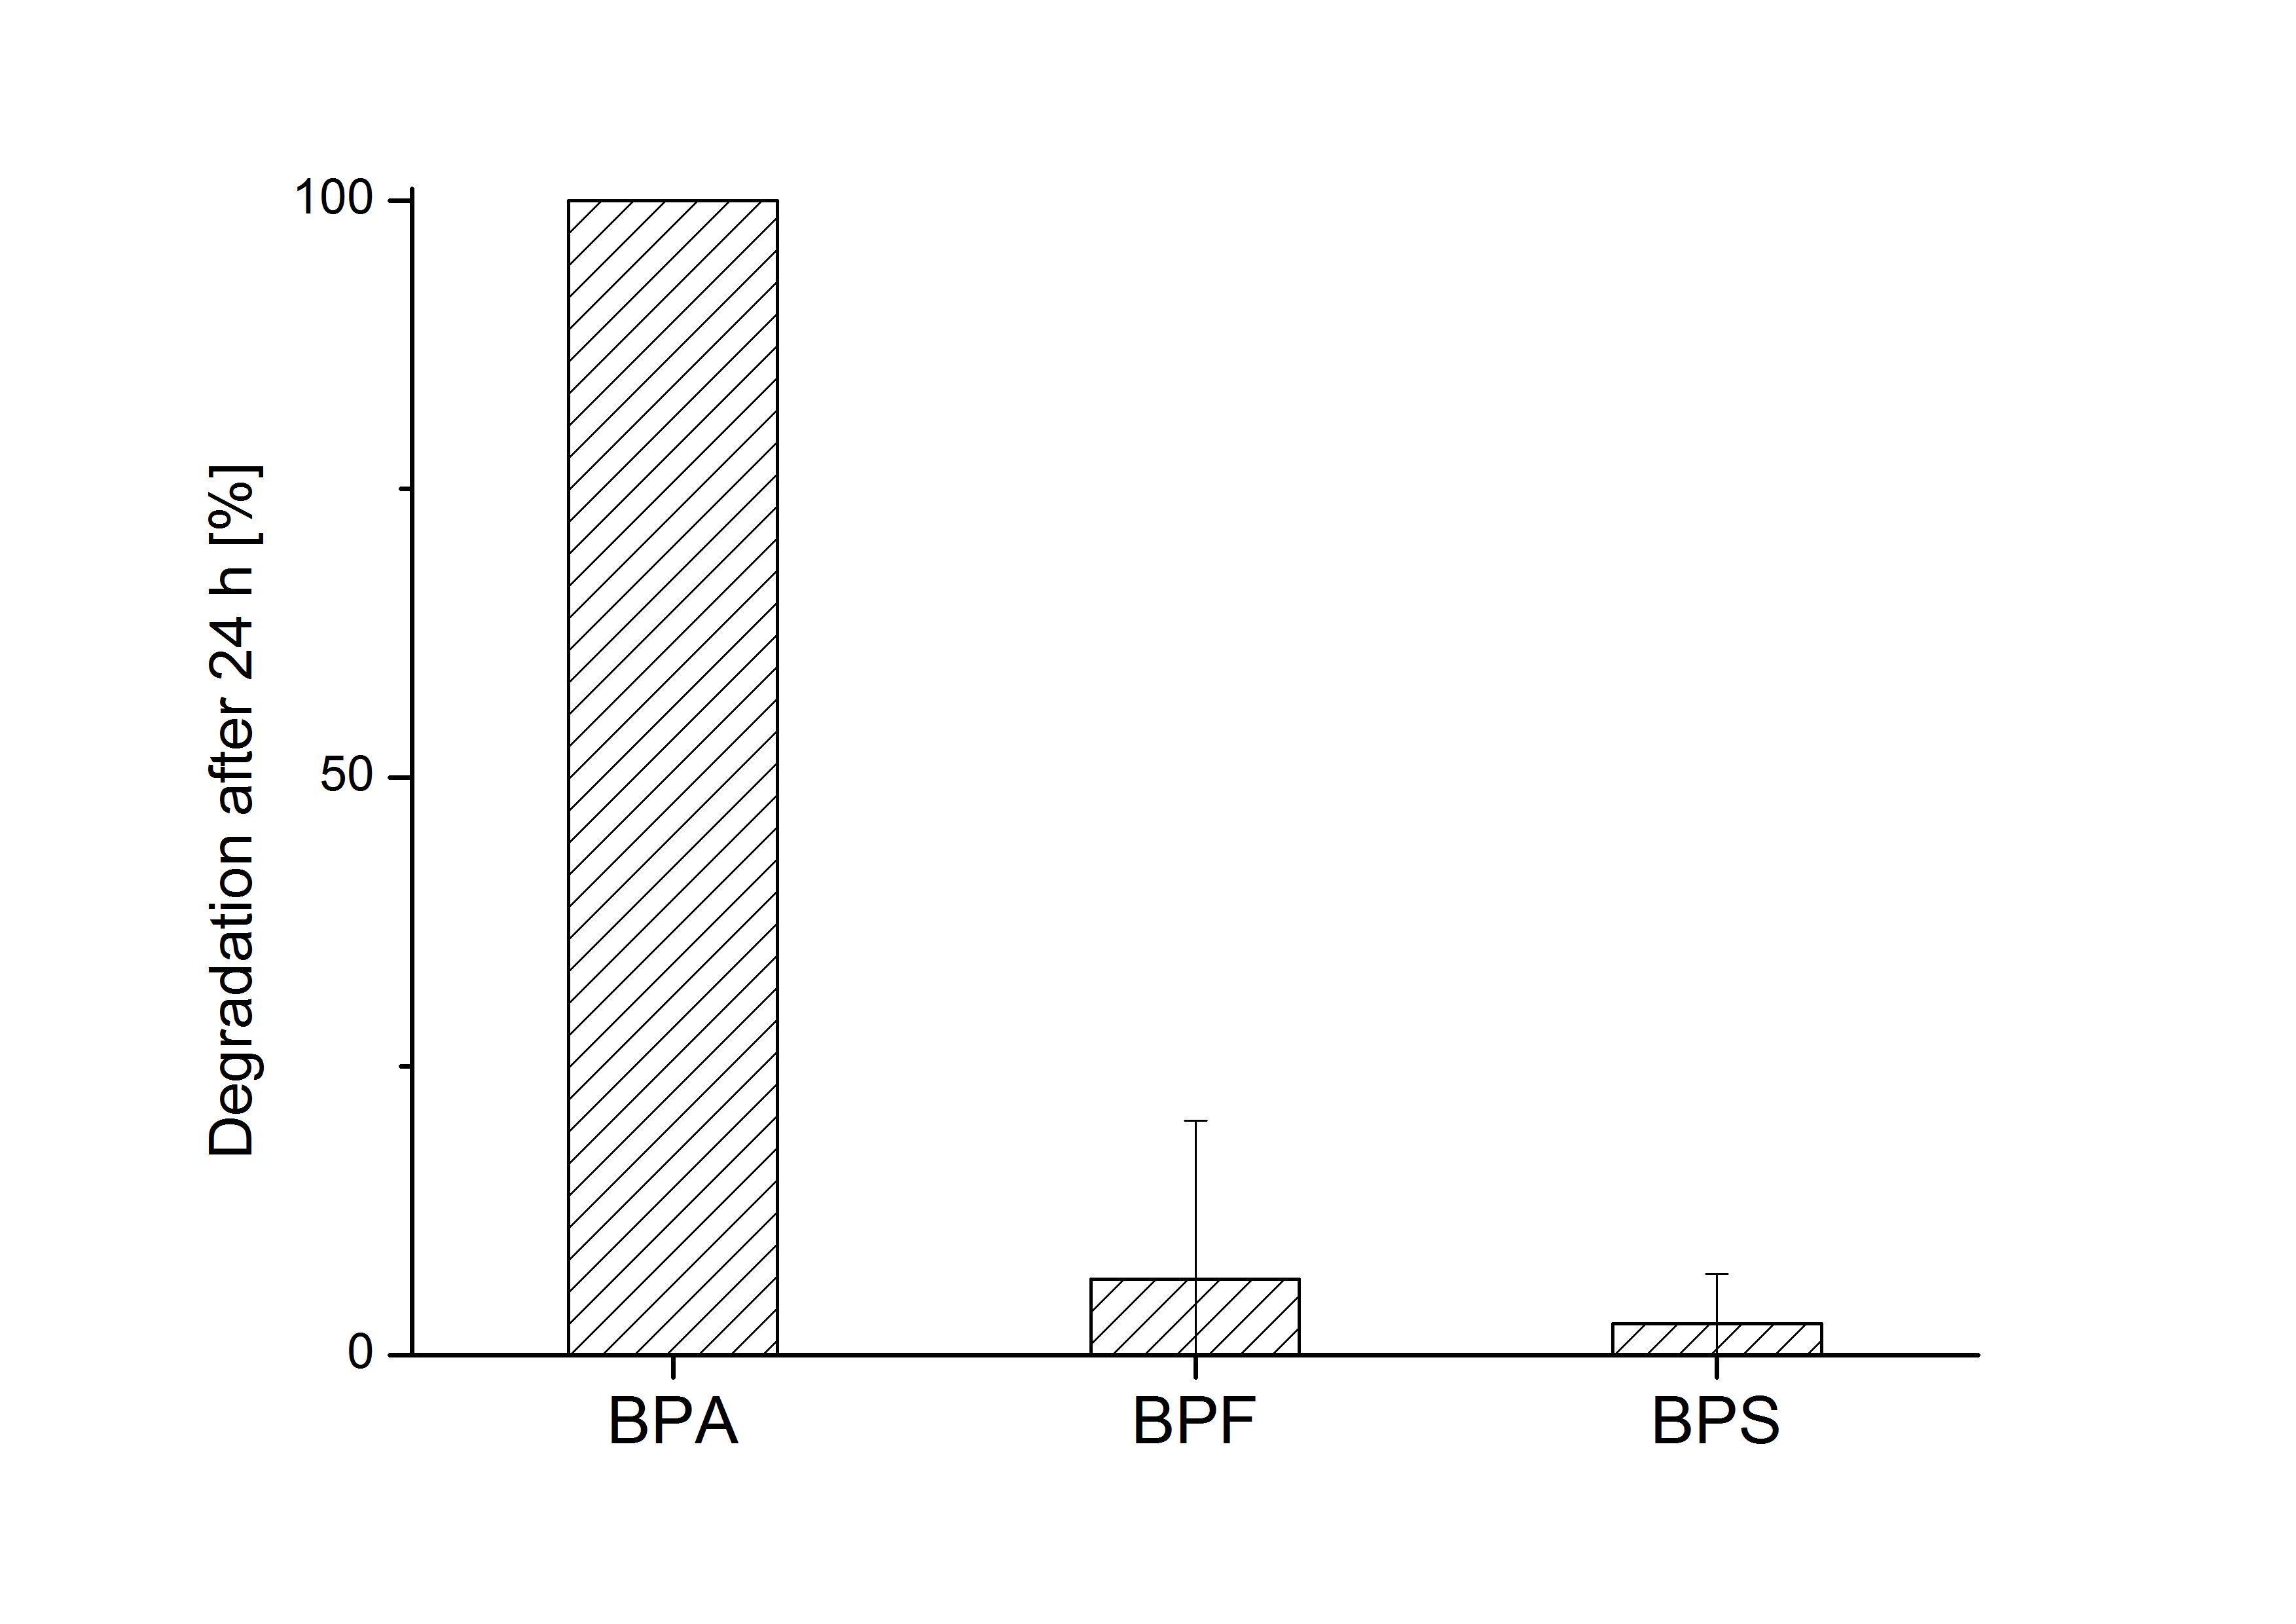
The results of the experiment indicate that the bisdA | bisdB fusion protein has a high specificity for the degradation of BPA. In addition it is possible that the decrease in BPF and BPS concentration is due to internalization of those bisphenols or a endogenous enzyme of E. coli KRX and not the bisdA | bisdB fusion protein was responsible. It can be assumed that false positive signals because of BPF or BPS present in a sample are unlikely.
BPA degradation with constructs containing FNR
Constructs containing FNR, BisdA and BisdB polycistronic (<partinfo>K525551</partinfo>), FNR and a fusion protein of BisdA and BisdB (<partinfo>K525582</partinfo>) and a fusion protein of FNR, BisdA and BisdB (<partinfo>K525560</partinfo>) were tested for their ability to degrade BPA. Cultivations were done using the same conditions as with previous constructs. The results are shown in Figure 3 below.
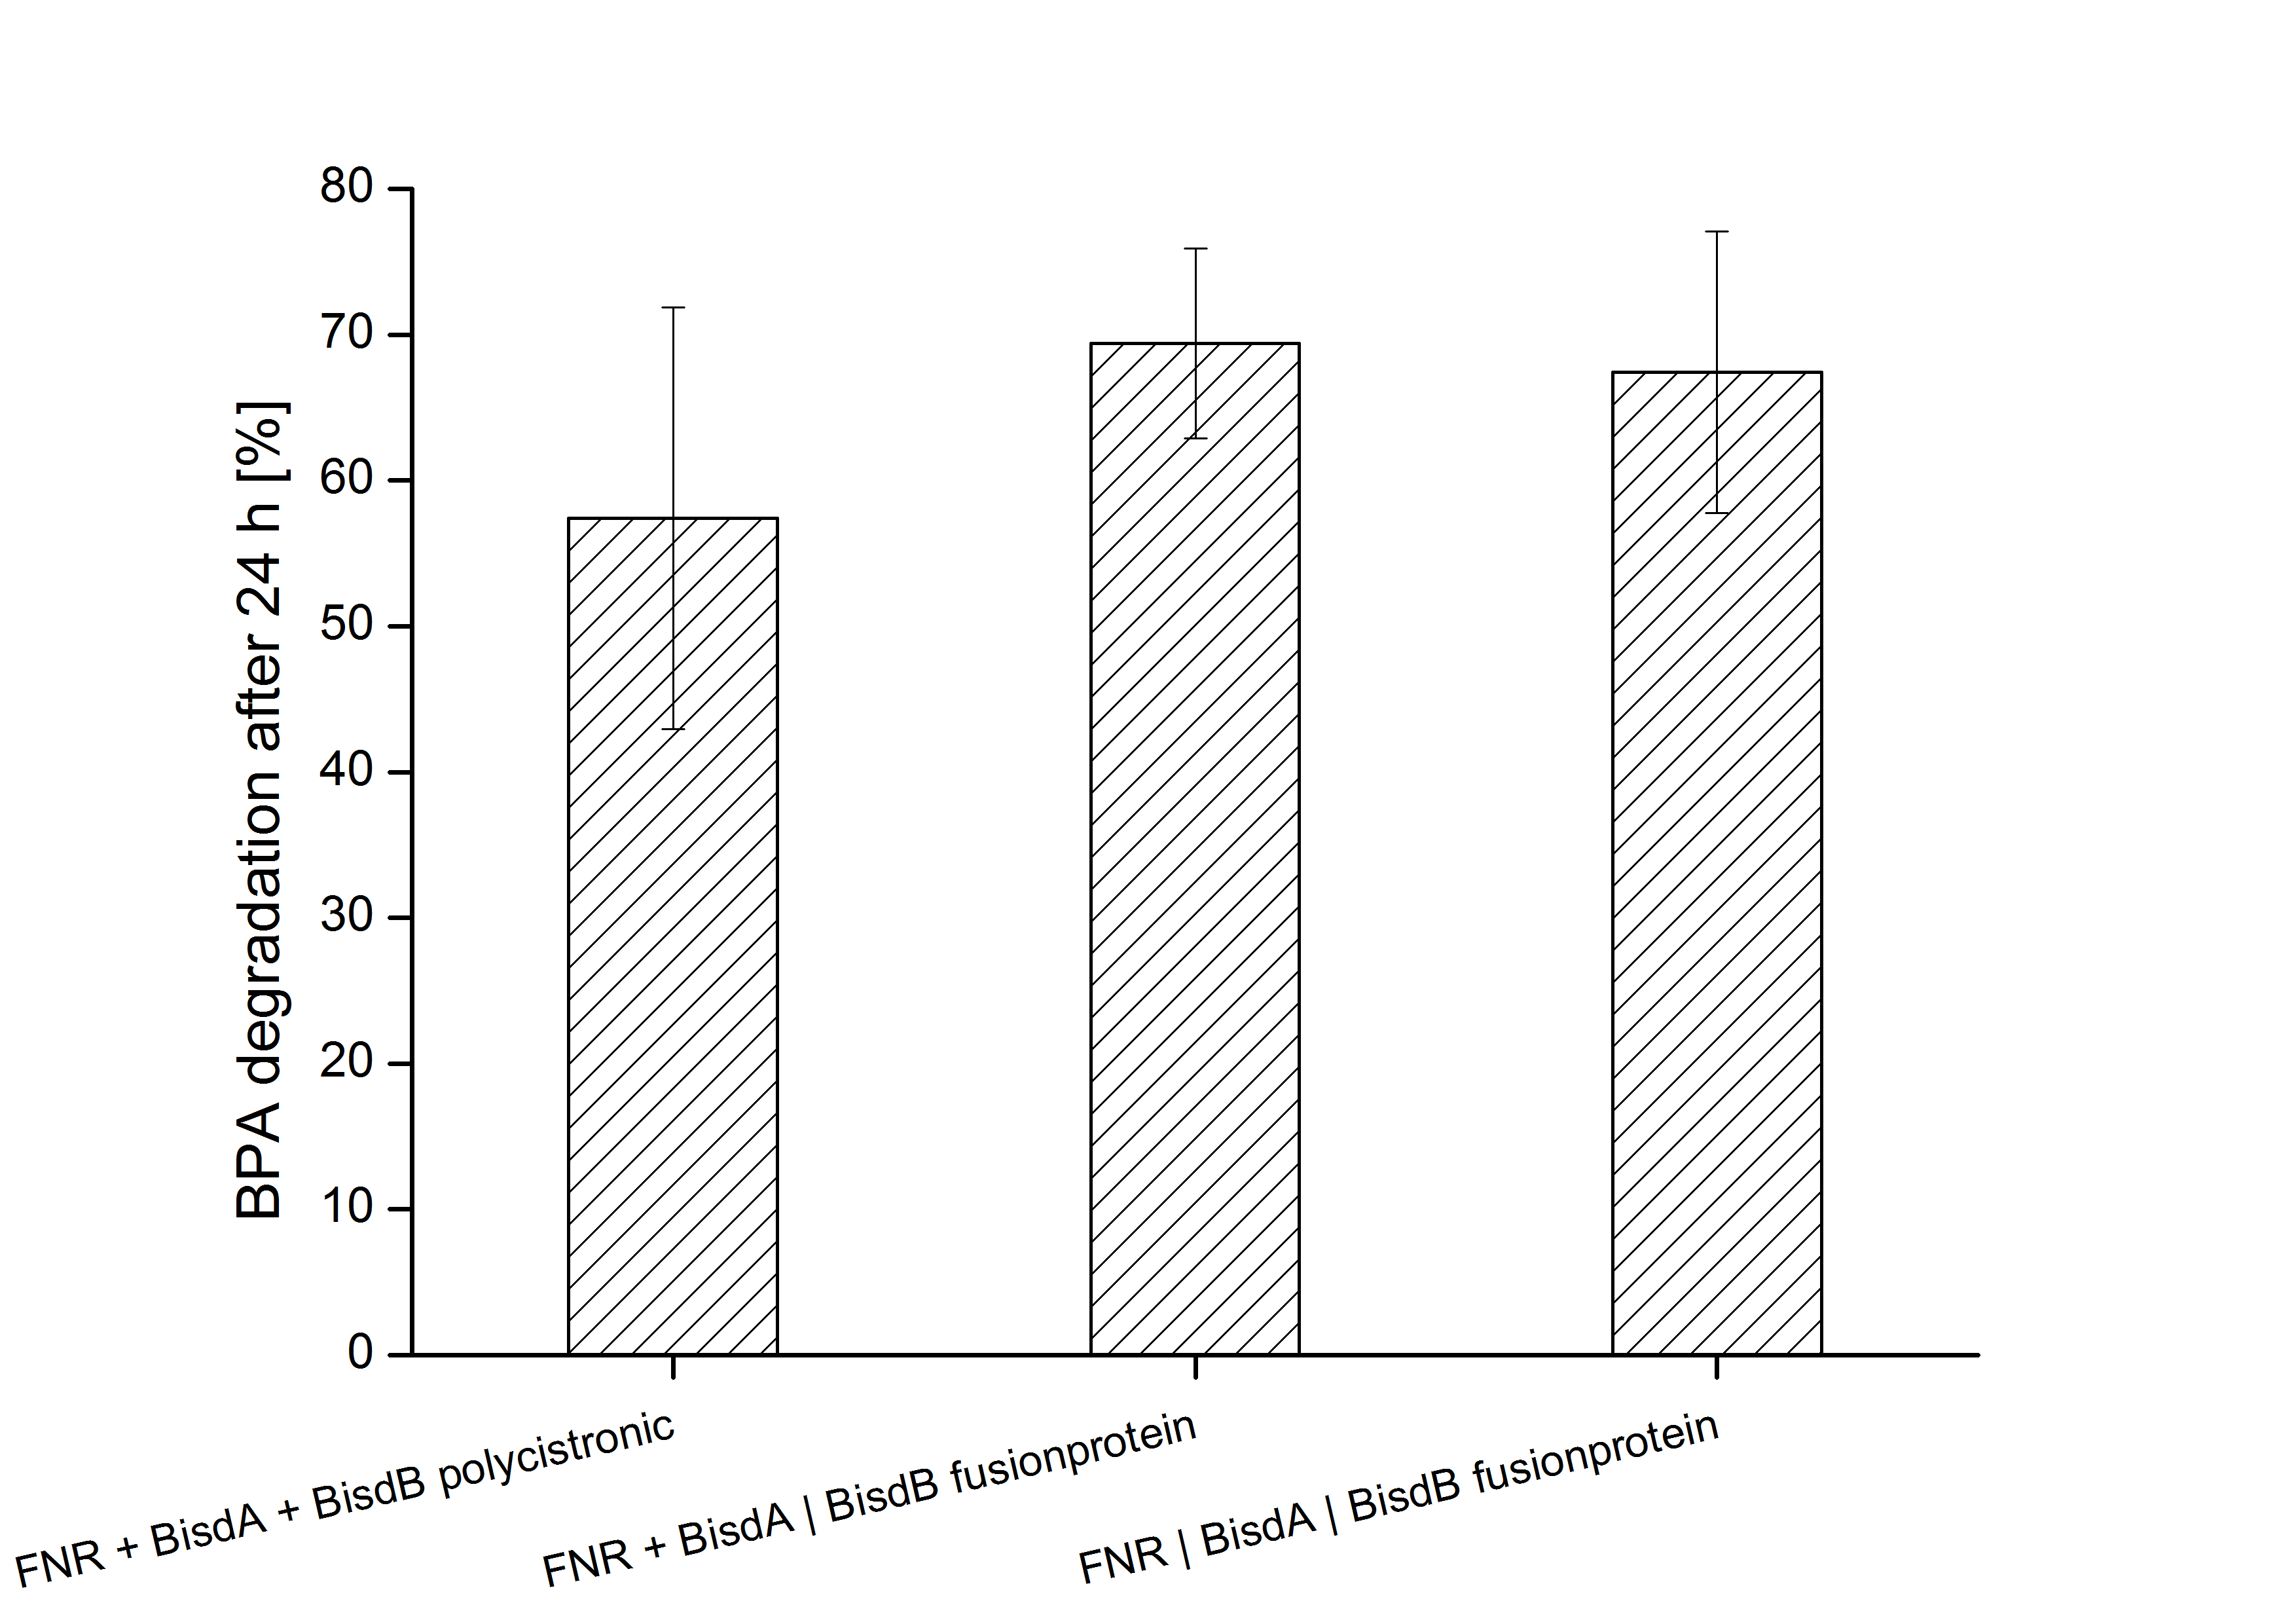
The results indicate that the BPA degradation was improved using fusion proteins compared to the completely polycistronic construct. Also the fusion protein of all three enzymes (<partinfo>K525560</partinfo>) involved in the degradation of BPA worked as intended which is quite impressive.
Comparison of all constructs used for BPA degradation
Figure 4 gives an overview of the constructs employed for the degradation of BPA.

All constructs were cultivated under the same conditions as described under Cultivations. BPA concentrations were measured using HPLC. Figure 5 shows the percentage of BPA degraded in 24 h of cultivation and the specific BPA degradation rate calculated with the regular model and in the case of <partinfo>K525560</partinfo> with the model for the fusion protein between FNR, BisdA and BisdB.

We are especially impressed that the fusion protein of FNR, BisdA and BisdB (<partinfo>K525560</partinfo>) not only was capable to degrade BPA but also was the fastest construct we employed. This also contributes to the feasibility of our approach for a cell free BPA biosensor since in a cell free environment fusion proteins are beneficial when compared to their non-fused counter parts.
Model for the fusion protein between FNR, BisdA and BisdB
The cultivations and BPA degradation of E. coli KRX carrying a fusion protein consisting of ferredoxin-NADP+ oxidoreductase, ferredoxinbisd and cytochrome P450bisd differ from the cultivations with the other BPA degrading BioBricks. Thus, the model for these cultivations has to be adjusted to this behaviour. First of all, no diauxic growth is observed so the growth can be modeled more easily like
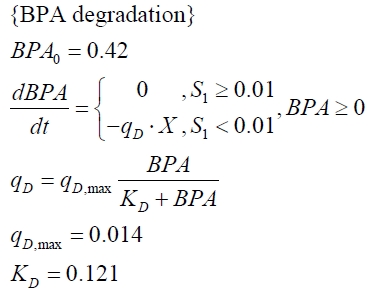
The BPA degradation starts when the imaginary substrate is depleted, like observed in the other cultivations with BPA degrading BioBricks. But it seems that the BPA degradation is getting slower with longer cultivation time. So it is modeled with a Monod-like term in which the specific BPA degradation rate is dependent on the BPA concentration:
with the maximal specific BPA degradation rate qD,max and the constant KD.
Figures 6-10 show a comparison between modeled and measured data for cultivations with BPA degrading fusion protein E. coli. In Table 1 the parameters for the model are given, obtained by curve fitting the model to the data.
Comparison between modeled and measured data
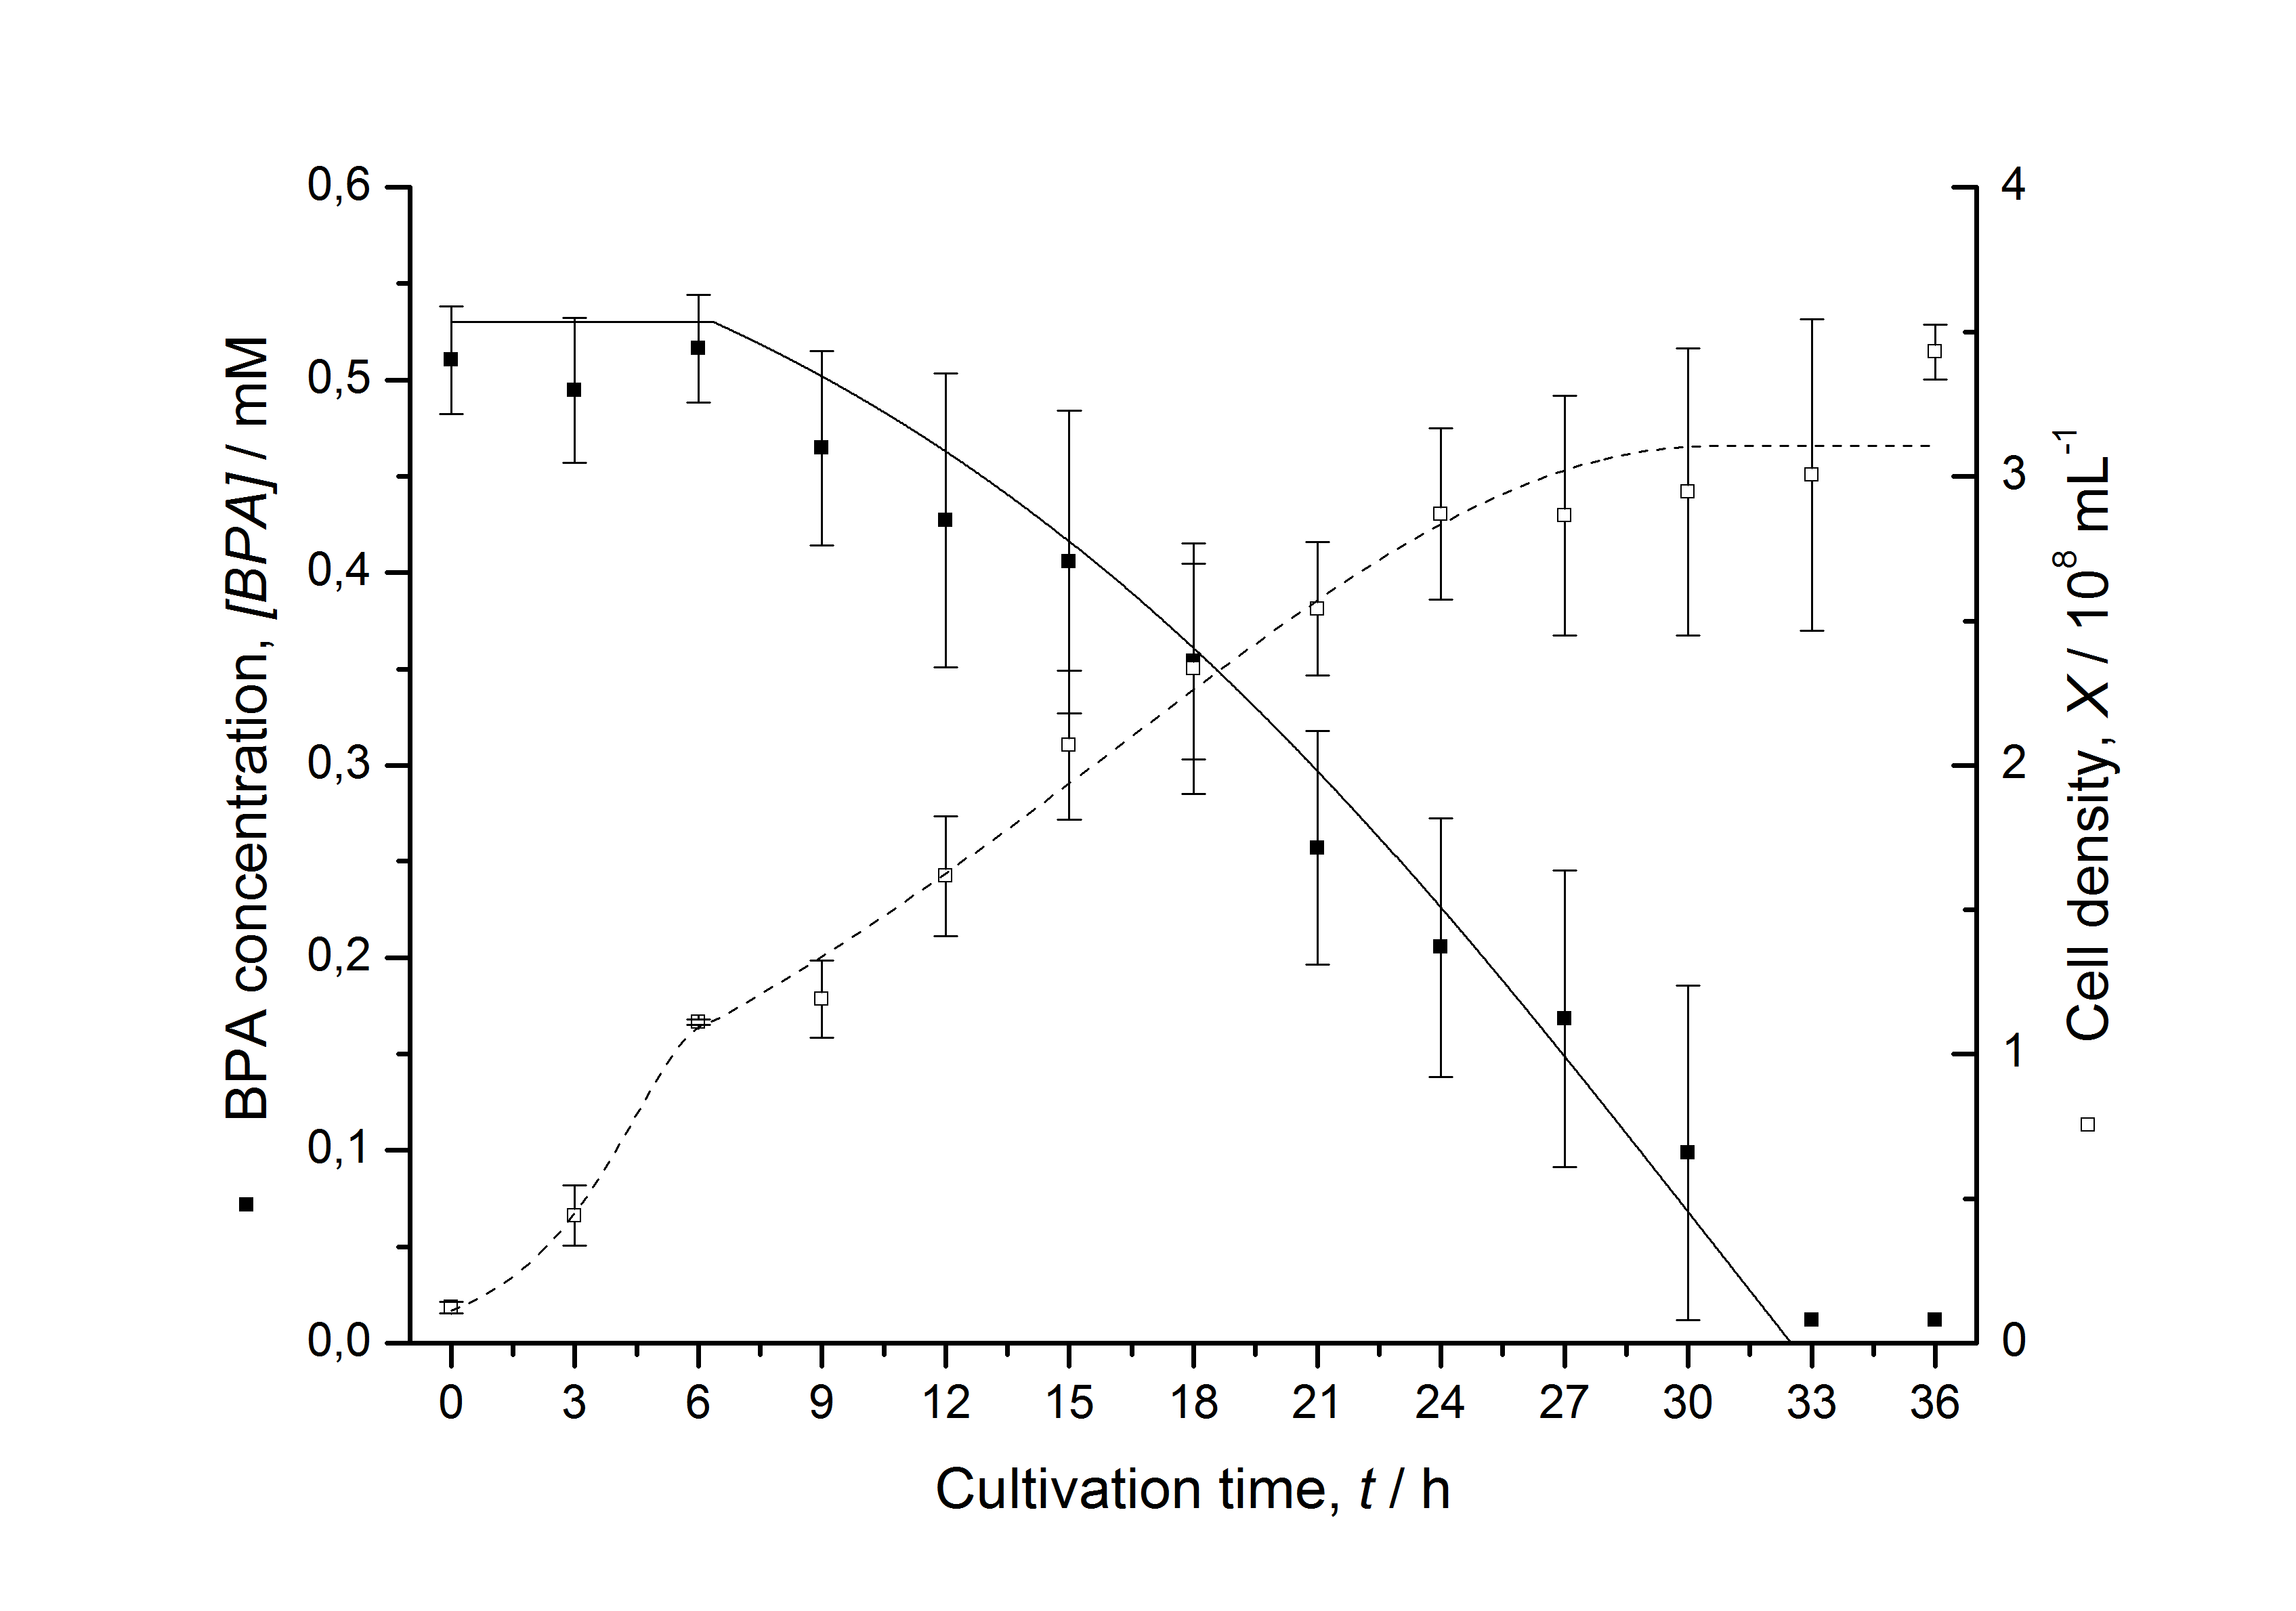
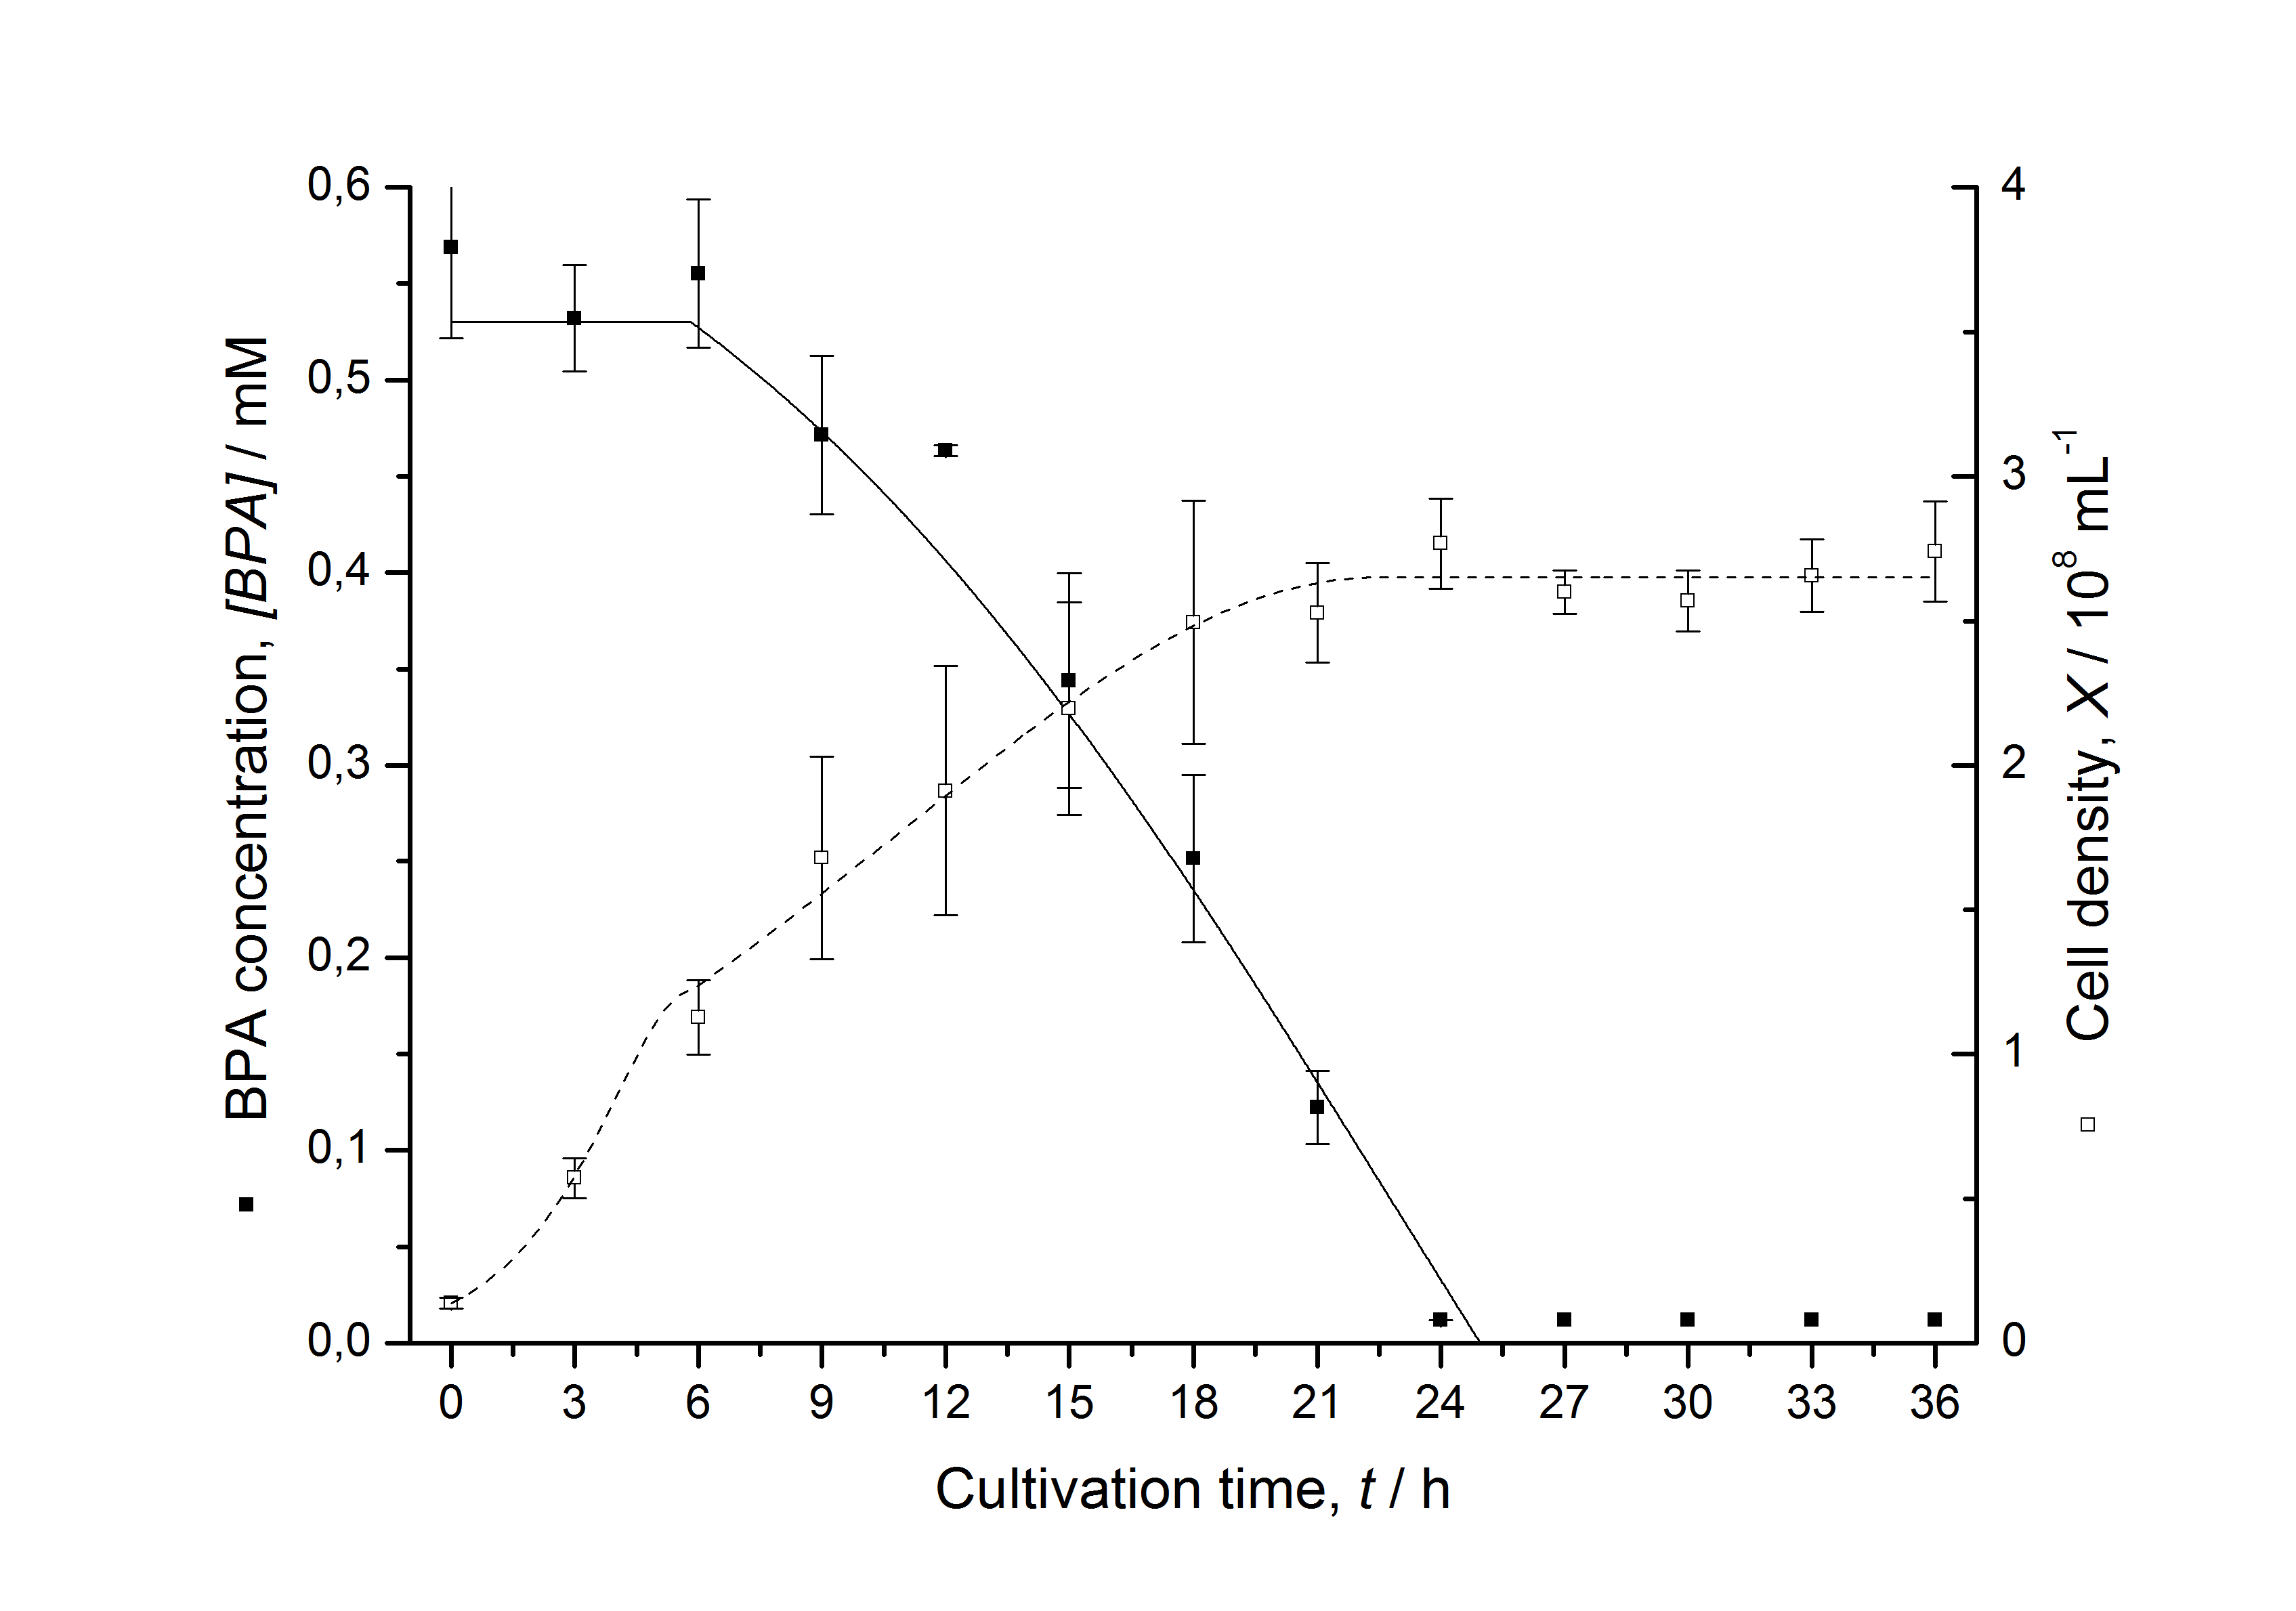
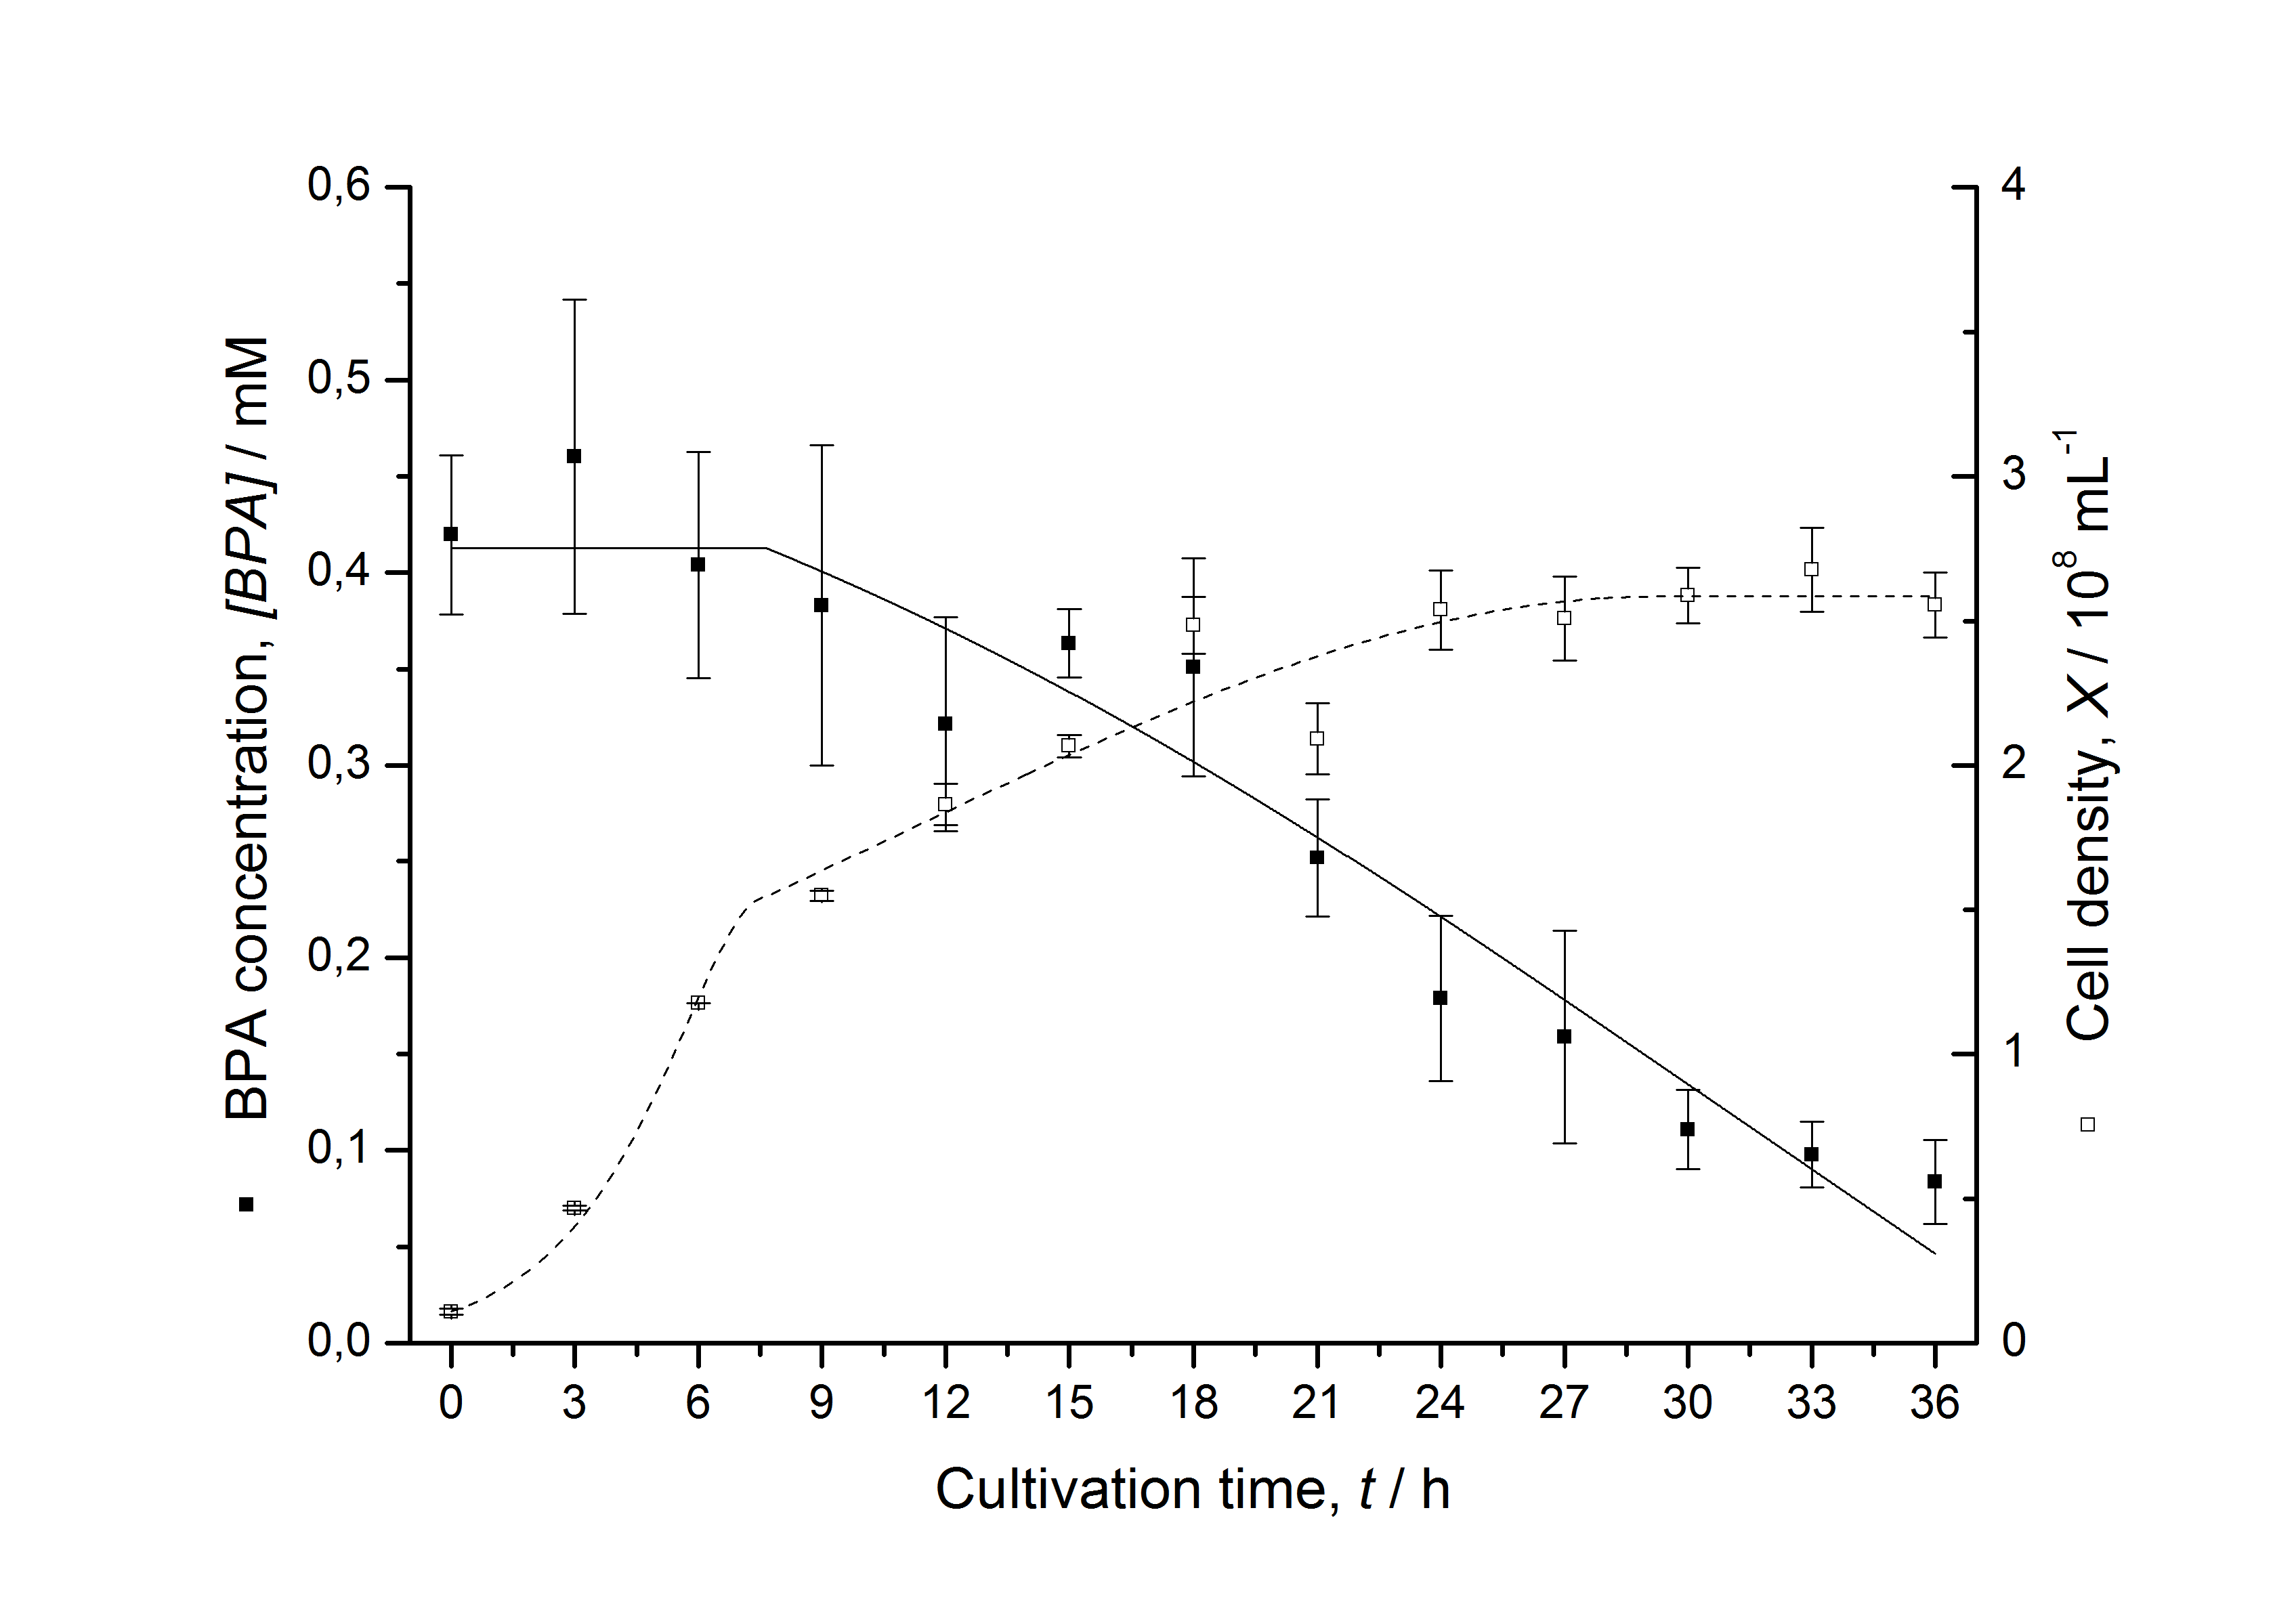
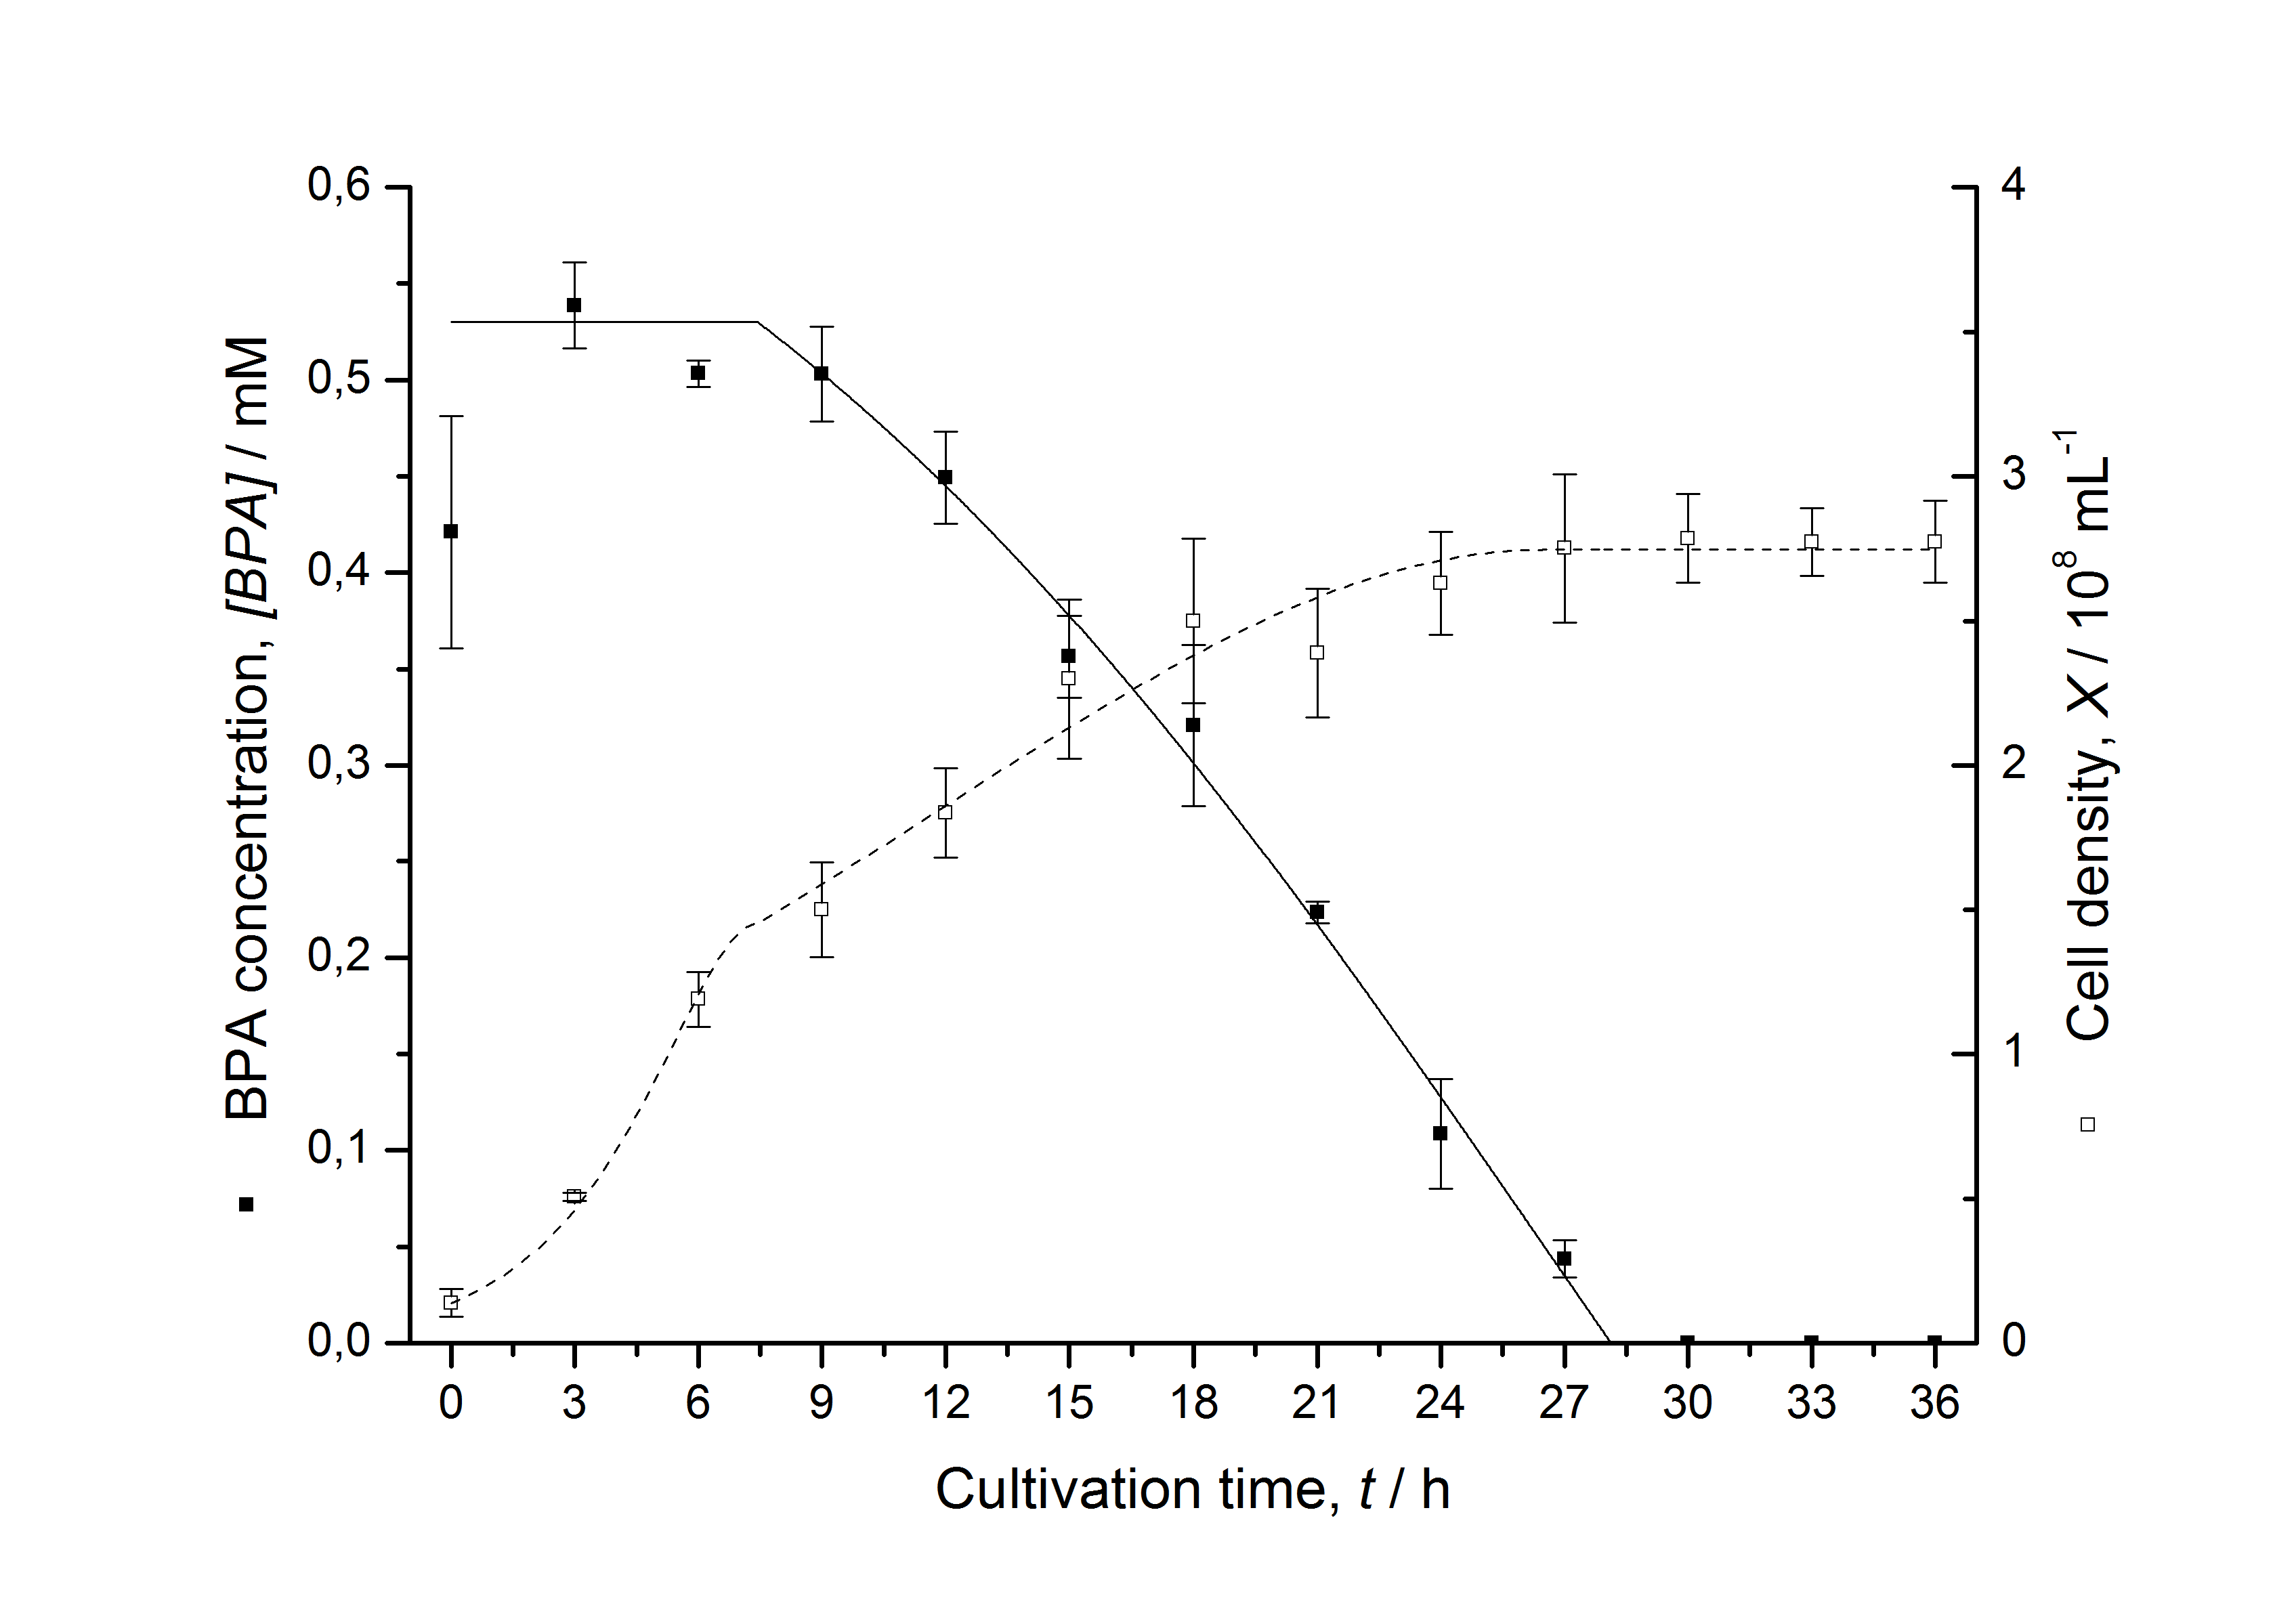
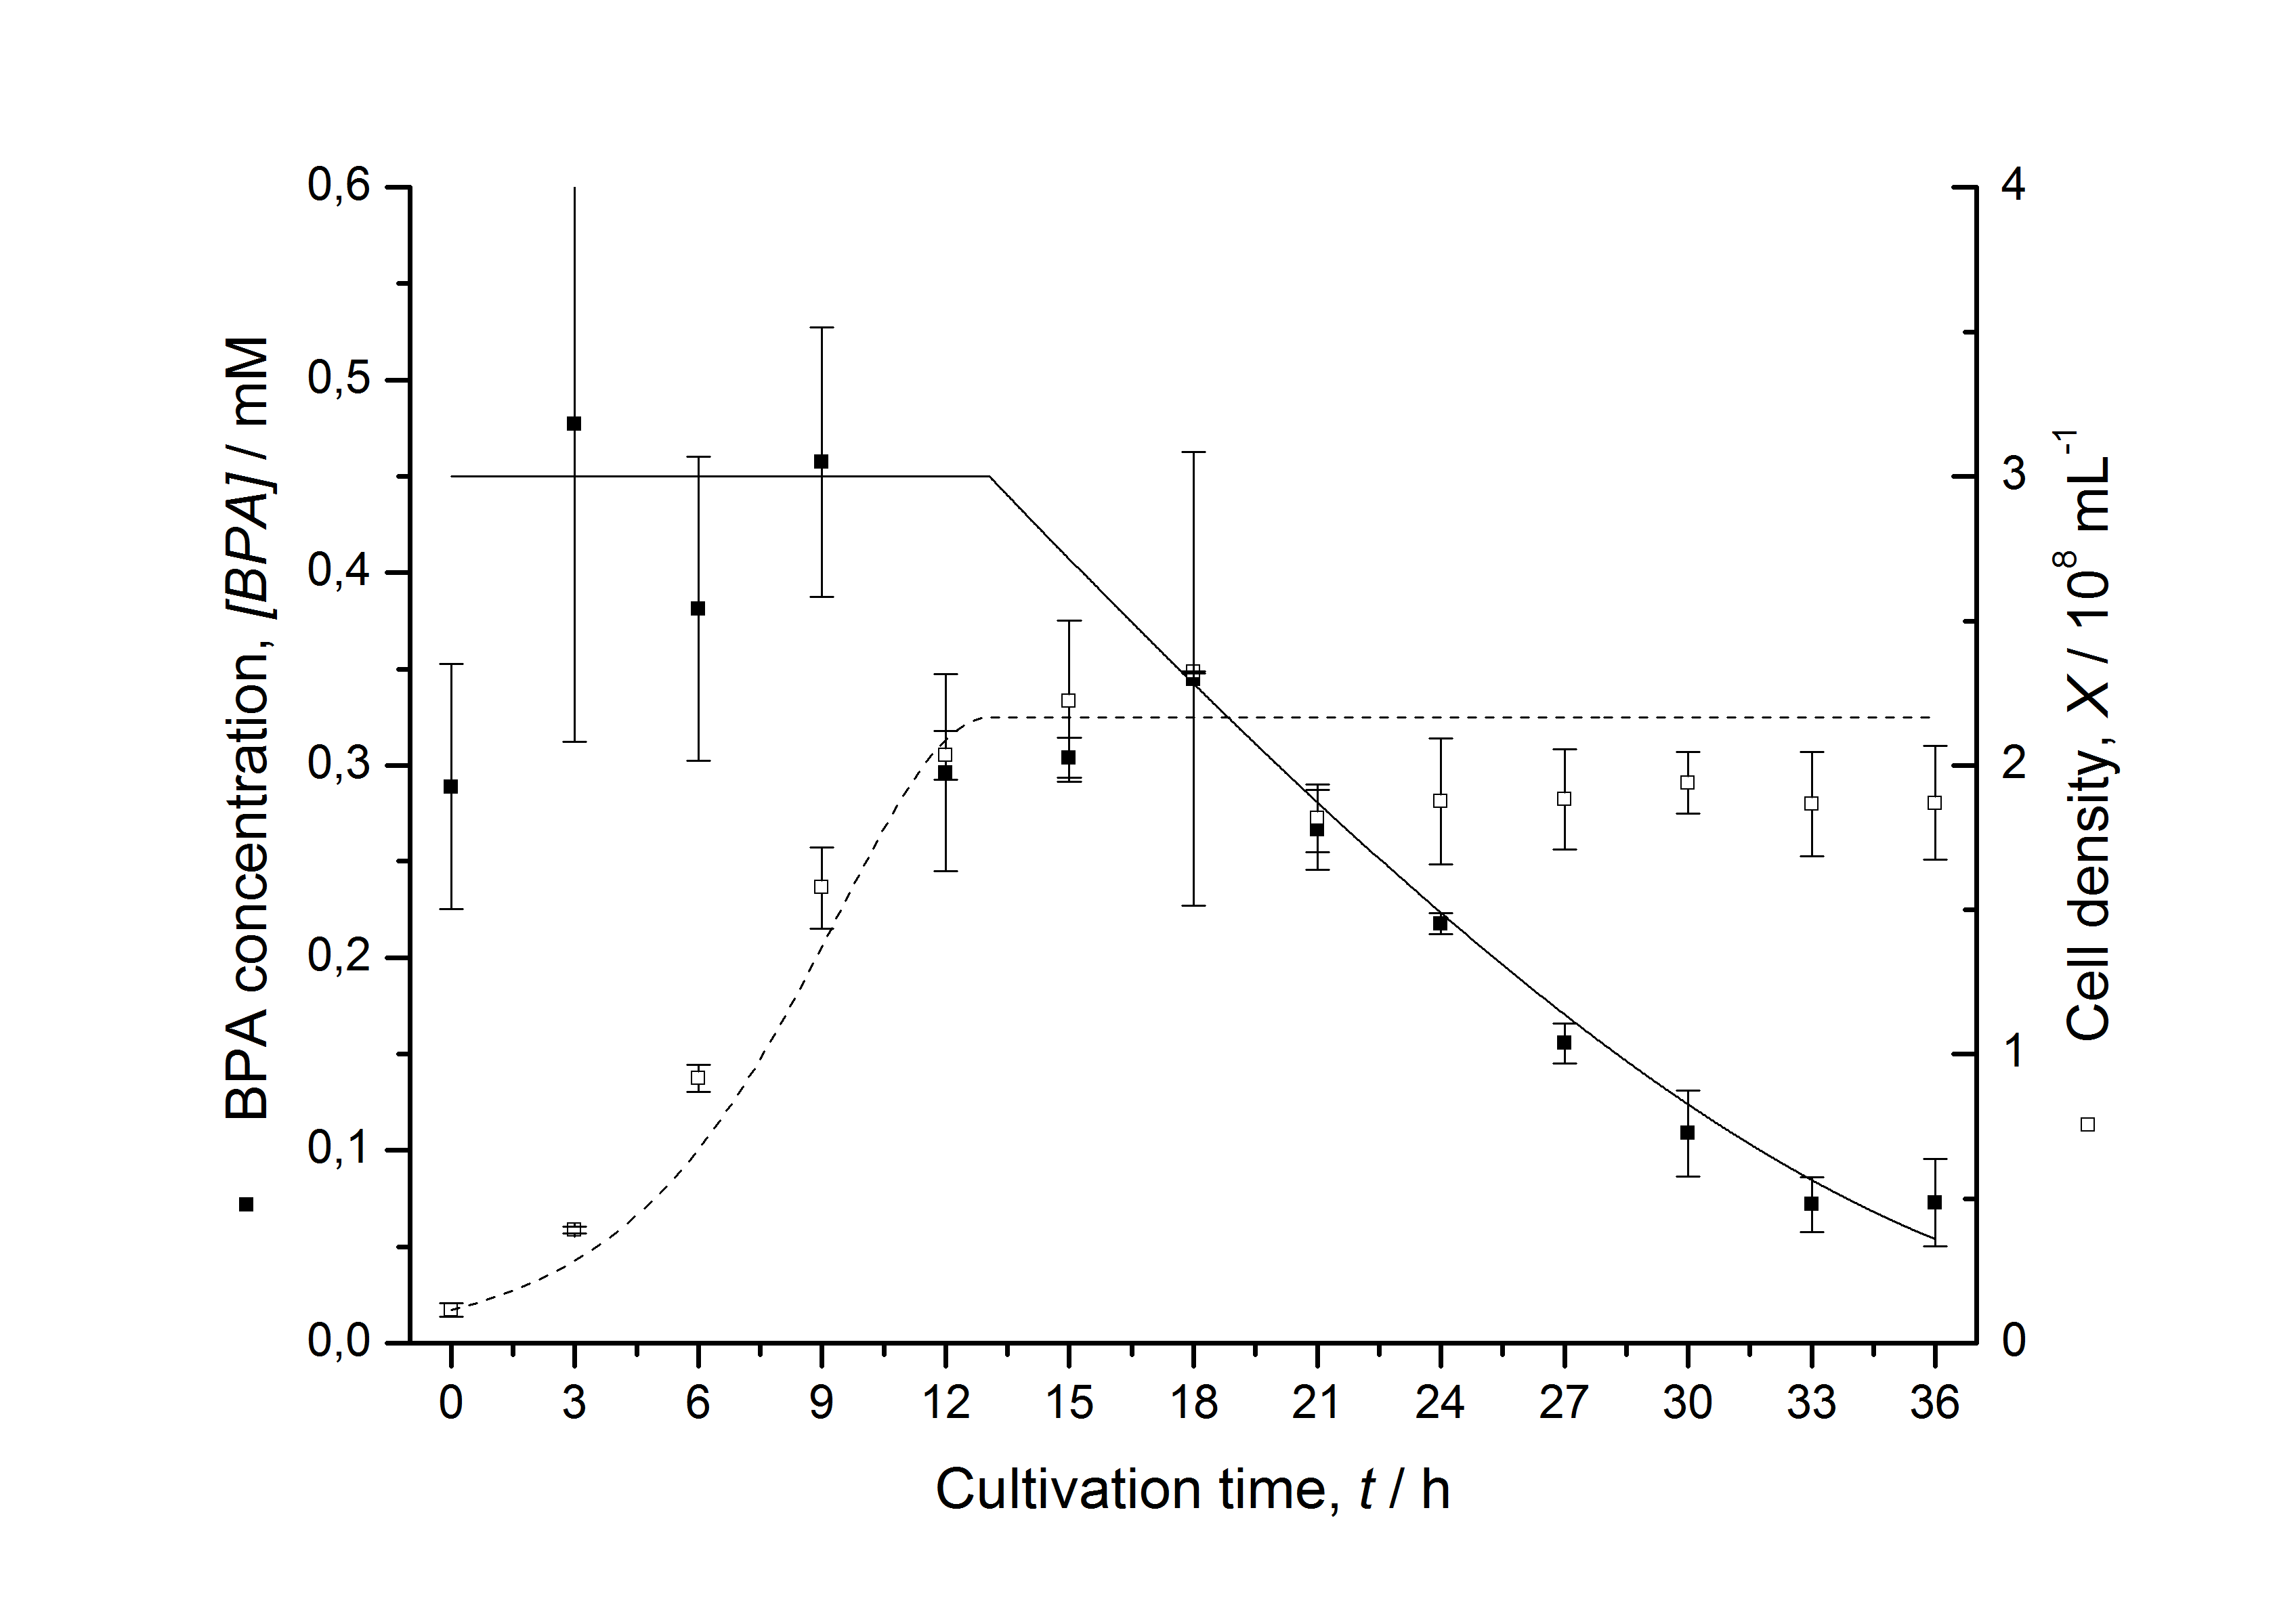
Table 1: Parameters of the model.
| Parameter | <partinfo>K525512</partinfo> | <partinfo>K525517</partinfo> | <partinfo>K525552</partinfo> | <partinfo>K525562</partinfo> | <partinfo>K525582</partinfo> |
|---|---|---|---|---|---|
| X0 | 0.112 108 mL-1 | 0.138 108 mL-1 | 0.109 108 mL-1 | 0.115 108 mL-1 | 0.139 108 mL-1 |
| µmax | 1.253 h-1 | 1.357 h-1 | 0.963 h-1 | 1.730 h-1 | 0.858 h-1 |
| KS,1 | 2.646 AU-1 | 1.92 AU-1 | 5.35 AU-1 | 13.87 AU-1 | 3.05 AU-1 |
| KS,2 | 265.1 AU-1 | 103.1 AU-1 | 82.6 AU-1 | - | 32.5 AU-1 |
| S1,0 | 1.688 AU | 1.166 AU | 4.679 AU | 3.003 AU | 2.838 AU |
| qS,1 | 0.478 AU 10-8 cell-1 | 0.319 AU 10-8 cell-1 | 0.883 AU 10-8 cell-1 | 0.240 AU 10-8 cell-1 | 0.544 AU 10-8 cell-1 |
| S2,0 | 16.091 AU | 6.574 AU | 3.873 AU | - | 2.402 AU |
| qS,2 | 0.295 AU 10-8 cell-1 | 0.191 AU 10-8 cell-1 | 0.082 AU 10-8 cell-1 | - | 0.056 AU 10-8 cell-1 |
| BPA0 | 0.53 mM | 0.53 mM | 0.41 mM | 0.45 mM | 0.53 mM |
| qD | 8.76 10-11 mM cell-1 | 1.29 10-10 mM cell-1 | 5.67 10-11 mM cell-1 | - | 1.13 10-10 mM cell-1 |
| qD,max | - | - | - | 1.32 10-10 mM cell-1 | - |
| KD | - | - | - | 0.121 mM-1 | - |
The specific BPA degradation rate per cell qD is about 50 % higher when using the fusion protein compared to the polycistronic bisdAB gene. On average, this results in a 9 hours faster, complete BPA degradation by E. coli carrying <partinfo>K525517</partinfo> compared to <partinfo>K525512</partinfo> as observed during our cultivations. The fusion protein between BisdA and BisdB improves the BPA degradation by E. coli. Introducing a polycistronic ferredoxin-NADP+ reductase gene into these systems does not lead to a higher specific BPA degradation rate. The rates are a bit lower, though. The effect that the BisdA | BisdB fusion protein is more efficient than BisdB when expressed polycistronically with BisdA can still be observed in this setup. The cultivations with the expression of the fusion protein FNR | BisdA | BisdB differ from the expression of the other BPA degrading BioBricks. The BPA degradation rate is concentration dependent which is typical for enzymatic reactions but was not observed in the other cultivations. In addition, the growth was faster and not diauxic. The maximal specific BPA degradation rate of this BioBrick is higher than the observed specific BPA degradation rates in the other cultivations. But due to the dependence of the BPA degradation from the BPA concentration the BPA degradation with this BioBrick is not as efficient and not complete. Anyway, the fact that this BioBrick is working, is impressive.
S-layer
Purification
The purification strategy could be accelerated by using a His-6-affinity tag and is more simple and pure now.
Scheme of purification strategy for SgsE (fusion) proteins with His-tag:
By fusing the SgsE | mCitrine with a C-terminal [http://partsregistry.org/Part:BBa_K157011 His-6-tag] the S-layer protein could be simply purified by using a denaturating His-tag affinity chromatography. This purification strategy has the advantage that no time-consuming and complex inclusion body purification and filtration is necessary to decrease the amount of native E. coli proteins. Additional to the simplification, a higher purity of the S-layer protein could be reached.
This purification was made using the SgsE fusion protein containing an N-terminal mCitrine for identification and a C-terminal His-6-tag. The SDS-PAGE gel (Figure 11) and the fluorescence (Figure 12) in the collected fractions showed that the majority of fusion protein was eluated with a imidazole concentration of ca. 50 mM. There was also fluorescence measurable in the flowthrough and wash fractions. This indicates that the used 1 mL HisTrap FF crude (GE Healthcare) was overloaded or the protein was bound only weakly to the affinity matrix. The resulting purity in the elution fraction, the saving of time and the easiness makes this procedure to the preferred purification method.

Because the method is so quick and easy now we developed a guide to do it yourself nanobiotechnology in which the method is presented in a vivid way.
Sometimes, the inclusion body purification does not give very clean fractions. Therefore, we developed another purification strategy for <partinfo>K525405</partinfo> monomers after inclusion body purification. This strategy consists of a capture with an IEX followed by a purification with HIC. Because of issues with the PES membranes we used to rebuffer our samples (see below - PES binds most of the S-layers) we lost a lot of our proteins in this step between the two chromatographies. So there was not enough protein left to colour it with Coomassie in an SDS-PAGE and time ran out to perform a silver staining. The fluorescence of the collected fractions of the chromatographies is shown in the figures below.


Enzyme reaction fused to S-layer protein
To test an exemplary enzymatic reaction fused to an S-layer protein SgsE | luciferase was assembled and expressed. The fusion protein shows high luciferase activity inside the cells but unfortunately the purification and stability at room temperature has some issues which have to be solved in future applications.
Expression in E. coli
For characterization experiments the SgsE gene under the control of a T7 / lac promoter (<partinfo>K525303</partinfo>) was fused to firefly luciferase (<partinfo>K525999</partinfo>) using Freiburg BioBrick assembly.
The SgsE | luciferase fusion protein was overexpressed in E. coli KRX after induction of T7 polymerase with 0.2 % L-rhamnose and induction of lac operator with 1 mM IPTG.
The following cultivation was carried out in a [http://www.gmi-inc.com/BioEngineering-KLF-Small-Laboratory-Fermenter.html#product_desc Bioengineering KLF] bioreactor with Bioengineering DCU and software. A sequencer which automatically pumped an inducer solution after 4 h cultivation time to start protein expression was implemented. Other parameters were:
- Medium: HSG medium with 20 mg L-1 chloramphenicol
- Culture volume: 2.5 L
- Starting OD600: 0.4
- DO: 60 % air saturation (controlled with stirrer cascade starting with 200 rpm)
- pH: 7.0 (controlled with 20 % phosphoric acid and 2 M NaOH)
- Antifoam: BASF pluronic PE-8100
- Induction solution: 0.2 % L-rhamnose and 1 mM IPTG
The following figure shows the expression of the SgsE | luciferase S-layer fusion protein (<partinfo>K525311</partinfo>) in E. coli KRX in HSG medium with autoinduction sequencer as described above. Optical density, activity of the fused luciferase, dissolved oxygen and agitator speed are plotted against the cultivation time.

Purification
After the analysis of cultivations with expression of SgsE | luciferase fusion proteins, different cell fractions were analyzed. It could be seen that the proteins form inclusion bodies in E. coli but that there are some soluble proteins left. This has the advantage that the proteins carrying an enzyme as fusion protein do not have to be treated with denaturating agents like urea which destroys the enzyme (data not shown).
To capture the protein from the cell lysate an ion exchange chromatography (IEX) was carried out (binding with pH 7.0, 25 mM NaCl, quaternary amine beads, elution with 100 mM NaCl). A lot of protein was found in the flow-through. When concentrating and rebuffering the proteins with PES (polyethylene sulfone) membranes a lot of protein was lost. The S-layer proteins stuck to the membrane. Some could be removed again from the membrane after cutting out the filter and incubate it in ddH2O over-night. This problem has to be kept in mind when using this S-layer.
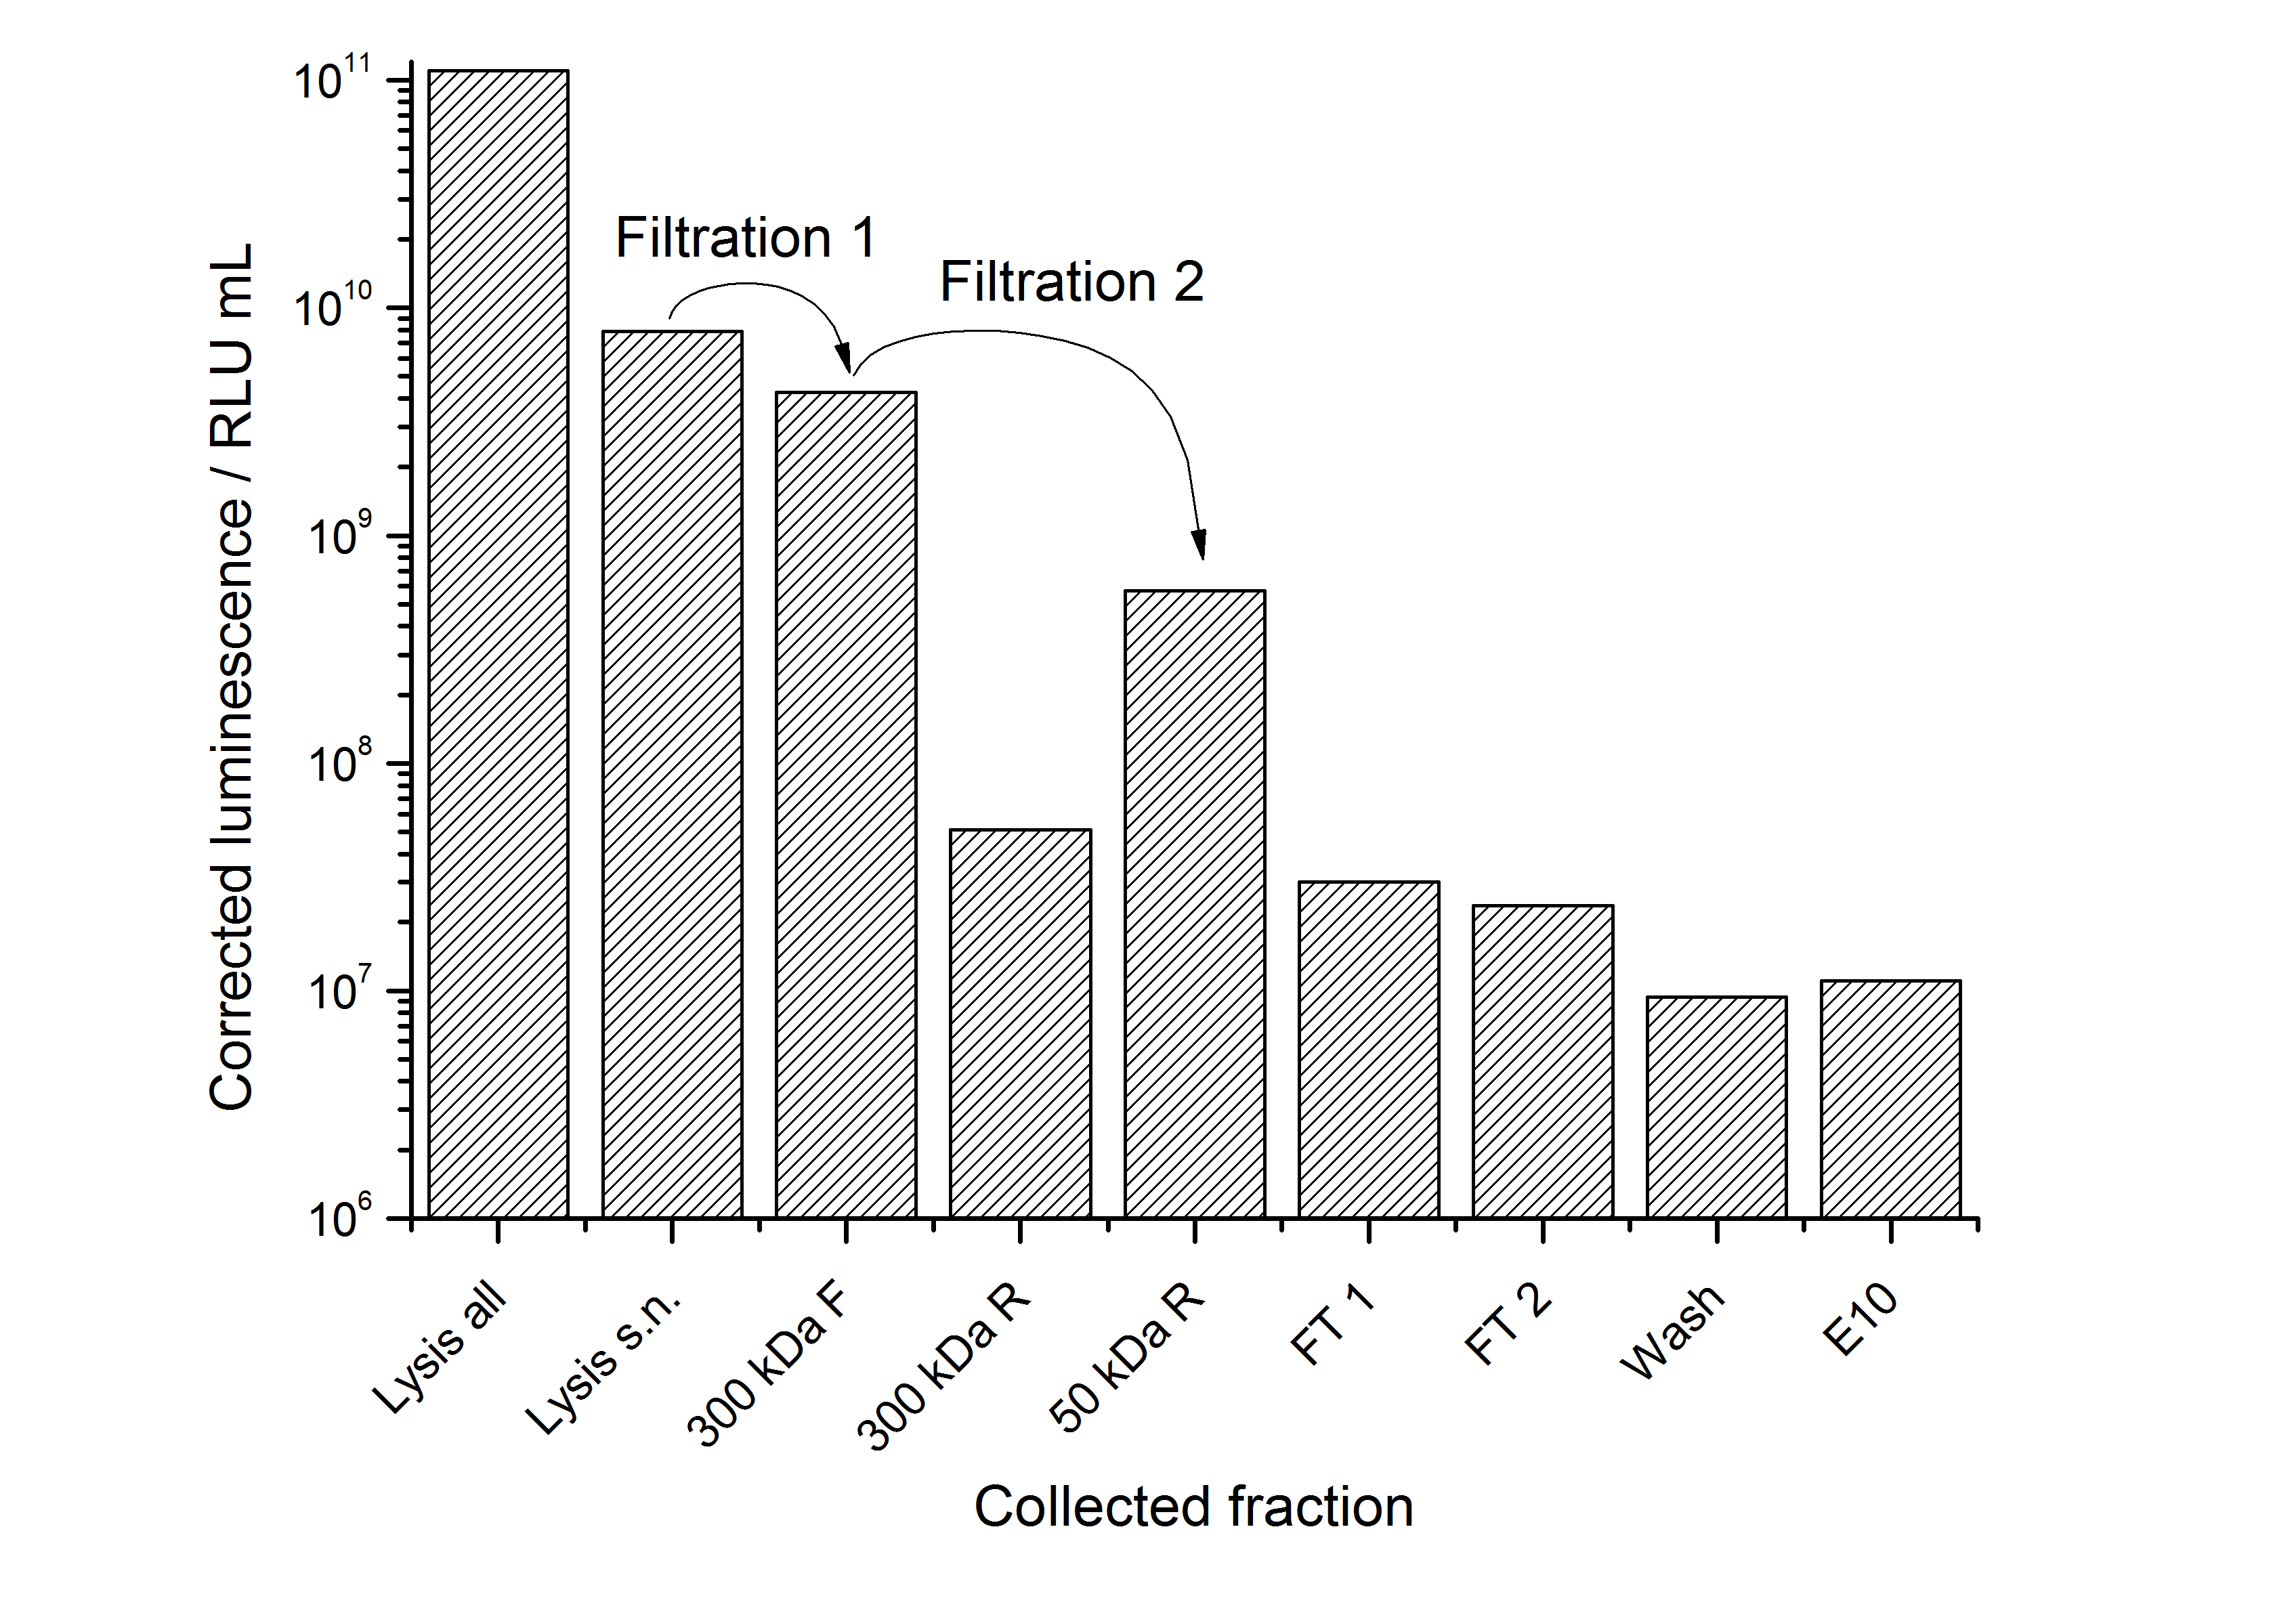
The results of the purification approach are shown in Figure 16:
The purification strategy has to be improved. The inclusion bodies cannot be purified because urea damages the luciferase irreversible (data not shown). The loss due to adsorption of the SgsE | luciferase fusion protein to PES membranes could be avoided by using different membranes. The binding conditions of the IEX have to be improved as well. Anyway, the idea behind this purification strategy could be a starting point for a better strategy. Possibilities for improvement are:
- Different membranes for ultra- / diafiltration
- Other binding conditions for the IEX capturing step (higher pH)
- Hydrophobic interaction chromatography as purification step after IEX (works in general, data not shown)
- Size exclusion chromatography (SEC) for polishing
Stability
To test whether the S-layer protein enhances the half-life of the firefly luciferase, immobilization experiments were carried out. After the IEX described above, the elution fraction was immobilized on silicon dioxide beads or just diluted with HBSS buffer which is used for the immobilization / recrystallization of SgsE S-layer proteins. The immobilization is carried out at room temperature for 4 h. It could be seen that the luciferase activity nearly expired during this time (in the positive and the negative control). So the S-layer SgsE could not stabilize the luciferase at room temperature. The results of this experiment is shown in Figure 17:
NAD+ detection
Identification of LigA
The gel bands of SDS-PAGE for His-tag purified LigA were analysed by MALDI-TOF MS and the comparison with the Swiss-Prot database clearly identified the purified protein as LigA (Figure 18, Table 2). As it is reported in literature the majority of LigA usually occurs in its adenylated form after extraction from E. coli. An indication for this is the double band on the right edge of Figure 18. The proteins in both gel bands were identified as LigA from E. coli suggesting that gel band 3 is the adenylated form and gel band 4 is the deadenylated form.

Table 2: Identification of LigA by MALDI-TOF MS. The values correspond to the framed and numbered gel bands in Figure 18. The threshold for significance of the Mascot Score for MS is 63 and the one for MS/MS is 26. The MS-Coverage represents the sequence coverage of the investigated protein with the corresponding entry in the E. coli Swiss-Prot data base. The Sequence-Coverage shows the percentage of similarity to the translated BioBrick <partinfo>BBa_K525710</partinfo> (translation was perfomed with the [http://web.expasy.org/translate/ ExPASy Translate] tool).
| Number | Method | Swiss-Prot number | Protein | Protein Mascot Score | Protein MW | pI-Value | MS- Coverage [%] | Sequence- Coverage [%] |
|---|---|---|---|---|---|---|---|---|
| 1 | MS | B1XA82 | DNA ligase OS=Escherichia coli GN=ligA | 96 | 73560 | 5.3 | 17 | 25.8 |
| 2 | MS | B1XA82 | DNA ligase OS=Escherichia coli GN=ligA | 109 | 73560 | 5.3 | 21 | 28.7 |
| 3 | MS | A7ZPL2 | DNA ligase OS=Escherichia coli GN=ligA | 41 | 73618 | 5.2 | 7 | 10.2 |
| 4 | MS | B1XA82 | DNA ligase OS=Escherichia coli GN=ligA | 134 | 73560 | 5.3 | 29 | 36.6 |
| 1 | MS/MS | Q0TF55 | DNA ligase OS=Escherichia coli GN=ligA | 54 | 73602 | 5.2 | 6 | / |
| 2 | MS/MS | Q0TF55 | DNA ligase OS=Escherichia coli GN=ligA | 63 | 73602 | 5.2 | 6 | / |
| 3 | MS/MS | Q0TF55 | DNA ligase OS=Escherichia coli GN=ligA | 33 | 73602 | 5.2 | 2 | / |
| 4 | MS/MS | Q0TF55 | DNA ligase OS=Escherichia coli GN=ligA | 36 | 73602 | 5.2 | 2 | / |
Limit of detection
To determine the limit of detection of the NAD+ bioassay the NAD+ concentrations were decreased until the fluorescence enhancement was no longer distinguishable from added H2O. This was the case as soon as the NAD+ concentration came below 2 nM. Deductively, the limit of detection of the molecular beacon based and LigA associated NAD+ bioassay was set at 2 nM NAD+. Furthermore, this confirmed the linear dependence between the initial velocity and the NAD+ concentration (Figure 19).

Selectivity test
The specifity of LigA for its substrate NAD+ is important in order to couple the NAD+ detection with investigated processes including NADH-dependent enzyme reactions. The verification of the selectivity is an important matter to exclude any unspecific reactions which might result in a NAD+-independent fluorescence enhancement. Hence, a selectivity test for LigA was performed with the analytes NADH, NADP+, NADPH, 3-ADAP (NAD+ with an exchanged functional group at the nicotinamide ring system), ATP and ADP, and the relative fluorescence enhancement rates in a NAD+ bioassay were compared with the one for NAD+ (Figure 20).
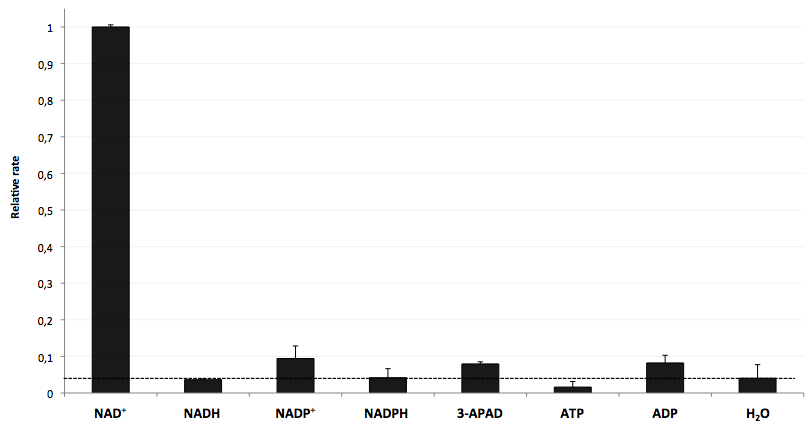
The negative control (H2O) shows that there was a small background signal about 5 % of the signal that was produced by NAD+ when using 100 nM of analytes. This marks the threshold for fluorescence enhancement which is caused by the employed analyte. NADH, NADPH and ATP were similar to the negative control and can thereby seen as analytes that do not enable DNA ligation by LigA. Only the values for the three analytes NADP+, 3-APAD and ADP were above the threshold, but they were constantly below 10 % of the NAD+ signal. This leads to the suggestion that LigA ist highly selective for NAD+ even in presence of structurally similar analytes. This makes the NAD+ bioassay and the associated enzyme LigA suitable for investigating NADH-dependent enzyme reactions or measuring NAD+ in biological analyte mixtures such as cell lysates.
Coupled enzyme reaction
The coupling of the LigA-including NAD+ detection system was performed with a NADH-dependent enzymatic reaction which was in concrete the conversion of pyruvate to L-lactate by lactic acid dehydrogenase (LDH) from E. coli. For this the LDH reaction was done with an excess of NADH and various pyruvate concentrations. Afterwards, the reaction mix was transferred to a NAD+ bioassay and the fluorescence intensity was monitored. In Figure 21 the normalized initial fluorescence enhancement rates for the employed pyruvate concentrations are indicated. The calculated initial velocity was then plotted against the pyruvate concentration (Figure 22).
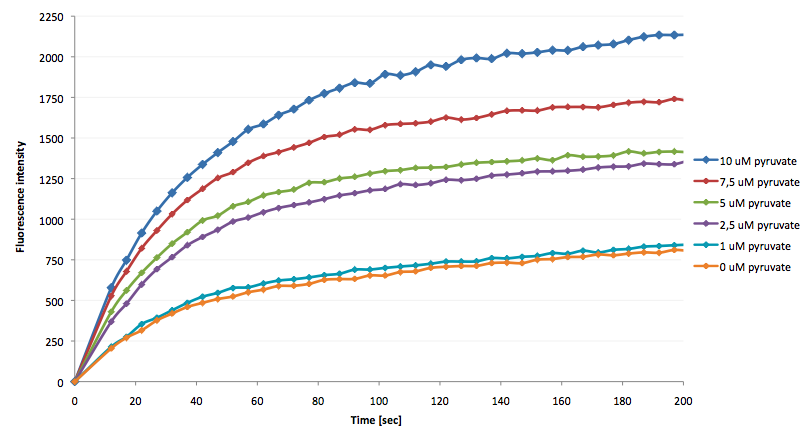
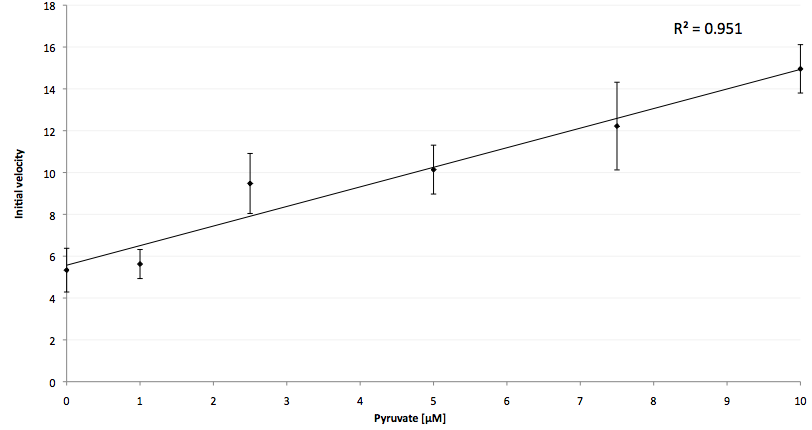
The addition of the LDH reaction mix resulted in a characteristic fluorescence enhancement rate depending on the employed pyruvate concentration. The existing correlation between both parameters seemed to be a linear. That the signal for 0 µM pyruvate was remarkably high could be the result of an pyruvate-independent transfer of electrons from NADH to the active site histidine of LDH under formation of NAD+. The limit of detection for pyruvate seemed to be near 1 µM pyruvate. That this value was not in nano molarity scale is firstly caused by 100-fold dilution of the LDH reaction mix after addition to the NAD+ bioassay and secondly by the fact that LDH does not necessarily converte 100 % of the pyruvate to L-lactate. Nevertheless, for the LigA based NAD+ detection system it has been proven that it can be coupled to NADH-dependent enzymatic reactions. This makes the NAD+ bioassay suitable for a wide range of biological studies dealing with the ubiquitous cofactors NADH/NAD+.
Molecular cloning
Because DNA ligase from E. coli is commercially aquirable for cloning purposes LigA (<partinfo>BBa_K525710</partinfo>) was tested whether it is also suitable for molecular cloning procedures. Hence, cloning of rfp into a pSB1C3 vector was performed with LigA. Ligation was done with NAD+ bioassay buffer containing 10 mM NAD+ at 37 °C or 22 °C and the vectors were transformed into E. coli KRX by electroporation. After growth over night at 37 °C on petri dishes the results were documented (Figure 23).
By analyzing the number of colony forming units and color of the colonies the ligation efficiency of LigA should be assessable. As shown for the sample without any ligase only few clones were able to grow on chloramphenicol supplemented LB medium. A much bigger number of clones was observed when ligation by LigA was performed at 22 °C. Furthermore, there were a lot of red colonies indicating positive clones. Deductively, LigA might be useful for (large-scale) molecular cloning procedures which could be beneficial because of its easy production in E. coli and simple purification.
 "
"


