Team:ETH Zurich/Achievements/Model Results
From 2011.igem.org
(→Feasibility Analysis) |
|||
| (25 intermediate revisions not shown) | |||
| Line 1: | Line 1: | ||
| - | {{:Team:ETH Zurich/Templates/ | + | {{:Team:ETH Zurich/Templates/HeaderNew}} |
| - | + | ||
| - | + | ||
| - | + | ||
| - | + | ||
| - | + | ||
| - | + | ||
| - | + | ||
| - | + | ||
| - | + | ||
| - | + | ||
| - | + | ||
| - | { | + | {{:Team:ETH Zurich/Templates/SectionStart}} |
| - | + | = Modeling - Predictions & Results= | |
| - | = | + | '''By modeling and simulating our system we verified that it can actually be implemented in reality. We checked its feasibility, drew some conclusions and decided on a most suitable channel design.''' |
| + | {{:Team:ETH Zurich/Templates/SectionEnd}} | ||
| - | + | {{:Team:ETH Zurich/Templates/SectionStart}} | |
| - | + | == Time-Scale Analysis == | |
| + | |||
| + | === Does the GFP band move? === | ||
| + | '''We come to the conclusion that our initial idea may work and that we can actually get a moving GFP band in the channel responding to different input acetaldehyde concentrations!''' | ||
| + | For a 5cm long channel, in order for our SmoColi bacteria to start reporting the presence of acetaldehyde in the air (when the GFP band appears at the beginning of the channel), the system should be supplied with around 44.05 mg/L of acetaldehyde. In order for the band to be able to form at the very end of the channel, the input acetaldehyde concentration should be 2420 mg/L. | ||
{| | {| | ||
|- valign="top" | |- valign="top" | ||
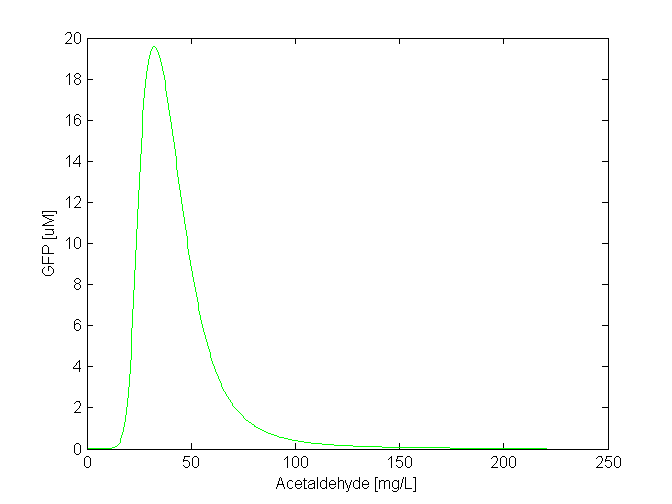
| - | |[[File: | + | |[[File:BLA.png|thumb|380px|center|'''Figure 1''': GFP (μM) vs. increasing acetaldehyde input (mg/L). The band appears when the acetaldehyde concentration is in the range of approximately 20-70 mg/L]] |
| - | + | ||
| - | + | ||
| - | + | ||
| - | + | ||
| + | |{{:Team:ETH Zurich/Templates/Flash|name=flash_gfp_ss_sweep|url=/wiki/images/9/94/ETHZ-GFP_SS_Sweep.swf|width=408|widthP2=410|height=240|text='''Video 1: Steady state simulation sweep from 1 to 2500 mg/l acetaldehyde concentration in reservoir:''' 3D GFP concentration in mol/m<sup>3</sup>, 5 slices through the channel. Channel width: 2 mm, Channel length: 5 cm.}} | ||
|} | |} | ||
| - | { | + | {{:Team:ETH Zurich/Templates/SectionEnd}} |
| - | + | {{:Team:ETH Zurich/Templates/SectionStart}} | |
| - | = Process Design = | + | == Process Design == |
After simulating our system in COMSOL, we came to the following conclusions that helped us designing the channel experimentally: | After simulating our system in COMSOL, we came to the following conclusions that helped us designing the channel experimentally: | ||
* ''E. coli'' can generate a gradient by degrading a substance replenished by diffusion in an agarose-filled channel. | * ''E. coli'' can generate a gradient by degrading a substance replenished by diffusion in an agarose-filled channel. | ||
| + | * No small microfluidics devise needed, no flow needed. The setup can be done in a small tube with diffusion only. | ||
* It can do so within a reasonable experimental timeframe (within several hours). | * It can do so within a reasonable experimental timeframe (within several hours). | ||
* It can do so within reasonable channel lengths (several centimeters. | * It can do so within reasonable channel lengths (several centimeters. | ||
* Channel diameter is irrelevant for our system. | * Channel diameter is irrelevant for our system. | ||
| - | * As mentioned, we need 44.05 mg/L of input acetaldehyde concentration for the band to appear, 2420 mg/L for it to come to the end of the channel. | + | * As mentioned, for a 5cm long channel, we need 44.05 mg/L of input acetaldehyde concentration for the band to appear, 2420 mg/L for it to come to the end of the channel. |
| - | + | {{:Team:ETH Zurich/Templates/SectionEnd}} | |
| + | {{:Team:ETH Zurich/Templates/HeaderNewEnd}} | ||
Latest revision as of 20:04, 27 October 2011
Modeling - Predictions & Results
By modeling and simulating our system we verified that it can actually be implemented in reality. We checked its feasibility, drew some conclusions and decided on a most suitable channel design.
Time-Scale Analysis
Does the GFP band move?
We come to the conclusion that our initial idea may work and that we can actually get a moving GFP band in the channel responding to different input acetaldehyde concentrations! For a 5cm long channel, in order for our SmoColi bacteria to start reporting the presence of acetaldehyde in the air (when the GFP band appears at the beginning of the channel), the system should be supplied with around 44.05 mg/L of acetaldehyde. In order for the band to be able to form at the very end of the channel, the input acetaldehyde concentration should be 2420 mg/L.
Process Design
After simulating our system in COMSOL, we came to the following conclusions that helped us designing the channel experimentally:
- E. coli can generate a gradient by degrading a substance replenished by diffusion in an agarose-filled channel.
- No small microfluidics devise needed, no flow needed. The setup can be done in a small tube with diffusion only.
- It can do so within a reasonable experimental timeframe (within several hours).
- It can do so within reasonable channel lengths (several centimeters.
- Channel diameter is irrelevant for our system.
- As mentioned, for a 5cm long channel, we need 44.05 mg/L of input acetaldehyde concentration for the band to appear, 2420 mg/L for it to come to the end of the channel.
 "
"


