 "
"
Results
Contents |
NB: unless differently specified, all tests were performed in E. coli MGZ1 in M9 supplemented medium at 37°C. For the cloning of the parts, E. coli TOP10 was used.
For more details on parts characterization, please visit the parts section.
Parts assembly
All the parts have been cloned with success. The part name, plasmids and quality controls are reported in the Freezer section.Characterization of basic modules
Characterization of promoters pTet and pLux
Inducible promoters pLux and pTet were assembled upstream of mRFP coding sequences containing an RBS from the Community collection.
The assembled RBSs are:
| BioBrick code | Declared efficiency |
| BBa_B0030 | 0,6 |
| BBa_B0031 | 0,07 |
| BBa_B0032 | 0,3 |
| BBa_B0034 | 1 |
The RBS variation has the purpose to stretch the induction curve, thus modulating the PoPs-OUT range of the inducible device.
The complex RBS-promoter acts as a whole regulatory element and determines the amount of translated protein. RBSs have been reported to have an un-modular behavior, since the translational efficiency is not independent on the coding sequences, but variates as an effect of different mRNA structure stability [Salis et al., Nat Biotec, 2009]. It is not possible to separate the effects of the sole promoter and of the sole RBS on the total amount/activity of gene product (in this case study, mRFP).
For this reason, every combination 'Promoter+RBS' was studied as a different regulatory element. Regulatory elements were characterized using mRFP reporter protein for different RBSs in terms of Synthesis rate per Cell (Scell) and R.P.U.s (Relative Promoter Units) as explained in measurements section.
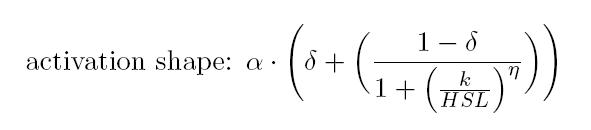
Operative parameters of the promoter are derived from the estimated Hill equations obtained by nonlinear least squares fitting (lsqnonlin Matlab routine) of the Hill function expressed in RPUs:
- RPUmax is equal to the α and represents the maximum promoter activity
- RPUmin is equal to the α * δ represents the minimum promoter activity
- Switch point is computed as the abscissa of the inflection point of the Hill curve and it is representative of the position of linear region
- Linearity boundaries are determined as the intersection between the tangent line to the inflection point and the upper and lower horizontal boundaries of the Hill curve.
| RBS | αpLux [(AUr/min)/cell] | δpLux [-] | ηpLux [-] | kpLux [ng/ml] |
| BBa_B0030 | 438 [10] | 0.05 [>100] | 2 [47] | 1.88 [27] |
| BBa_B0031 | 9.8 [7] | 0.11 [57] | 1.2 [29] | 1.5 [26] |
| BBa_B0032 | 206 [3] | 0 [>>100] | 1.36 [10] | 1.87 [9] |
| BBa_B0034 | 1105 [6] | 0.02 [>100] | 1.33 [19] | 2.34 [18] |
The operative parameters of pLux are summarized in the table below:
| RBS | RPUmax | RPUmin | Switch point [nM] | Linear boundaries [MIN; MAX] [nM] |
| B0030 | 4.28 | 0.20 | 1.08 | [0.36; 3.27] |
| B0031 | 4.93 | 0.55 | 0.25 | [0.03; 2.30] |
| B0032 | 9.49 | 0.02 | 0.47 | [0.07; 3.07] |
| B0034 | 21.53 | 0.51 | 0.53 | [0.08; 3.77] |
 |
 |
 |
 |
The protocols for the characterization of pTet promoter are reported in the pTet measurement section.
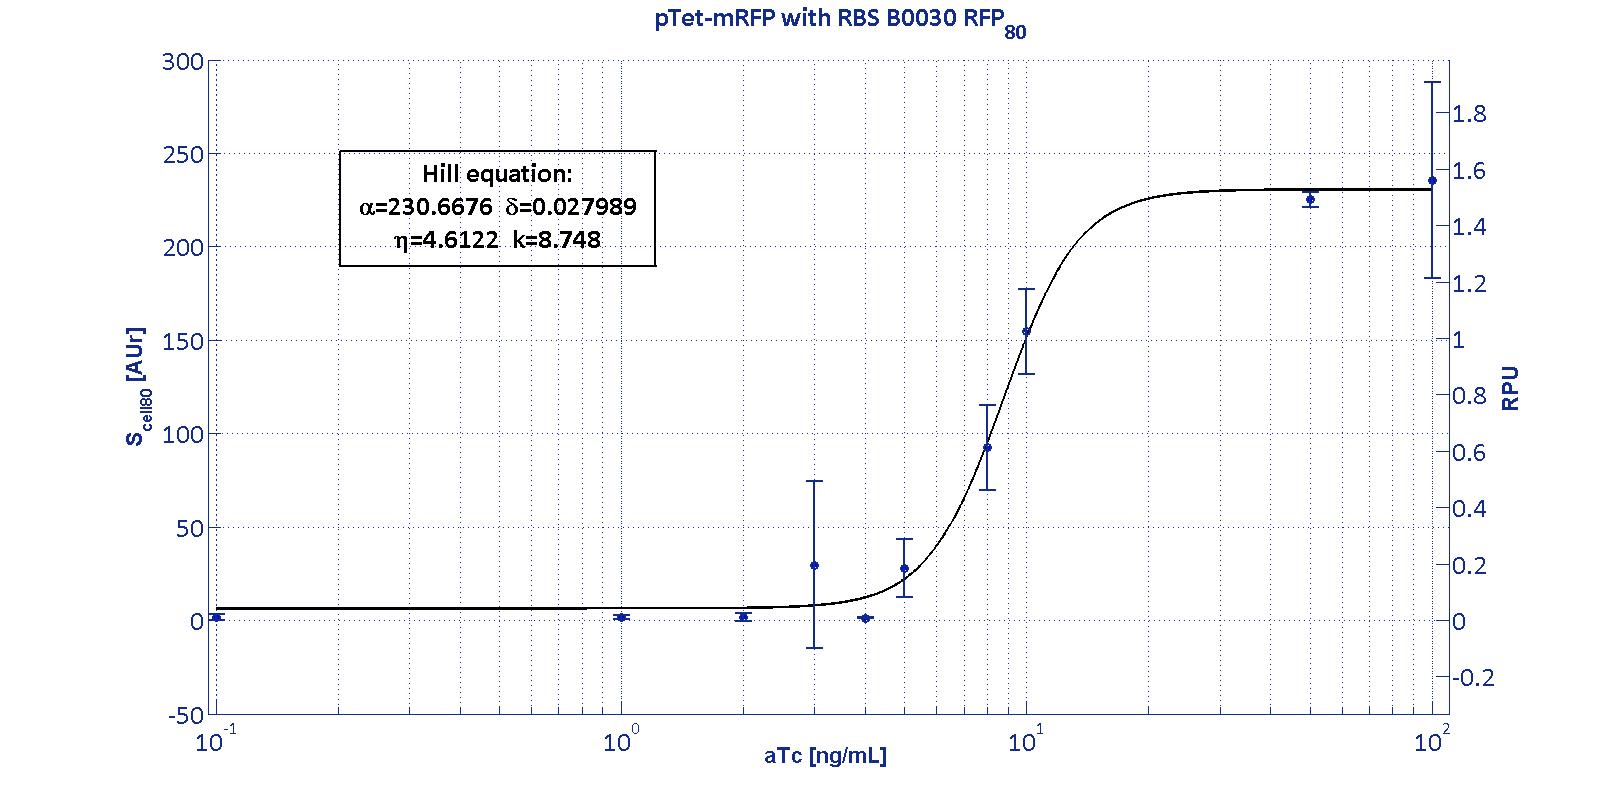
Here we have characterized its transcriptional strength as a function of aTc induction (ng/ml) for different RBSs. Three different induction curves were obtained and are reported in figure:
 |
 |
The estimated parameters of the Hill curves described in the figures are summarized in the table below:
| RBS | αpTet [(AUr/min)/cell] | δpTet [-] | ηpTet [-] | kpTet [nM] |
| BBa_B0030 | 230.67 [3.7] | 0.028 [91.61] | 4.61 [23.73] | 8.75 [4.16] |
| BBa_B0031 | ND | ND | ND | ND |
| BBa_B0032 | 55.77 [12] | 1.53E-11 [>>100] | 4.98 [57.62] | 7.26 [14.98] |
| BBa_B0034 | 120 [5.95] | 0.085 [40.6] | 24.85 [47.6] | 9 [5.43] |
The operative parameters are summarized in the table below:
| RBS | RPUmax | RPUmin | Switch point [ng/ml] | Linear boundaries [MIN; MAX] [ng/ml] |
| B0030 | 1.53 | ~0 | 7.95 | [4.66;11.99] |
| B0031 | ND | ND | ND | ND |
| B0032 | 3.16 | ~0 | 6.7 | [4.45;10.05] |
| B0034 | 2.73 | 0.23 | 8.96 | [8.27;9.71] |
Characterization of enzymes AiiA and LuxI
LuxI has been characterized through the Biosensor BBa_T9002 (see modelling section) using the pTet-RBSx-LuxI-TT measurement systems.
The parameters Vmax, kM,LuxI and αRBSx were estimated with a simultaneous fitting of the data collected as described in measurement section for the four measurement parts pTet-RBSx-LuxI-TT assayed by BBa_T9002 biosensor section.

The estimated parameters for the enzymatic activity of LuxI are reported in the table below:
| Vmax | kM,LuxI | αB0030 | αB0031 | αB0032 | αB0034 |
| 3.56*10-9 | 6.87*103 | 87 | 8.5 | ND | 252 |
The provided parameters kM and Vmax represent the enzymatic activity of LuxI, described by our model. They must not be confused with the operative parameters of the Michaelis-Menten relation. These synthetic parameters have a great importance, since they can be used in more complicated models in order to predict the behavior of complex circuits.
The AiiA enzyme activity has been characterized under the regulation of ptet promoter, assaying its enzymatic activity.
The parameters kcat, kM,AiiA and αRBSx would have been estimated with a simultaneous fitting of the data collected as described in measurement section for the four measurement parts pTet-RBSx-AiiA-TT assayed by BBa_T9002 biosensor section.
Unfortunately, their estimation revealed difficult.
In the first experiments with the measurement system pTet-RBSx-AiiA-TT in LOW-COPY at pH=7 no degradation of HSL was observed. The collected data are shown in the figure below. HSL degradation is identical in the measurement system and in the negative control after 21 hours.
 |
 |
 |
 |
Characterization of the efficiency of RBSs from the community collection
RBSs were used for the fine tuning of CTRL+E. Different experimental conditions were assayed.Estimated efficiencies in pSB4C5 plasmid with -RBSx-mRFP-TT coding sequence under the control of the specified promoter:
| RBS | effpLux | effpTet | effJ23101 | Declared efficiency |
| B0030 | 0.40 | 1.6814 | 2.45 | 0,6 |
| B0031 | 0.01 | ND | 0.04 | 0,07 |
| B0032 | 0.19 | 0.4193 | 0.40 | 0,3 |
| B0034 | 1 | 1 | 1 | 1 |
Estimated efficiencies in pSB4C5 plasmid with pTet-RBSx-GeneX-TT, with GeneX=mRFP, AiiA or LuxI:
| RBS | effmRFP | effAiiA | effLuxI | Declared efficiency |
| B0030 | 1.72 | 0.53 | 0.45 | 0,6 |
| B0031 | 0.03 | 0.83 | 0.028 | 0,07 |
| B0032 | 0.37 | 0.50 | N.D. | 0.3 |
| B0034 | 1 | 1 | 1 | 1 |
Identification of bacterial growth parameters
The bacterial growth curve has been modelled as a logistic curve and is represented by the following equation:
dN/dt=N*μ*(Nmax-N)/Nmax
N(0)=n0
where μ represents the growth rate of the cells (E. coli MGZ1 in M9 supplemented medium) and Nmax represents the maximum number of cells in the well. For a detailed description of the parameters, see modelling section. For details on parameters identification, see identification section. The growth curves in all the performed experiments are measured in O.D.600. Since the N species in the model is expressed in cell number, a conversion factor has been estimated. The conversion factor KO.D.toC.F.U. has been estimated as follows.
- Two cultures C1 and C2 (MGZ1 cells) were grown in 1ml M9 medium till saturation (ON liquid culture, 37°C, 220 rpm).
- Next morning, both C1 and C2 were diluted in M9 medium with a final volume of 1ml with the following dilution factors:
- 1:1
- 1:10
- 1:100
- 1:1000
- After 1 hour, O.D.600 was measured using TECAN microplate reader (don't forget to measure a M9 sample for blanking!)
NB: from now on, cultures must be placed in ice to stop cell growth. - At the same time, proper dilution of the cultures were plated on LB agar plates.
NB: All the dilutions are performed moving 100 μl of culture in previously ice-chilled 900 μl fresch M9. 100 μl of the final dilution are plated (It still represents a 1:10 dilution!) - Plates were grown overnight and next morning C.F.U. were counted.
- C.F.U. values were corrected by the dilution factor and a linear regression (N vs O.D.600) was performed in order to evaluate the conversion factor KO.D.toC.F.U..
- KO.D.toC.F.U. was used as conversion factor to multiply the O.D.600 value of saturation in the growth curves (~0,5).
The results are summarized in the table and in the figure below:
| Culture | O.D.600 TECAN | O.D.600 Spectrophotometer | C.F.U. | Dilution Factor (10^) | N |
| C1 | 0,367950002 | 0,758004416 | 990 | 5 | 990000000 |
| C1 | 0,044649998 | 0,091982322 | 141 | 6 | 1410000000 |
| C1 | 0,004799999 | 0,009888356 | 136 | 5 | 136000000 |
| C1 | 0,000549998 | 0,001133037 | 20 | 6 | 200000000 |
| C2 | 0,54840003 | 1,129744917 | 165 | 4 | 16500000 |
| C2 | 0,058200002 | 0,119896339 | 23 | 5 | 23000000 |
| C2 | 0,008700002 | 0,017922652 | 251 | 3 | 2510000 |
| C2 | 0,000100002 | 0,000206011 | 24 | 4 | 2400000 |

The estimation of μ parameter was performed by determining the slope of the logarithmic curve of O.D.600 in exponential phase. Exponential phase was determined by visual inspection as the linear phase of the logarithmic curve of O.D.600.
The estimated parameters are summarized in the table below:
| Nmax [cell number] | μ [min-1] |
| 1*109 | 0.004925 |
The reported value of μ corresponds to a doubling time of 142 minutes.
Estimation of the spontaneous degradation of HSL in M9 medium and in cultures at different pH values
In order to estimate the spontaneous degradation rate of HSL in M9 medium and in a culture of MGZ1 cells as a function of pH, two simple tests have been performed.
Two different M9 media were prepared, one with the nominal pH (7.0) and one with pH=6.0.
These media, now named respectively M9pH 7 and M9pH 6, were added with a known concentration of HSL (100 nM) and then incubated at 37°C, 220 rpm (NB: the media were not infected with any culture but the standard growth conditions were reproduced). The amount of HSL present in the medium was assayed through the BBa_T9002 biosensor at 4 time points:
- t=0 h;
- t=1 h;
- t=2 h;
- t=4 h;
- t=8 h;
The obtained time series of HSL amounts were processed to evaluate the time constant governing the dynamic of HSL degradation, supposing an exponential decay. The results are reported in the table below:
| t1/2* [h] | γHSL** [h-1] | |
| M9pH 6 | 32 | 0.022 |
| M9pH 7 | 8 | 0.087 |
The described experiment was repeated with a MGZ1 culture in order to evaluate the effect of culture on HSL stability. The estimated values are reported in the table below:
| t1/2* [h] | γHSL** [h-1] | |
| CulturepH 6 | ∞ | 0 |
| CulturepH 7 | 19 | 0.037 |
It is evident from the reported data that the spontaneous degradation of HSL is negligible when CTRL+E is implemented in MGZ1 cells grown in M9 medium with pH=6.0 and pH=7.0.
Thus in the simulations we set γHSL=0;
Characterization of BBa_T9002 biosensor
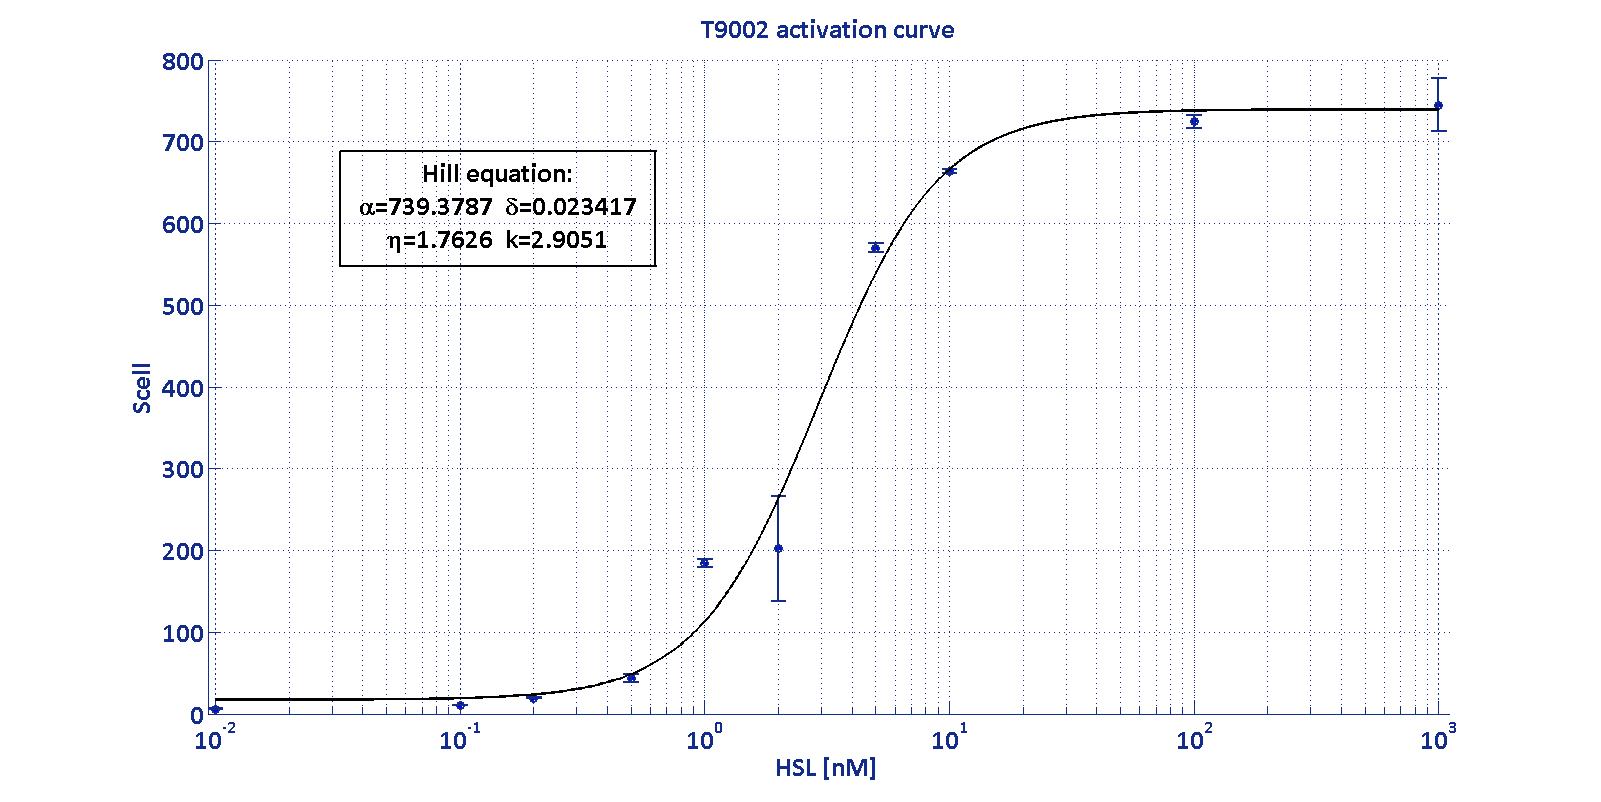
| Minimum [Scell] | Maximum [Scell] | Switch point [nM] | Lower boundary of linearity [nM] | Upper boundary of linearity [nM] |
| 17.31 | 739.4 | 1.39 | 0.38 | 5.07 |
Conclusions
To sum up the results of our project, we have characterized several basic parts and documented all of our experiments in the experience pages. All the data collected have been reported and synthetic parameters to describe the behavior of promoters, RBSs and genes have been provided. Such parameters can be used for the in silico simulation of mathematical models of complex circuits.
For what concerns CTRL+E, that is a proof of concept of the modular behavior of systems in synthetic biology, all the parameters of pTet, pLux and LuxI have been estimated. AiiA parameters revealed difficult to estimate.
Reasonable values for AiiA parameters have been derived from experiments in different contexts. These values were used to simulate the behavior of CTRL+E.
Further experiments are necessary to evaluate the consistence of the derived parameters for AiiA.
Once the most promising module combinations will be evaluated, a library of differently tuned controller will be built and characterized in order to assess the correspondence between the model predictions and the real data.