Team:UNIPV-Pavia/Measurements

From 2011.igem.org

(Difference between revisions)
 
(35 intermediate revisions not shown)
Line 2: Line 2:
<html>
<html>
-
<div class="cleared"></div>
 
-
<div class="art-postcontent">
 
-
<a name="top_page"></a>
 
 +
                                <h2 class="art-postheader">
 +
                Measurements
 +
                                </h2>
 +
                <div class="cleared"></div>
 +
                                <div class="art-postcontent">
 +
 +
<a name="top_page"></a>
 +
<br>
<table id="toc" class="toc"><tr><td><div id="toctitle"><h2>Contents</h2></div>
<ul>
<ul>
Line 12: Line 17:
<ul>
<ul>
-
<li class="toclevel-1"><a href="#pTet_protocol"><span class="tocnumber">1.1</span> <span class="toctext">pTet transcriptional strength</span></a>
+
<li class="toclevel-2"><a href="#pTet_protocol"><span class="tocnumber">1.1</span> <span class="toctext">pTet transcriptional strength</span></a>
-
<li class="toclevel-1"><a href="#pLux_protocol"><span class="tocnumber">1.2</span> <span class="toctext">pLux transcriptional strength</span></a>
+
<li class="toclevel-2"><a href="#pLux_protocol"><span class="tocnumber">1.2</span> <span class="toctext">pLux transcriptional strength</span></a>
-
<li class="toclevel-1"><a href="#j101_protocol"><span class="tocnumber">1.3</span> <span class="toctext">Constitutive BBa_J23101x promoters transcriptional strength</span></a>
+
<li class="toclevel-2"><a href="#j101_protocol"><span class="tocnumber">1.3</span> <span class="toctext">Constitutive BBa_J23101x promoters transcriptional strength</span></a>
</ul>
</ul>
Line 32: Line 37:
<li class="toclevel-2"><a href="#scell"><span class="tocnumber">3.3</span> <span class="toctext">Synthesis rate per cell (S<sub><small>cell</small></sub>) evaluation</span></a></li>
<li class="toclevel-2"><a href="#RPU"><span class="tocnumber">3.4</span> <span class="toctext">R.P.U. evaluation</span></a></li>
-
<li class="toclevel-2"><a href="#HSL"><span class="tocnumber">3.5</span> <span class="toctext">Extrapolating 3OC<sub><small>6</small></sub>-HSL concentration</span></a></li>
+
<li class="toclevel-2"><a href="#HSL"><span class="tocnumber">3.5</span> <span class="toctext">Assaying 3OC<sub><small>6</small></sub>-HSL concentration</span></a></li>
</ul>
</ul>
</td></tr></table>
</td></tr></table>
 +
<script>if (window.showTocToggle) { var tocShowText = "show"; var tocHideText = "hide"; showTocToggle(); } </script>
 +
<br>
</div>
</div>
 +
<br>
 +
<em>
 +
NB: unless differently specified, all tests were performed in <a href='https://2011.igem.org/Team:UNIPV-Pavia/Protocols#MG1655Z1'><em>E. coli</em> MGZ1</a> in M9 supplemented medium at 37°C.
 +
</em>
 +
<br><br><br>
 +
<div class="listcircle">
 +
<div align="justify">
 +
<a name="Promoters"></a> <h2 class="art-postheader">
Line 42: Line 57:
</h2>
</h2>
-
<div align="right"><small><a href="#top_page" title="">^top</a></small></div>
 
<a name="pTet_protocol"></a> <h2 class="art-postheader">
Line 49: Line 63:
<p>
<p>
<ol>
<ol>
-
<li> Streak long term storage glycerol stocks on a LB agar plate + Cm12.5, in order to have single colonies (don't forget positive and negative controls). Let them grow over night at 37°C.
+
<li> Streak long term storage glycerol stocks on a LB agar plate + Cm12.5, in order to have single colonies (don't forget positive and negative controls). Let them grow over night at 37°C.</p>
-
<li> Pick 3 colonies from each clone and inoculate it in 1 ml M9 + Cm12.5 in a falcon tube; let them grow over night at 37 °C, 220 rpm.
+
<li> Pick 3 colonies from each clone and inoculate it in 1 ml M9 + Cm12.5 in a falcon tube; let them grow over night at 37 °C, 220 rpm.</p>
-
<li> Dilute cultures 1:500 in 1 ml of M9 + Cm12.5 and let them grow at 37°C, 220 rpm for three hours.
+
<li> Dilute cultures 1:500 in 1 ml of M9 + Cm12.5 and let them grow at 37°C, 220 rpm for three hours.</p>
-
<li> Induce cultures in falcon tube with anhydrotetracycline (aTc); final concentrations:
+
<li> Induce cultures in falcon tube with anhydrotetracycline (aTc); final concentrations:</p>
<ul>
<ul>
<li> 0 ng/ml
<li> 0 ng/ml
Line 65: Line 79:
<li> 100 ng/ml
<li> 100 ng/ml
</ul>
</ul>
-
<li> Let the cultures grow at 37°C, 220 rpm for three hours.
+
<li> Let the cultures grow at 37°C, 220 rpm for three hours.</p>
-
<li> Aliquot 200 &mu;l of cultures in microplate wells and measure O.D. and fluorescence with Tecan Infinite F200 microplate reader. Set the automatic procedure:
+
<li> Aliquot 200 &mu;l of cultures in microplate wells and measure O.D. and fluorescence with Tecan Infinite F200 microplate reader. Set the automatic procedure:</p>
<ul>
<ul>
<li> temperature: 37°C
Line 79: Line 93:
</p>
</p>
-
<div align="right"><small><a href="#top_page" title="">^top</a></small></div>
+
<div align="right"><small><a href="#top_page">^top</a></small></div>
<a name="pLux_protocol"></a> <h2 class="art-postheader">
Line 114: Line 128:
</p>
</p>
-
<div align="right"><small><a href="#top_page" title="">^top</a></small></div>
+
<div align="right"><small><a href="#top_page">^top</a></small></div>
<a name="j101_protocol"></a> <h2 class="art-postheader">
Line 137: Line 151:
</p>
</p>
-
<div align="right"><small><a href="#top_page" title="">^top</a></small></div>
+
<div align="right"><small><a href="#top_page">^top</a></small></div>
<a name="Enzyme"></a> <h2 class="art-postheader">
Line 143: Line 157:
</h2>
</h2>
-
<div align="right"><small><a href="#top_page" title="">^top</a></small></div>
+
 
<a name="LuxI"></a> <h2 class="art-postheader">
Line 169: Line 183:
</p>
</p>
-
<div align="right"><small><a href="#top_page" title="">^top</a></small></div>
+
<div align="right"><small><a href="#top_page">^top</a></small></div>
<a name="AiiA"></a> <h2 class="art-postheader">
Line 197: Line 211:
</p>
</p>
-
<div align="right"><small><a href="#top_page" title="">^top</a></small></div>
+
<div align="right"><small><a href="#top_page">^top</a></small></div>
<a name="Deg"></a> <h2 class="art-postheader">
Line 219: Line 233:
</p>
</p>
-
<div align="right"><small><a href="#top_page" title="">^top</a></small></div>
+
<div align="right"><small><a href="#top_page">^top</a></small></div>
<a name="T9002"></a> <h2 class="art-postheader">
-
Measuring 3OC<sub><small>6</small></sub>-HSL concentration withBBa_T9002
+
Measuring 3OC<sub><small>6</small></sub>-HSL concentration with BBa_T9002
</h2>
</h2>
<p>
<p>
Line 255: Line 269:
</p>
</p>
-
<div align="right"><small><a href="#top_page" title="">^top</a></small></div>
+
<div align="right"><small><a href="#top_page">^top</a></small></div>
<a name="data_analysis"></a> <h2 class="art-postheader">
Line 261: Line 275:
</h2>
</h2>
-
<div align="right"><small><a href="#top_page" title="">^top</a></small></div>
 
<a name="preprocessing"></a> <h2 class="art-postheader">
Line 269: Line 282:
Data from TECAN Infinite F200 need to be pre-processed in order to remove spurious effects affecting measurements. Before evaluating the parameters of interest (for example the synthesis rate per cell, S<sub><small>cell</small></sub>, or Relative Promoter Unit, R.P.U.) blanking is needed:
<ol><ul>
<ol><ul>
-
<li> each time sample of O.D. at 600 nm, (O.D.<sub><small>600</small></sub>) was subtracted the reference value (i.e. the measure of O.D. at 600 nm of the broth in which cultures grow)
+
<li> the reference value (i.e. the measure of O.D. at 600 nm of the broth in which cultures grow) was subtracted from each sample of O.D. at 600 nm, (O.D.<sub><small>600</small></sub>)
-
<li> each time sample of red and green fluorescence was subtracted the reference value (i.e. the red or green fluorescence of a non-fluorescent culture)
+
<li> the reference value (i.e. the red or green fluorescence of a non-fluorescent culture, also known as auto-fluorescence) was also subtracted from each sample of red and green fluorescence
</ul></ol>
</ul></ol>
</p>
</p>
-
 
+
<div align="right"><small><a href="#top_page">^top</a></small></div>
-
<div align="right"><small><a href="#top_page" title="">^top</a></small></div>
+
<a name="doubtime"></a> <h2 class="art-postheader">
Line 285: Line 297:
</p>
</p>
-
<div class="center"><div class="thumbinner" style="width: 400px;"><a href="/File:UNIPV_DoubTime.PNG" class="image"><img alt="" src="https://static.igem.org/mediawiki/2011/7/7d/UNIPV_DoubTime.PNG"class="thumbimage" height="80%" width="80%"></a></div></div>
+
<div class="center"><div class="thumbinner" style="width: 300px;"><a href="https://static.igem.org/mediawiki/2011/7/7d/UNIPV_DoubTime.PNG" class="image"><img alt="" src="https://static.igem.org/mediawiki/2011/7/7d/UNIPV_DoubTime.PNG"class="thumbimage" width="80%"></a></div></div>
Line 292: Line 304:
</p>
</p>
-
<div align="right"><small><a href="#top_page" title="">^top</a></small></div>
+
<div align="right"><small><a href="#top_page">^top</a></small></div>
Line 304: Line 316:
</p>
</p>
-
<div class="center"><div class="thumbinner" style="width: 300px;"><a href="/File:UNIPV_Scell.PNG" class="image"><img alt="" src="https://static.igem.org/mediawiki/2011/c/c5/UNIPV_Scell.PNG"class="thumbimage" height="80%" width="80%"></a></div></div>
+
<div class="center"><div class="thumbinner" style="width: 225px;"><a href="https://static.igem.org/mediawiki/2011/c/c5/UNIPV_Scell.PNG" class="image"><img alt="" src="https://static.igem.org/mediawiki/2011/c/c5/UNIPV_Scell.PNG"class="thumbimage" width="80%"></a></div></div>
<p>
<p>
Line 310: Line 322:
</p>
</p>
-
<div align="right"><small><a href="#top_page" title="">^top</a></small></div>
+
<div align="right"><small><a href="#top_page">^top</a></small></div>
<a name="RPU"></a> <h2 class="art-postheader">
Line 316: Line 328:
</h2>
</h2>
<p>
<p>
-
As described in Kelly J. et al., 2009, Relative Promoter Units express the activity of a promoter of interest (&phi;), reported to the one of a reference promoter, <a href="http://partsregistry.org/Part:BBa_J23101">BBa_J23101</a> (from Anderson promoters collection):
+
As described in Kelly J. et al., 2009, Relative Promoter Units express the activity of a promoter of interest (&phi;), reported to the one of a reference promoter, <a href="http://partsregistry.org/Part:BBa_J23101">BBa_J23101</a> (from Anderson promoters collection). The R.P.U. of a promoter is expressed as the ratio between its S<sub><small>cell</small></sub> and the one of <a href="http://partsregistry.org/Part:BBa_J23101">BBa_J23101</a>:
</p>
</p>
-
<div class="center"><div class="thumbinner" style="width: 300px;"><a href="/File:UNIPV_RPU.PNG" class="image"><img alt="" src="https://static.igem.org/mediawiki/2011/7/70/UNIPV_RPU.PNG"class="thumbimage" height="80%" width="80%"></a></div></div>
+
<div class="center"><div class="thumbinner" style="width: 250px;"><a href="https://static.igem.org/mediawiki/2011/7/70/UNIPV_RPU.PNG" class="image"><img alt="" src="https://static.igem.org/mediawiki/2011/7/70/UNIPV_RPU.PNG"class="thumbimage" width="80%"></a></div></div>
<p>
<p>
-
This procedure has the advantage of being robust to variations in experimental conditions and proportional to PoPS (Polymerase Per Second) if the subsequent specifications are satisfied:
+
This procedure has the advantage of being robust to variations in experimental conditions (for example the instrument used to measure absorbance and fluorescence) and proportional to PoPS (Polymerase Per Second) if the subsequent specifications are satisfied:
<ol><ul>
<ol><ul>
<li> strain, plasmid copy number, antibiotic, growth medium, growth conditions, protein generator assembled downstream of the promoter must be the same in the promoter of interest and in BBa_J23101 reference standard
<li> the reporter protein must have a half life higher than the experiment duration
</ul></ol>
</ul></ol>
-
Moreover the S<sub><small>cell</small></sub> signal of both the promoter of interest and of BBa_J23101 has tp be at the steady state.
+
Moreover the S<sub><small>cell</small></sub> signal of both the promoter of interest and of BBa_J23101 has to be constant on the time interval considered for R.P.U. evaluation.
</p>
</p>
-
<div align="right"><small><a href="#top_page" title="">^top</a></small></div>
+
<div align="right"><small><a href="#top_page">^top</a></small></div>
<a name="HSL"></a> <h2 class="art-postheader">
-
Extrapolating 3OC<sub><small>6</small></sub>-HSL concentration
+
Assaying 3OC<sub><small>6</small></sub>-HSL concentration
</h2>
</h2>
<p>
<p>
Line 340: Line 352:
Once collected (according to the <a href = "#T9002">protocol above</a>) and pre-processed data, it is necessary to compute the S<sub><small>cell</small></sub> of every culture.
<br>
<br>
-
BBa_T9002 induced with known 3OC<small><sub>6</sub></small>-HSL concentration is useful to estimate the parameters of the activation Hill function of pLux promoter:
+
BBa_T9002 induced with known 3OC<small><sub>6</sub></small>-HSL concentrations is useful to estimate the parameters of the activation Hill function of pLux promoter. In this way, for each of our tests, we were able to build a calibration curve for the biosensor:
</p>
</p>
-
<div class="center"><div class="thumbinner" style="width: 300px;"><a href="/File:UNIPV_activation_pLux.png" class="image"><img alt="" src="https://static.igem.org/mediawiki/2011/f/f2/UNIPV_activation_pLux.png"class="thumbimage" height="80%" width="80%"></a></div></div>
+
<div class="center"><div class="thumbinner" style="width: 350px;"><a class="image"><a href="https://static.igem.org/mediawiki/2011/b/b1/Scell_plux.jpg"><img alt="" src="https://static.igem.org/mediawiki/2011/b/b1/Scell_plux.jpg" class="thumbimage" width="100%" height="70%"></a></div></div>
<p>
<p>
-
Provided that the S<sub><small>cell</small></sub> measured for BBa_T9002 induced with supernatants of cultures producing or degrading 3OC<small><sub>6</sub></small>-HSL has a value included in the linear zone of the biosensor (tuning of the dilution factor is necessary), you can easily extrapolate the auto-inducer concentration as follows:
+
Provided that the S<sub><small>cell</small></sub> measured for BBa_T9002 induced with supernatants of cultures producing or degrading 3OC<small><sub>6</sub></small>-HSL has a value included in the linear zone of the biosensor (tuning of the dilution factor is necessary), you can easily evaluate the auto-inducer concentration as follows:
</p>
</p>
-
<div class="center"><div class="thumbinner" style="width: 300px;"><a href="/File:UNIPV_HSL.PNG" class="image"><img alt="" src="https://static.igem.org/mediawiki/2011/e/e2/UNIPV_HSL.PNG"class="thumbimage" height="80%" width="80%"></a></div></div>
+
<div class="center"><div class="thumbinner" style="width: 650px;"><a href="https://static.igem.org/mediawiki/2011/e/e2/UNIPV_HSL.PNG" class="image"><img alt="" src="https://static.igem.org/mediawiki/2011/e/e2/UNIPV_HSL.PNG"class="thumbimage" width="40%"></a></div></div>
<p>
<p>
-
Finally, don't forget to multiply this value for the dilution factor (in our experiments it was 20).
+
Finally, don't forget to multiply the value obtained for the dilution factor (in our experiments it was 20).
</p>
</p>
-
<div align="right"><small><a href="#top_page" title="">^top</a></small></div>
+
<div align="right"><small><a href="#top_page">^top</a></small></div>
Line 370: Line 382:
<p style="text-align:left;">
 +
</div>
 +
</div>
</html>
</html>
{{end}}
{{end}}

Latest revision as of 00:40, 22 September 2011

UNIPV TEAM 2011

Measurements


Contents


NB: unless differently specified, all tests were performed in E. coli MGZ1 in M9 supplemented medium at 37°C.


Measuring promoters transcriptional strength

Measuring pTet transcriptional strength

  1. Streak long term storage glycerol stocks on a LB agar plate + Cm12.5, in order to have single colonies (don't forget positive and negative controls). Let them grow over night at 37°C.

  2. Pick 3 colonies from each clone and inoculate it in 1 ml M9 + Cm12.5 in a falcon tube; let them grow over night at 37 °C, 220 rpm.

  3. Dilute cultures 1:500 in 1 ml of M9 + Cm12.5 and let them grow at 37°C, 220 rpm for three hours.

  4. Induce cultures in falcon tube with anhydrotetracycline (aTc); final concentrations:

    • 0 ng/ml
    • 1 ng/ml
    • 2 ng/ml
    • 3 ng/ml
    • 4 ng/ml
    • 5 ng/ml
    • 8 ng/ml
    • 10 ng/ml
    • 50 ng/ml
    • 100 ng/ml
  5. Let the cultures grow at 37°C, 220 rpm for three hours.

  6. Aliquot 200 μl of cultures in microplate wells and measure O.D. and fluorescence with Tecan Infinite F200 microplate reader. Set the automatic procedure:

    • temperature: 37°C
    • sampling time: 5 minutes
    • 15 seconds of linear shaking (3 mm amplitude) followed by 5 seconds waiting before measurements
    • fluorescence gain: 50 - 80
    • O.D. filter: 600 nm
    • RFP filters: 535 nm (excitation) / 620 nm (emission)
    • duration time: 10 - 15 hours

Measuring pLux transcriptional strength

  1. Streak long term storage glycerol stocks on a LB agar plate + Cm12.5, in order to have single colonies (don't forget positive and negative controls). Let them grow over night at 37°C.
  2. Pick 3 colonies from each clone and inoculate it in 1 ml M9 + Cm12.5 in a falcon tube; let them grow over night at 37°C, 220 rpm.
  3. Dilute cultures 1:500 in 1 ml of M9 + Cm12.5 and let them grow for three hours at 37°C, 220 rpm.
  4. Induce cultures in falcon tube with 3OC6-HSL; final concentrations:
    • 0 M
    • 0.1 nM
    • 0.5 nM
    • 1 nM
    • 2 nM
    • 5 nM
    • 10 nM
    • 100 nM
  5. Let the cultures grow for three hours at 37°C, 220 rpm.
  6. Aliquot 200 μl of cultures in microplate wells and measure O.D. and fluorescence with Tecan Infinite F200 microplate reader. Set the automatic procedure:
    • temperature: 37°C
    • sampling time: 5 minutes
    • 15 seconds of linear shaking (3 mm amplitude) followed by 5 seconds waiting before measurements
    • fluorescence gain: 50 - 80
    • O.D. filter: 600 nm
    • RFP filters: 535 nm (excitation) / 620 nm (emission)
    • duration time: 10 - 15 hours

Constitutive BBa_J23101x promoters transcriptional strength

  1. Streak long term storage glycerol stocks on a LB agar plate + Cm12.5, in order to have single colonies (don't forget positive and negative controls). Let them grow over night at 37°C.
  2. Pick 3 colonies from each clone and inoculate it in 1 ml M9 + Cm12.5 in a falcon tube; let them grow over night at 37 °C, 220 rpm.
  3. Dilute cultures 1:500 in 1 ml of M9 + Cm12.5 and let them grow at 37°C, 220 rpm for six hours.
  4. Aliquot 200 μl of cultures in microplate wells and measure O.D. and fluorescence with Tecan Infinite F200 microplate reader. Set the automatic procedure:
    • temperature: 37°C
    • sampling time: 5 minutes
    • 15 seconds of linear shaking (3 mm amplitude) followed by 5 seconds waiting before measurements
    • fluorescence gain: 50 - 80
    • O.D. filter: 600 nm
    • RFP filters: 535 nm (excitation) / 620 nm (emission)
    • duration time: 10 - 15 hours

Measuring 3OC6-HSL synthesis and degradation

LuxI enzyme activity

  1. Inoculate 5 μl of long term glycerol stocks in 1 ml of M9 + Cm12.5 and let the cultures grow over night at 37°C, 220 rpm.
  2. Dilute cultures 1:100 in 4 ml M9 + Cm12.5 in falcon tubes and grow them for two hours at 37°C, 220 rpm.
  3. Induce cultures with aTc; final concentrations:
    • 6 ng/ml
    • 8 ng/ml
    • 100 ng/ml
  4. Collect supernatants (measuring the O.D. at 600 nm) at the moment of induction, after 1 hour, 2 hours and 4 hours by:
    • take 250 μl of cultures
    • centrifuge them 13.300 rpm, 4 minutes
    • collect 200μl of supernatants (without resupsending the pelleted bacteria)
    • let the cultures grow at 37°C, 220 rpm until the next sampling
  5. Store supernatants at -20°C and measure 3OC6-HSL concentration according to the protocol based on BBa_T9002 biosensor.

AiiA enzyme activity

  1. Inoculate 5 μl of long term glycerol stocks in 1 ml of M9 + Cm12.5 and let the cultures grow over night at 37°C, 220 rpm.
  2. Dilute cultures 1:100 in 4 ml M9 + Cm12.5 in falcon tubes and let them grow for two hours at 37°C, 220 rpm.
  3. Induce cultures with aTc; final concentrations:
    • 6 ng/ml
    • 8 ng/ml
    • 100 ng/ml
  4. Let the cultures grow for one more hour at 37°C, 220 rpm.
  5. Add 100 nM 3OC6-HSL.
  6. Collect supernatants (measuring the O.D. at 600 nm) at the moment of 3OC6-HSL addition, after 1 hour, 2 hours and 4 hours by:
    • take 250 μl of cultures
    • centrifuge them 13.300 rpm, 4 minutes
    • collect 200μl of supernatants (without resupsending the pelleted bacteria)
    • let the cultures grow at 37°C, 220 rpm until the next sampling
  7. Store supernatants at -20°C and measure 3OC6-HSL concentration according to the protocol based on BBa_T9002 biosensor.

3OC6-HSL degradation in M9 medium and cultures not expressing lactonases varying pH

  1. Inoculate 5 μl of long term glycerol stocks not expressing lactonases in 1 ml of M9 with the proper antibiotic. Use M9 at different pHs, for example pH = 6.0 and pH = 7.0. Let the cultures grow over night at 37°C, 220 rpm.
  2. Dilute cultures 1:100 in 4 ml M9 with the proper antibiotic in falcon tubes and let them grow for two hours at 37°C, 220 rpm.
  3. Prepare falcon tubes with M9 at pH = 6.0 and pH = 7.0.
  4. Add 100 nM 3OC6-HSL to each falcon tube.
  5. Collect supernatants (measuring the O.D. at 600 nm) at the moment of 3OC6-HSL addition, after 1 hour, 2 hours and 4 hours by:
    • take 250 μl of cultures
    • centrifuge them 13.300 rpm, 4 minutes
    • collect 200μl of supernatants (without resupsending the pelleted bacteria)
    • let the cultures grow at 37°C, 220 rpm until the next sampling
  6. Store supernatants at -20°C and measure 3OC6-HSL concentration according the protocol based on BBa_T9002 biosensor.

Measuring 3OC6-HSL concentration with BBa_T9002

  1. Inoculate 5 μl BBa_T9002 in 1 ml M9 with the proper antibiotic (Ampicillin when you use BBa_T9002 or Ampicillin + Chloramphenicol 12.5 mg/ml if you use T9002-ENTERO, see Freezer Management) together with a non-fluorescent culture; let them grow over night at 37°C, 220 rpm.
  2. Dilute cultures 1:100 in M9 with the proper antibiotic; let the cultures grow for two hours at 37°C, 220 rpm.
  3. Induce BBa_T9002 cultures with the previously collected supernatants, diluting them 1:20: aliquot 190μl of inducible cultures and 10 μl of supernatants in the wells of the microplate.
  4. Don't forget to build a calibration curve, by inducing BBa_T9002 cultures with known 3OC6-HSL concentrations:
    • 0 M
    • 0.1 nM
    • 0.2 nM
    • 0.5 nM
    • 1 nM
    • 2 nM
    • 5 nM
    • 10 nM
    • 100 nM
    • 1 μM
  5. Use Tecan Infinite F200 to read O.D. at 600 nm and green fluorescence, setting the automatic procedure:
    • temperature: 37°C
    • sampling time: 5 minutes
    • 15 seconds of linear shaking (3 mm amplitude) followed by 5 seconds waiting before measurements
    • fluorescence gain: 50
    • O.D. filter: 600 nm
    • GFP filters: 485 nm (excitation) / 540 nm (emission)
    • duration time: 10 - 15 hours

Data analysis

Data pre-processing

Data from TECAN Infinite F200 need to be pre-processed in order to remove spurious effects affecting measurements. Before evaluating the parameters of interest (for example the synthesis rate per cell, Scell, or Relative Promoter Unit, R.P.U.) blanking is needed:

    • the reference value (i.e. the measure of O.D. at 600 nm of the broth in which cultures grow) was subtracted from each sample of O.D. at 600 nm, (O.D.600)
    • the reference value (i.e. the red or green fluorescence of a non-fluorescent culture, also known as auto-fluorescence) was also subtracted from each sample of red and green fluorescence

Doubling time evaluation

After blanking O.D.600 data you can compute the doubling time of cultures growth, i.e. the time needed to double O.D.600.
Identifying the exponential phase of growth curve can be done by visual inspection, plotting the natural logarithm of O.D.600 over time. Linear regression on logarithmic data is performed to estimate the growth rate, named μ. Finally doubling time can be evaluated as:

When measuring multiple growth for a strain this value was evaluated for each reaplicate and then average was computed.

Synthesis rate per cell (Scell) evaluation

Another interesting parameter, which describes the activity of a promoter of interest (φ), is the Scell; it needs to be measured using reporter genes as RFP or GFP.
Compute the average of the time derivative of the red or green fluorescence, divided by the O.D.600, in the time interval corresponding to the exponential growth phase which boundaries can be identified by visual inspection of the logarithmic growth curve:

The Scell is basic to measure the Relative Promoter Unit, a robust parameter expressing the transcriptional activity of a promoter.

R.P.U. evaluation

As described in Kelly J. et al., 2009, Relative Promoter Units express the activity of a promoter of interest (φ), reported to the one of a reference promoter, BBa_J23101 (from Anderson promoters collection). The R.P.U. of a promoter is expressed as the ratio between its Scell and the one of BBa_J23101:

This procedure has the advantage of being robust to variations in experimental conditions (for example the instrument used to measure absorbance and fluorescence) and proportional to PoPS (Polymerase Per Second) if the subsequent specifications are satisfied:

    • strain, plasmid copy number, antibiotic, growth medium, growth conditions, protein generator assembled downstream of the promoter must be the same in the promoter of interest and in BBa_J23101 reference standard
    • the reporter protein must have a half life higher than the experiment duration
Moreover the Scell signal of both the promoter of interest and of BBa_J23101 has to be constant on the time interval considered for R.P.U. evaluation.

Assaying 3OC6-HSL concentration

The procedure described below is useful in order to quantify the concentration of 3OC6-HSL in cultures expressing LuxI and AiiA enzyme.
Once collected (according to the protocol above) and pre-processed data, it is necessary to compute the Scell of every culture.
BBa_T9002 induced with known 3OC6-HSL concentrations is useful to estimate the parameters of the activation Hill function of pLux promoter. In this way, for each of our tests, we were able to build a calibration curve for the biosensor:

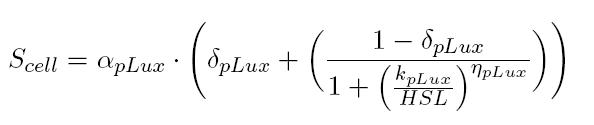
Provided that the Scell measured for BBa_T9002 induced with supernatants of cultures producing or degrading 3OC6-HSL has a value included in the linear zone of the biosensor (tuning of the dilution factor is necessary), you can easily evaluate the auto-inducer concentration as follows:

Finally, don't forget to multiply the value obtained for the dilution factor (in our experiments it was 20).

Retrieved from "http://2011.igem.org/Team:UNIPV-Pavia/Measurements"