Team:Edinburgh/Phage Replication
From 2011.igem.org
| (81 intermediate revisions not shown) | |||
| Line 5: | Line 5: | ||
<div class="main_body"> | <div class="main_body"> | ||
| - | + | <p class="h1">Phage Replication</p> | |
| - | == | + | A basic activity in our biorefinery is the degradation of <span class="hardword" id="cellulose">cellulose</span>, due to the presence of enzymes. For our [[Team:Edinburgh/Phage_Display | phage system]], we are not only concerned with the activities and amount of enzymes, but also with the metabolism and activities of <span class="hardword" id="phage">bacteriophage</span>. |
| + | In particular, it would be good to verify that infected ''E. coli'' in the system don't get outcompeted and die out, since they are necessary for the system to work. | ||
| - | *The M13 phage attacks ''E. coli'' (host), multiplies in the host cell cytoplasm, and is released without causing the | + | == M13 Replication == |
| + | <span class="hardword" id="m13">M13</span> is a filamentous bacteriophage: a worm-like virus approximately 1 um long with a 10 nm diameter that infects only ''E. coli''. | ||
| + | *The viral particle consists of a single-stranded, closed circular DNA core surrounded by a protein coat. | ||
| + | *Prior to virus assembly, the coat proteins are fixed in the bacterial membrane by transmembrane domains. | ||
| + | *During assembly, viral DNA is extruded through the membrane and enveloped by coat proteins. | ||
| + | *The ends of the assembled virus are capped by four minor coat proteins, and the length of the filament is covered by several thousand copies of the major coat protein <span class="hardword" id="p8">pVIII</span>. | ||
| + | *The M13 phage attacks ''E. coli'' (host), multiplies in the host cell cytoplasm, and is released without causing the bacteria's death (non-lytic). | ||
| + | == Model construction == | ||
| - | + | As a fundamental rule, '''the rate of change of population = production rate of population - loss rate of population''' | |
| + | Model for non-lytic M13 phage: | ||
| - | + | [[File:Edinburgh-phagerepcycle.png|center|thumb|655px|caption|]] | |
| - | *dx/dt= | + | == Equations == |
| + | |||
| + | *'''dx/dt=a*k1*x-b*v*x ''' | ||
| - | : | + | : The rate of change in the number of uninfected ''E. coli'' equals the rate at which they replicate, minus the rate at which they become infected by phage. |
| - | *dy/dt= | + | *'''dy/dt=a*k2*y+b*v*x ''' |
| - | : | + | : The rate of change in the number of infected ''E. coli'' equals the rate at which they replicate, plus the rate at which uninfected ''E. coli'' become infected by phage. |
| - | *dv/dt= | + | *'''dv/dt=c*y-b*v*x-m*v ''' |
| - | : | + | : The rate of change in the number of free phage equals the rate at which phage are released by infected ''E. coli'', minus the rate at which phage infect ''E. coli'', and also minus the rate at which phage decay. |
| - | + | ||
: X(t) — uninfected ''E. coli'' | : X(t) — uninfected ''E. coli'' | ||
| Line 38: | Line 48: | ||
: c — replication coefficient of phage | : c — replication coefficient of phage | ||
: m — decay rate of phage | : m — decay rate of phage | ||
| + | : K1, K2 — account for the difference of the rate of replication between infected ''E. coli'' and uninfected ''E. coli'' | ||
| - | + | == Simulations == | |
| - | + | ||
| + | The [[:File:Matlab_code_phagerep.txt | MATLAB code]] uses a <span class="hardword" id="rk">Runge-Kutta method</span> of order four to solve the system. | ||
| - | + | We tried modelling a number of different starting conditions. | |
| - | + | [[File:Phage dyn.jpg|center|thumb|700px|caption|Figure1 simulation value: x0=2.00E3 y0=v0=2.00E5]] | |
| - | [[File:Phage | + | |
| - | The above figure shows | + | The simulation above starts with the condition that the amount of uninfected ''E. coli'' is significantly smaller than the other two. The quantity of uninfected ''E. coli'' stays at a low level, which may have economic significance in practice, since our goal is to get free displayed phage. Besides, the figure also shows that the infected ''E. coli'' population dominates the population of free phage. |
| - | + | ||
| + | [[File:Phage dyn2.jpg|center|thumb|700px|caption|Figure2 simulation value: x0=v0=2.00E5 y0=2.00E3]] | ||
| + | |||
| + | In the above case, we start with a large excess of uninfected ''E. coli''. This results in a large number of phage infecting ''E. coli'' rather than staying free. Therefore, over 15 hours, this simulation produces the least free phage. However, the rate at which free phage are created rises significantly in this case; this is probably because a large number of phage infect ''E. coli'', all of which can release free phage later. | ||
| + | |||
| + | [[File:Phage dyn3.jpg|center|thumb|700px|caption|Figure3 simulation value: x0=y0=v0=2.00E5]] | ||
| + | |||
| + | In the above simulation, we start with large numbers of both infected and uninfected ''E. coli''. As the population of free phage increases, more ''E. coli'' are infected by phage. In the first 8 hours, the number of uninfected ''E. coli'' stops rising and begins to fall. After 15 hours, this simulation has produced the most free phage. | ||
| + | |||
| + | From these results it is evident that the population of the bacteriophage M13 primarily depends on the the population of infected ''E. coli'', which is the host of bacteriophage. Additionly, the slowing down of bacterial metabolism seems to have little effect on the reproduction of phage. | ||
== References == | == References == | ||
| + | * Cattoen C (2003) ''[http://msor.victoria.ac.nz/twiki/pub/Groups/GravityGroup/PreviousProjectsInAppliedMathematics/bacteria-phage_REPORT.pdf Bacteriaphage mathematical model applied to the cheese industry]'', Massey University, College of Sciences. | ||
| + | * Gregory AW, Sachdev SS (2000) [http://dx.doi.org/10.1006/jmbi.2000.3845 Design and Evolution of Artificial M13 coat Proteins], ''Journal of Molecular Biology'', '''300'''(1): 213-219, doi: 10.1006/jmbi.2000.3845 | ||
| + | * Payne RJH, jansen VAA (2001) [http://dx.doi.org/doi:10.1006/jtbi.2000.2198 Understanding Bacteriaphage therapy as a density-dependent kinetic process], ''Journal of Theoretical Biology'', '''208'''(1): 37-48, doi:10.1006/jtbi.2000.2198 | ||
* Slonczewski JL, Foster JW (2010) ''[http://www.wwnorton.com/college/biology/microbiology2/ch/11/etopics.aspx Microbiology: An Evolving Science]'', 2nd edition. W. W. Norton & Company | * Slonczewski JL, Foster JW (2010) ''[http://www.wwnorton.com/college/biology/microbiology2/ch/11/etopics.aspx Microbiology: An Evolving Science]'', 2nd edition. W. W. Norton & Company | ||
| - | |||
| - | |||
| - | |||
</div> <!-- /main_body--> | </div> <!-- /main_body--> | ||
<html></div> <!-- /mids --></html> | <html></div> <!-- /mids --></html> | ||
Latest revision as of 16:26, 3 October 2011
Phage Replication
A basic activity in our biorefinery is the degradation of cellulose, due to the presence of enzymes. For our phage system, we are not only concerned with the activities and amount of enzymes, but also with the metabolism and activities of bacteriophage.
In particular, it would be good to verify that infected E. coli in the system don't get outcompeted and die out, since they are necessary for the system to work.
Contents |
M13 Replication
M13 is a filamentous bacteriophage: a worm-like virus approximately 1 um long with a 10 nm diameter that infects only E. coli.
- The viral particle consists of a single-stranded, closed circular DNA core surrounded by a protein coat.
- Prior to virus assembly, the coat proteins are fixed in the bacterial membrane by transmembrane domains.
- During assembly, viral DNA is extruded through the membrane and enveloped by coat proteins.
- The ends of the assembled virus are capped by four minor coat proteins, and the length of the filament is covered by several thousand copies of the major coat protein pVIII.
- The M13 phage attacks E. coli (host), multiplies in the host cell cytoplasm, and is released without causing the bacteria's death (non-lytic).
Model construction
As a fundamental rule, the rate of change of population = production rate of population - loss rate of population
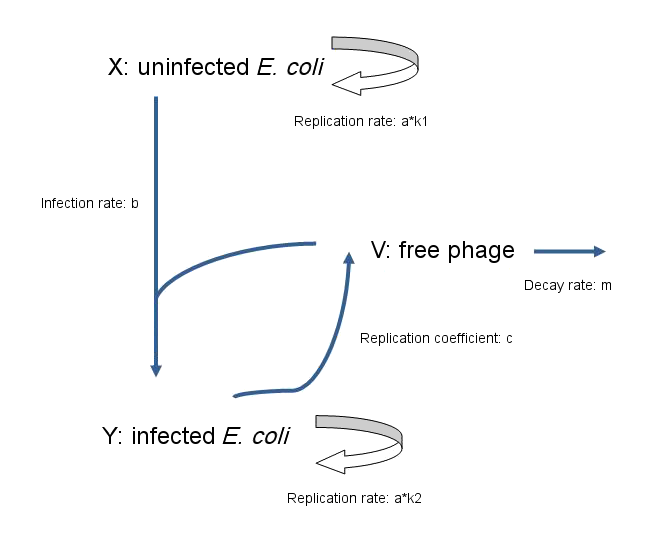
Model for non-lytic M13 phage:
Equations
- dx/dt=a*k1*x-b*v*x
- The rate of change in the number of uninfected E. coli equals the rate at which they replicate, minus the rate at which they become infected by phage.
- dy/dt=a*k2*y+b*v*x
- The rate of change in the number of infected E. coli equals the rate at which they replicate, plus the rate at which uninfected E. coli become infected by phage.
- dv/dt=c*y-b*v*x-m*v
- The rate of change in the number of free phage equals the rate at which phage are released by infected E. coli, minus the rate at which phage infect E. coli, and also minus the rate at which phage decay.
- X(t) — uninfected E. coli
- Y(t) — infected E. coli
- V(t) — free phage
- a — replication coefficient of E. coli
- b — transmission coefficient of phage
- c — replication coefficient of phage
- m — decay rate of phage
- K1, K2 — account for the difference of the rate of replication between infected E. coli and uninfected E. coli
Simulations
The MATLAB code uses a Runge-Kutta method of order four to solve the system.
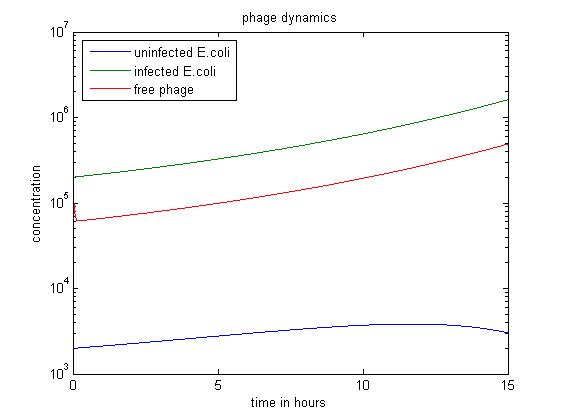
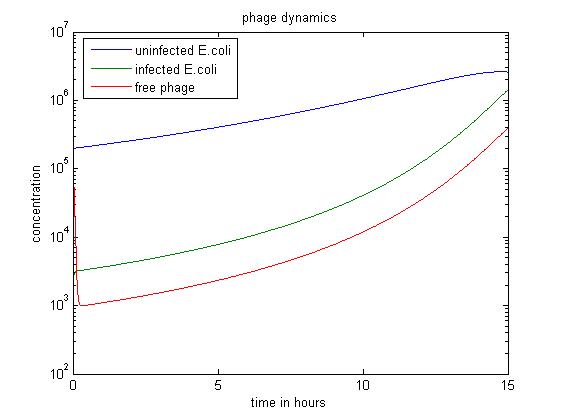
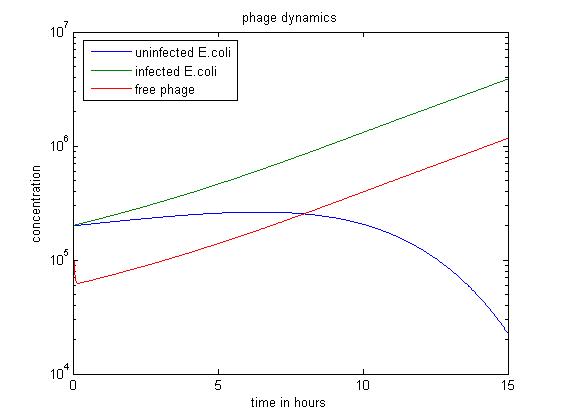
We tried modelling a number of different starting conditions.
The simulation above starts with the condition that the amount of uninfected E. coli is significantly smaller than the other two. The quantity of uninfected E. coli stays at a low level, which may have economic significance in practice, since our goal is to get free displayed phage. Besides, the figure also shows that the infected E. coli population dominates the population of free phage.
In the above case, we start with a large excess of uninfected E. coli. This results in a large number of phage infecting E. coli rather than staying free. Therefore, over 15 hours, this simulation produces the least free phage. However, the rate at which free phage are created rises significantly in this case; this is probably because a large number of phage infect E. coli, all of which can release free phage later.
In the above simulation, we start with large numbers of both infected and uninfected E. coli. As the population of free phage increases, more E. coli are infected by phage. In the first 8 hours, the number of uninfected E. coli stops rising and begins to fall. After 15 hours, this simulation has produced the most free phage.
From these results it is evident that the population of the bacteriophage M13 primarily depends on the the population of infected E. coli, which is the host of bacteriophage. Additionly, the slowing down of bacterial metabolism seems to have little effect on the reproduction of phage.
References
- Cattoen C (2003) [http://msor.victoria.ac.nz/twiki/pub/Groups/GravityGroup/PreviousProjectsInAppliedMathematics/bacteria-phage_REPORT.pdf Bacteriaphage mathematical model applied to the cheese industry], Massey University, College of Sciences.
- Gregory AW, Sachdev SS (2000) [http://dx.doi.org/10.1006/jmbi.2000.3845 Design and Evolution of Artificial M13 coat Proteins], Journal of Molecular Biology, 300(1): 213-219, doi: 10.1006/jmbi.2000.3845
- Payne RJH, jansen VAA (2001) [http://dx.doi.org/doi:10.1006/jtbi.2000.2198 Understanding Bacteriaphage therapy as a density-dependent kinetic process], Journal of Theoretical Biology, 208(1): 37-48, doi:10.1006/jtbi.2000.2198
- Slonczewski JL, Foster JW (2010) [http://www.wwnorton.com/college/biology/microbiology2/ch/11/etopics.aspx Microbiology: An Evolving Science], 2nd edition. W. W. Norton & Company
 "
"


