Team:Washington/Alkanes/Results
From 2011.igem.org
| Line 3: | Line 3: | ||
=GSNS Analysis Shows Alkane Production Works= | =GSNS Analysis Shows Alkane Production Works= | ||
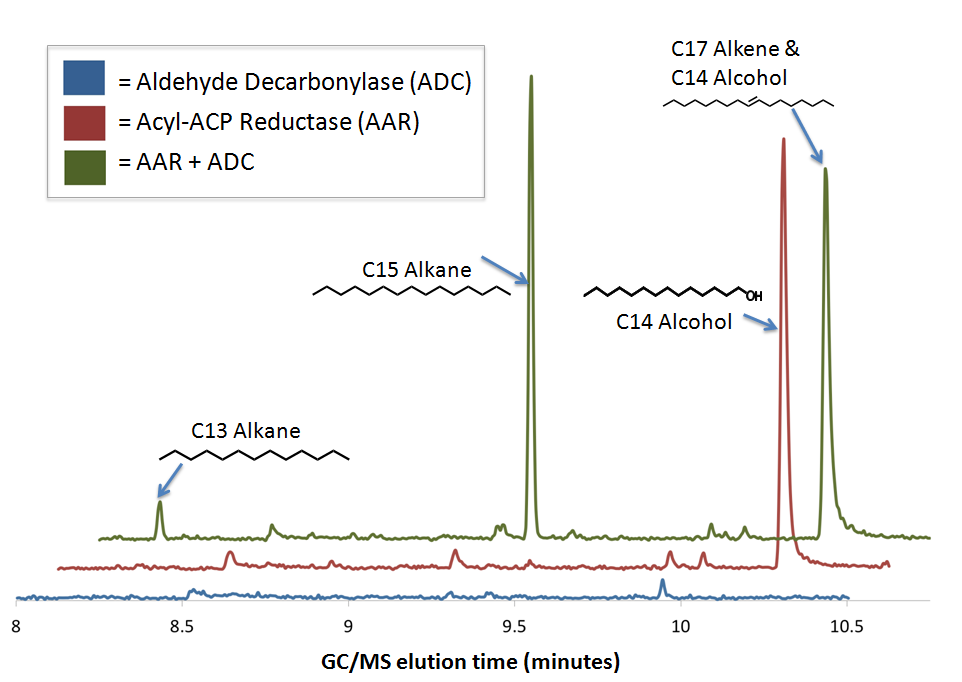
| - | == | + | We preformed GC-MS analysis on cell cultures expressing both Acyl-ACP reductase(AAR) and Aldehyde Decarbonylase(ADC). to act as controls and in order to show that the alkane production system is working as expected, we also analyzed cell cultures expressing either only AAR, or only ADC. |
| + | [[File:Washinton_AARADCGC-MS.png|center|700px|thumb|GC plot showing that alkanes are only produced when both ADC and AAR are expressed.]] | ||
| + | |||
| + | ===No significant hydrocarbons peaks in samples extracted from cells expressing only ADC=== | ||
| + | No significant peaks are found on the ADC-Only control GC plot within the time range that we expect alkane signal based upon GC-MS runs on chemical standards (8-10.5 minutes). This is expected, as ''E. coli'' does not normally produce any long chain length aldehyde substrates. | ||
| + | |||
| + | ===No significant hydrocarbons peaks in samples extracted from cells expressing only AAR=== | ||
| + | No significant peaks are found on the AAR-Only control GC plot within the time range that we expect alkane signal based upon GC-MS runs on chemical standards (8-10.5 minutes). This is expected, as ''E. coli'' does not normally produce any long chain length aldehyde substrates. | ||
| - | |||
=Initial Quantitation= | =Initial Quantitation= | ||
| Line 14: | Line 20: | ||
| - | |||
| - | |||
| - | |||
| - | |||
| - | |||
| - | |||
===C16-Alcohol production by cells expressing AAR=== | ===C16-Alcohol production by cells expressing AAR=== | ||
The GC plot from the extraction from a cell culture expressing only AAR shows a significant peak at 10.2 minutes corresponding to the C16 alcohol( as confirmed by comparison of the peak's MS spectra to a reference library). ''E. coli'' produces multiple aldehyde dehydrogenases that convert aldehydes to alcohols. The production of C16 alcohols in cells expressing AAR( but not in cells expressing only ADC) is consistent with AAR reducing even chain length Acyl-ACPs into even chain length fatty aldehydes, which are further reduced by aldehyde dehydrogenases to the alcohol. | The GC plot from the extraction from a cell culture expressing only AAR shows a significant peak at 10.2 minutes corresponding to the C16 alcohol( as confirmed by comparison of the peak's MS spectra to a reference library). ''E. coli'' produces multiple aldehyde dehydrogenases that convert aldehydes to alcohols. The production of C16 alcohols in cells expressing AAR( but not in cells expressing only ADC) is consistent with AAR reducing even chain length Acyl-ACPs into even chain length fatty aldehydes, which are further reduced by aldehyde dehydrogenases to the alcohol. | ||
Revision as of 02:38, 16 September 2011
Contents |
GSNS Analysis Shows Alkane Production Works
We preformed GC-MS analysis on cell cultures expressing both Acyl-ACP reductase(AAR) and Aldehyde Decarbonylase(ADC). to act as controls and in order to show that the alkane production system is working as expected, we also analyzed cell cultures expressing either only AAR, or only ADC.
No significant hydrocarbons peaks in samples extracted from cells expressing only ADC
No significant peaks are found on the ADC-Only control GC plot within the time range that we expect alkane signal based upon GC-MS runs on chemical standards (8-10.5 minutes). This is expected, as E. coli does not normally produce any long chain length aldehyde substrates.
No significant hydrocarbons peaks in samples extracted from cells expressing only AAR
No significant peaks are found on the AAR-Only control GC plot within the time range that we expect alkane signal based upon GC-MS runs on chemical standards (8-10.5 minutes). This is expected, as E. coli does not normally produce any long chain length aldehyde substrates.
Initial Quantitation
Optimized Production
C16-Alcohol production by cells expressing AAR
The GC plot from the extraction from a cell culture expressing only AAR shows a significant peak at 10.2 minutes corresponding to the C16 alcohol( as confirmed by comparison of the peak's MS spectra to a reference library). E. coli produces multiple aldehyde dehydrogenases that convert aldehydes to alcohols. The production of C16 alcohols in cells expressing AAR( but not in cells expressing only ADC) is consistent with AAR reducing even chain length Acyl-ACPs into even chain length fatty aldehydes, which are further reduced by aldehyde dehydrogenases to the alcohol.
Alkane production by cells expressing ADC and AAR
In cells expressing ADC and AAR, we saw peaks corresponding to the C13(8.2min) and C15(9.2min) alkanes, as well as a peak at 10.2 minutes that contains both the C16 alcohol and the C17 alkene. The fact that the C17 alkene and C16 alcohol peak overlaps with the C16 alcohol peak makes quantification of C17 akene yields impossible, but we have sufficient evidence to determine that both molecules are present in the 10.2 minute peak( the earlier section of the peak has an MS spectrea consistant with the C16 alcohol, and the later section is consistent with the C17 alkene). The C13 and C15 alkane peaks showed MS spectrums highly consistent with C13 and C15 alkane reference spectra. In addition, both alkane molecules eluted off of the GC at the same time as C13 and C15 alkane standards, further increasing confidence that the 8.2 min and 9.2 min peaks do correspond to the C13 and C15 alkanes. Odd chain length alkane production is what is expected from our system, as ADC removes a carbonyl group from even chain lengtrh aldehydes produced by AAR, yielding an odd chain length alkane.
Quantification of alkane yield
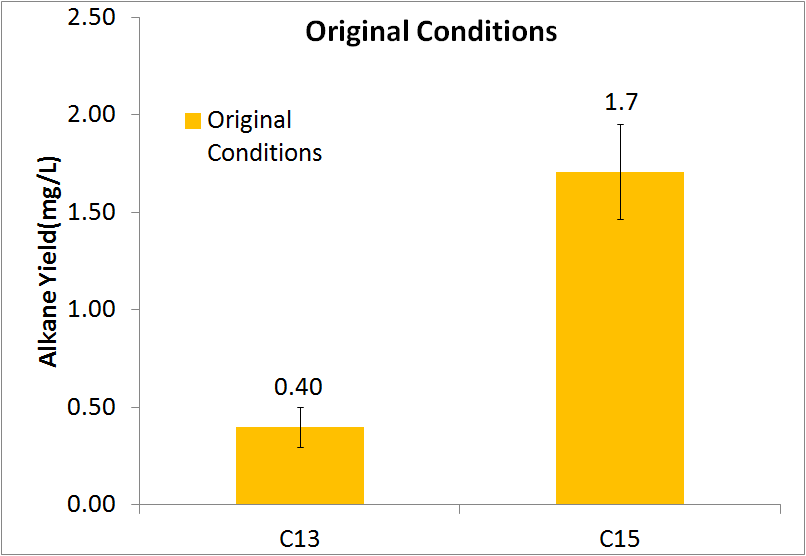
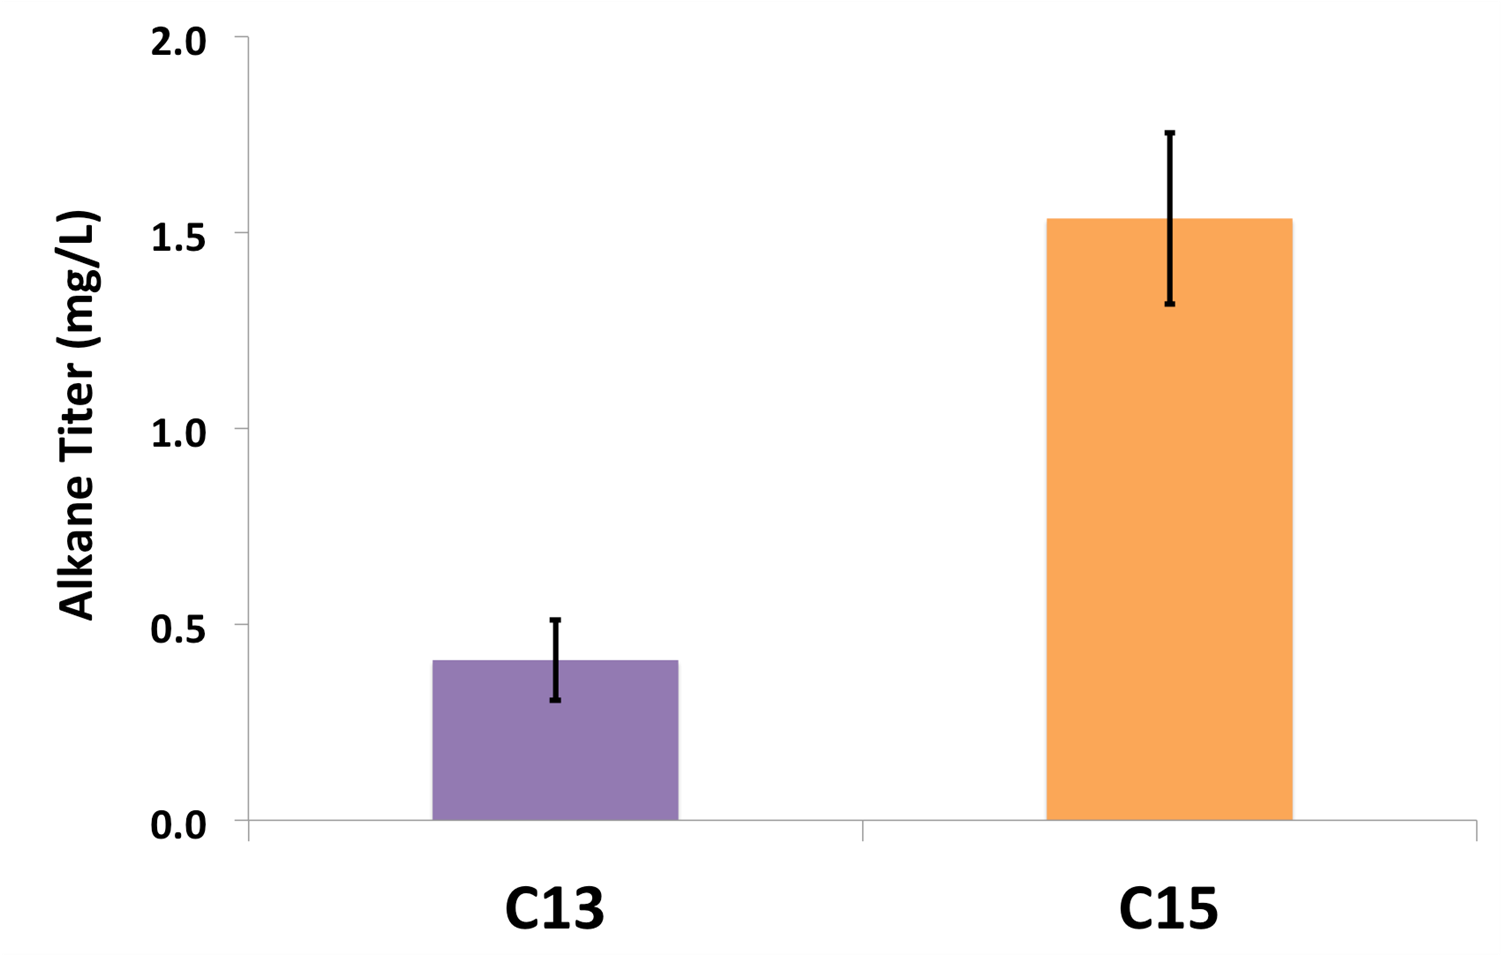
In order to be able to know how much alkane was being produced by our E. coli, we spiked known amounts of alkane into cell cultures known to not produce alkanes. We then extracted using ethyl acetate, and analyzed extracts using GC-MS. Since peak area corresponds to the amnount of each substance present, we used these GC plots to make a standard curve that allows us to convert peak area into an absolute amount. To determine how much alkane was being produced by our alkane production construct, we grew up 3 E. coli cultures expressing ADC and AAR in a standard M9 media(link), and analyzed using GC-MS.
 "
"


