Team:Washington/Alkanes/Results
From 2011.igem.org
GCMS confirms The PetroBrick enables diesel production from sugar using E. coli
We performed GC-MS analysis on extracts from cell cultures expressing both Acyl-ACP Reductase (AAR) and Aldehyde Decarbonylase (ADC) (this composite part is designated The PetroBrick). To act as controls and in order to show that the alkane production system is working as expected, we also analyzed cell cultures expressing either only AAR, or only ADC.
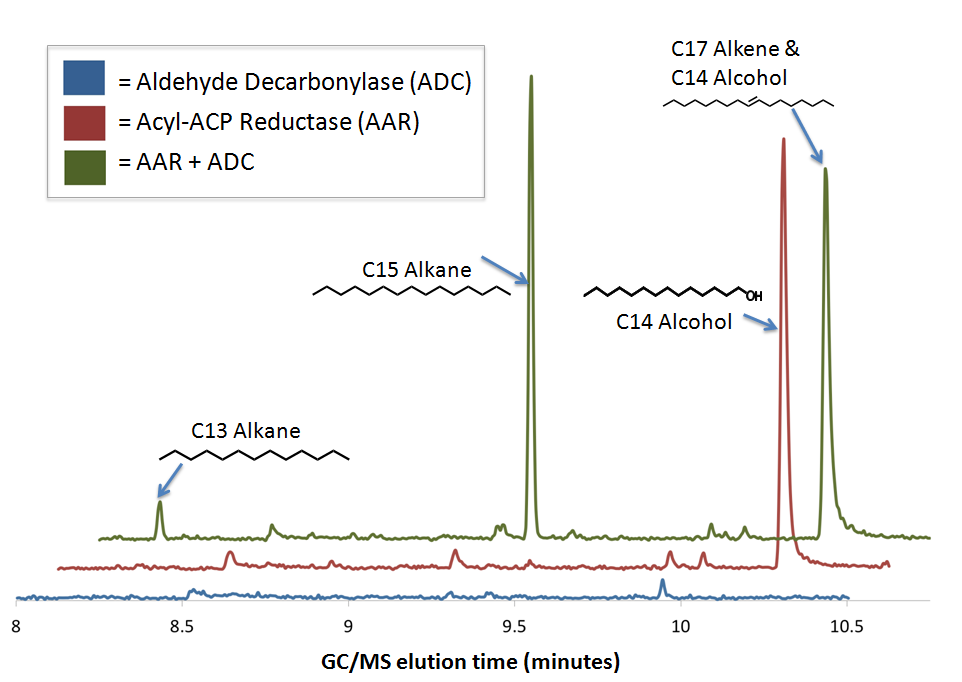
No significant hydrocarbons peaks in samples extracted from cells expressing only ADC. The blue GCMS chromatagram trace on the bottom show no significant peaks are found on the ADC only control within the time range that we expect alkane signal based upon GC-MS runs on chemical standards (8-10.5 minutes). This is expected, as E. coli does not normally produce any long chain length aldehyde substrates.
C16 alcohols are observed when AAR is expressed on its own. The red GCMS chromatagram trace in the middle has a significant peak at 10.2 minutes corresponding to the C16 alcohol (as confirmed by comparison of the peak's MS spectra to a reference library) is observed when AAR is expressed in MG1655 E. coli. The production of C16 alcohols in cells expressing AAR (but not in cells expressing only ADC) is consistent with AAR reducing even chain length Acyl-ACPs into even chain length fatty aldehydes, which are further reduced by aldehyde dehydrogenases to the alcohol.
The PetroBrick Works! C13, C15, and C17 alkanes are produced when both AAR and ADC are expressed.
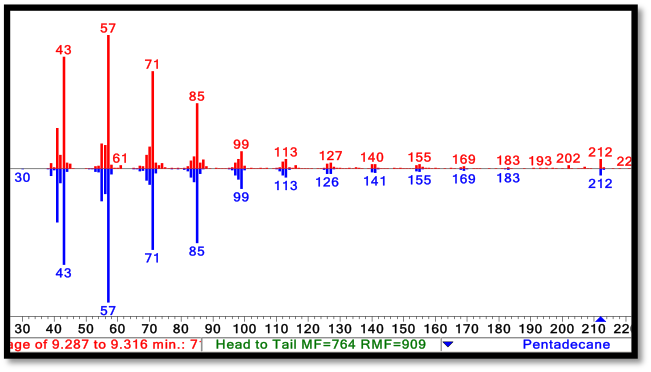
The green GCMS chromatagram trace in the middle has a significant new peaks corresponding to the C13 (8.2min) and C15 (9.2min) alkanes, as well as a peak at 10.2 minutes that contains both the C14 alcohol and the C17 alkene. The fact that the C17 alkene peak overlaps with the C14 alcohol peak makes exact quantification of C17 akene yields impossible, but we have sufficient evidence to determine that both molecules are present in the 10.2 minute peak( the earlier section of the peak has an MS spectra consistent with the C16 alcohol, and the later section is consistent with the C17 alkene). The C13 and C15 alkane peaks showed MS spectra highly consistent with C13 and C15 alkane reference spectra(for these spectra, as well as the C17 alkene spectrum, refer to our Spectra Page.). In addition, both alkane molecules eluted off of the GC at the same time as C13 and C15 alkane standards, further increasing confidence that the 8.2 min and 9.2 min peaks do correspond to the C13 and C15 alkanes. Odd chain length alkane production is what is expected from our system, as ADC removes a carbonyl group from even chain length aldehydes produced by AAR, yielding an odd chain length alkane. Using the PetroBrick, we can turn simple sugars into diesel, a fuel fully compatible with modern infrastructure.
Initial Quantization of Alkane Production
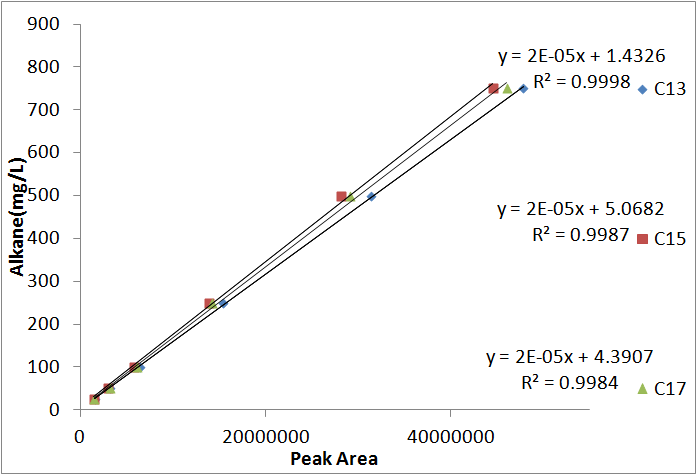
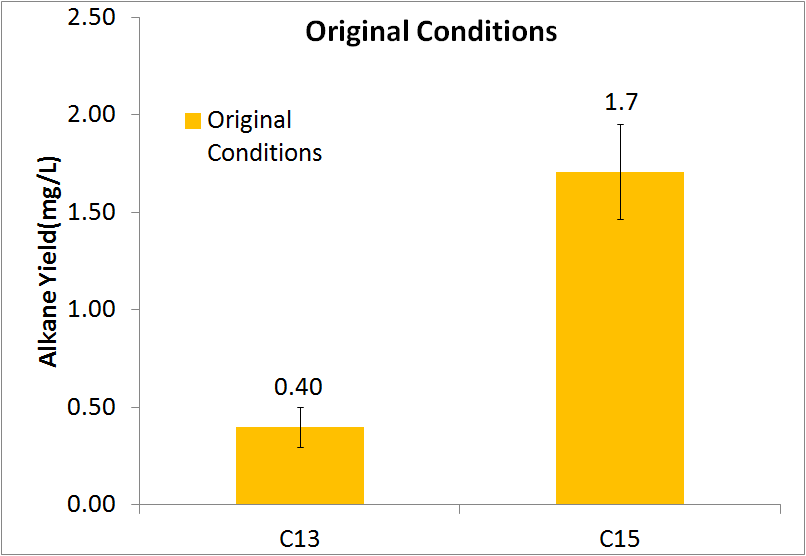
In order to be able to know how much alkane was being produced by our E. coli, we spiked known amounts of alkane into cell cultures known to not produce alkanes. We then extracted using ethyl acetate, and analyzed extracts using GC-MS. Since peak area corresponds to the amount of each substance present, we used these GC plots to make a standard curve that allows us to convert peak area into an absolute yield. To determine how much alkane was being produced by the Petrobrick, we grew up 3 MG1655 cell cultures transformed with the PetroBrick in M9 production media (link), and analyzed using GC-MS.
Optimized Production
By optimizing the method of growth, media, vectors, and cell line we were able to successfully increase alkane yield over 80-fold. Note that this improvement doesn't include C17 alkene production, as we were unable to quantify the C17 alkene peak due to co-elution with the C14 alcohol. The parameters we adjusted for optimization are discussed in detail at our systems optimization page under future directions, as this is an on going process.
The FabBrick, a module for even chain length alkane production
In order to more closely match the composition of diesel, we wanted a way to make the C14 and C16 alkanes, something that has never been reported before in the literature. For a detailed account of how we achieved this please see our future directions page. But a brief summary of our results is as follows:
We found an enzyme, FabH2 from Bacillus subtilis that has been hypothesized to start fatty acid biosynthesis with a 3 carbon unit instead of the normal 2 carbon unit. We thought that if we could express FabH2 together with the PetroBrick, we could make even chain length alkanes. Ww cloned FabH2 into a alc inducible promoter to form the FabBrick, an add-on module to teh PetroBrick system. The FabBrick was co-transformed with the PetroBrick in XL1-Blue E. coli. cells were grown up in rich TB media+ 5uM IPTG, and innocultated to OD10 in M9 production media + 5uM IPTG. Alkanes were extracted after 24 hours. In addition, GC runs were performed on uninduced FabH2/PetroBrick cultures, and on cells expressing only the PetroBrick.
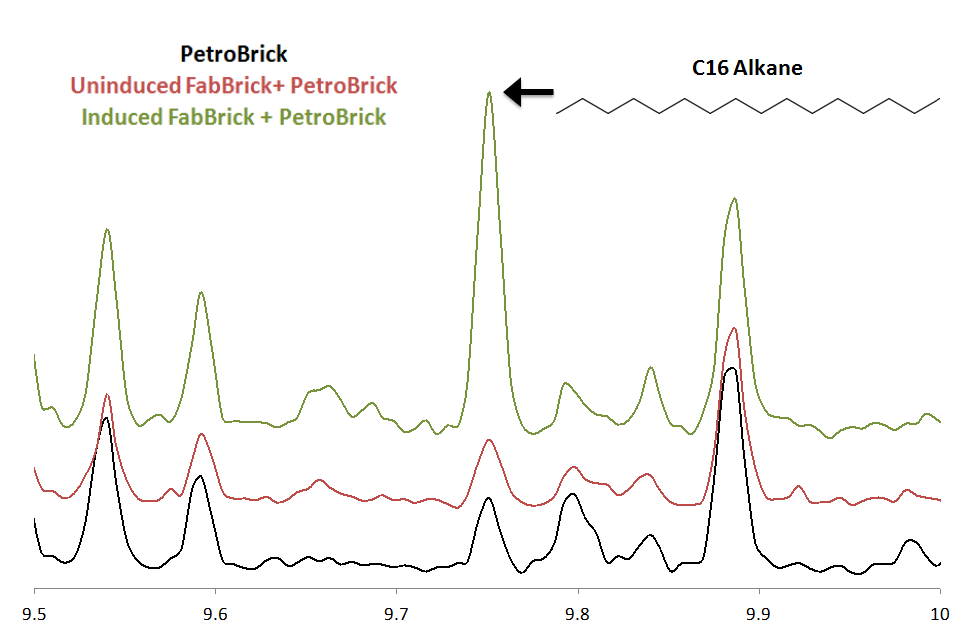
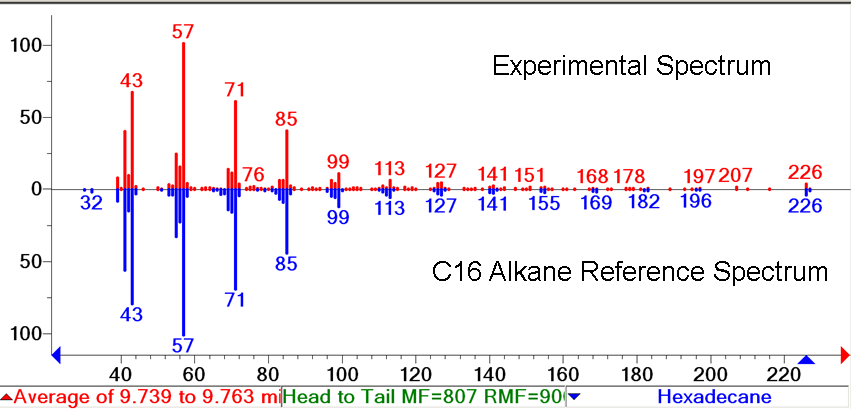
There was no significant difference between the GC peaks in the PetroBrick extract and in the uninduced FabH2/PetroBrick Extract. All of the peaks in these two extracts that fall within the expected elution time of the C16 alkane( 9.5-10 min) correspond to trace amounts of compounds that we cannot identify. When the FabBrick is induced, we see a new peak at approximetly 9.75 minutes. The MS spectra of this peak is highly consistent with C16 alkane. The overall ion fragmentation fingerprint is identical to that of alkane. Identification as a C16 alkane is confirmed by the presence of a strong parent ion at a mass of 226, exactly the mass of the C16 alkane. This confirms production of C16 alkane. In addition, some C14 alkane production was observed. This is the first time that even chain length alkanes have been produced recombinantly, and expands the PetroBrick system to be able to produce all of the alkanes in the range C13-C17. Note that this peak corresponds to only trace levels of alkane( approximately 4mg/L), and future optimization is needed to increase even chain length production levels. The FabBrick system shows the modularity and expandability of the PetroBrick system, and is a first proof of concept of the expansion of PetroBricks to produce a wider range of products. For more information on FabH2, refer to our future directions page .
 "
"


