Team:Peking S/modeling/pdb
From 2011.igem.org
Template:Https://2011.igem.org/Team:Peking S/bannerhidden

Population Density Balancer
ODEs|Parameters|Result
ODE
After designing genetic circuit and before experimental implementation in bench, we constructed a set of ordinary differential equations to mathematically analyze the population density balancer. Considering that the system is quite complicated, we make several reasonable assumptions to simplify it. Here we neglected the processes that operate in the fast timescale compared with transcription and translation process. (For example, biochemical signal transduction). And we assumed that the signaling molecules were distributed evenly in the system, for the diffusion rate of the small molecules is quite large and the diffusion process undergoes in a fast timescale. Thirdly, we assumed that the signal molecule is proportional to its synthase. Thus we can indicate the signal strength with the amount of protein. Lastly, we employed ODE model instead of stochastic model, considering the fact that we were mainly interested in the steady state of the system and the number of cells/molecules is large enough in steady state so that we could neglect the stochastic property.
The following chart shows the implication of each variable parameter
NAME MEANING
               A	      The population of A cell
               B	      The population of B cell
               m1	      The average number of mRNA1 in single C cell
               m2	      The average number of mRNA2 in single C cell
               s1	      The average number of sRNA1 in single C cell
               s2	      The average number of sRNA2 in single C cell
               P1	      The average number of protein 1 in single C cell
               P2	      The average number of protein 2 in single C cell
               mA	      The average number of mRNA A in single A cell
               mB	      The average number of mRNA A in single B cell
               PA	      The total number of protein A in the system
               PB	      The total number of protein B in the system
(In following model we will not point out specific name of each variable)
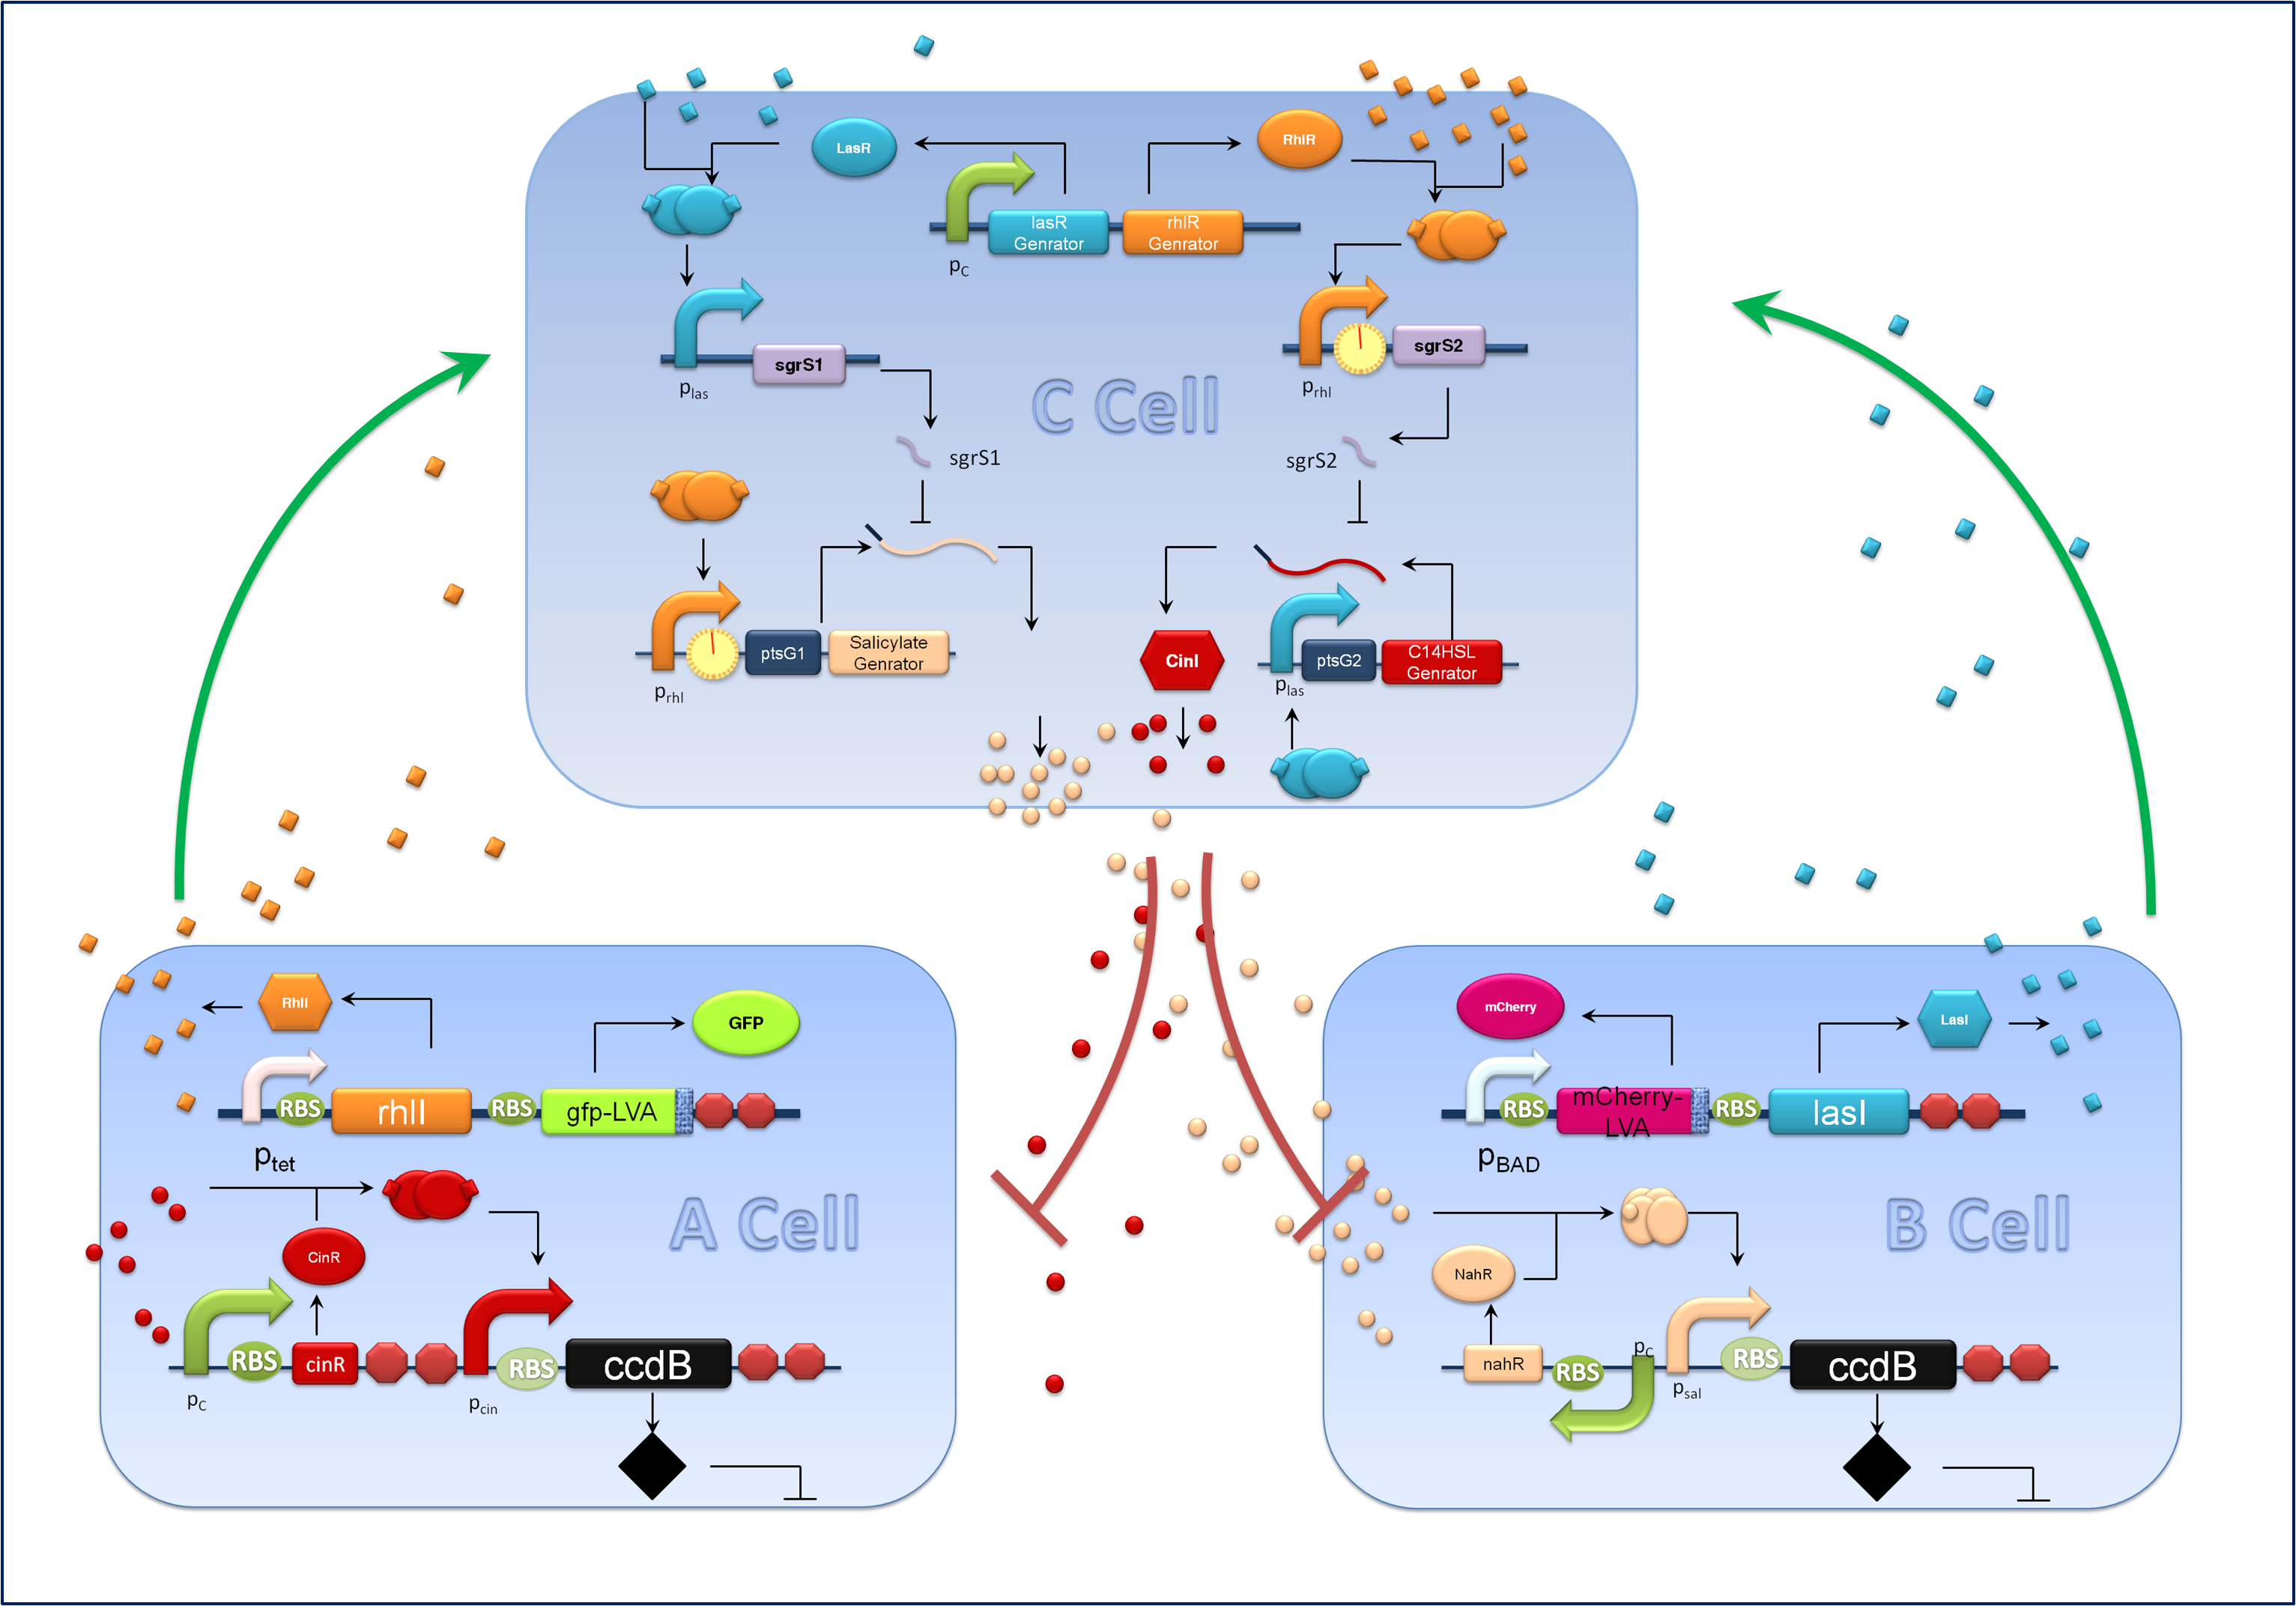
The schematic
Figure1 schematic of population density balancer. In order to facilitate the address, we regard Salicylate generator as gene1, C14HSL as gene2, lasI as gene B, rhll as gene A. We also assumed that lasR and rhlR are expressed excessively and the amount of corresponding translation products are constant.
We considered the variation rate of the populations of A and B cell first. Here we encountered a difficulty in mathematically describing the effect of toxic protein on killing the cell. Considering CcdB can dramatically reduce the population of cell rapidly once expressed[1] (the population will decreased by 1000 times in 30 minutes) and it will be more complicated when we took the process that signaling molecules are sensed by the receptor and then trigger the transcription and translation process of CcdB protein into consideration. So we phenomenologically assumed that the death rate caused by toxic protein is proportional to the number of protein and victim cell population. As shown in Fig 1, Protein 1 acts as synthase to synthesize the production of signaling molecule 1 which is received by A cell. Protein 2 synthesizes the production of signaling molecule 2 which is signal towards B cell only). When the population is small, the growth rate should be proportional to current population size. As the total number of A and B cell nearly saturated, the growth rate should decrease because of ecological constraints, In addition, some of cells will be washed away from the chamber. Hence the variation rate of A and B cell should be:
The first term on the right side of the equation is the death rate brought by toxic protein. The second denotes growth rate. The last represents the number of cell washed away per minute.
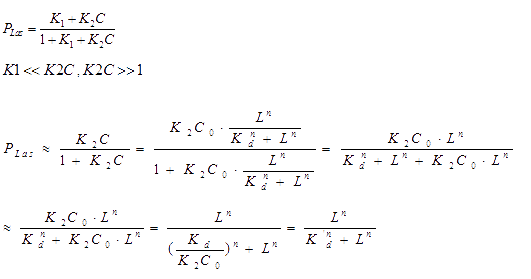
The signaling molecule, in our case, AHL (acetyl-Homoserine Lactone) will bind to its transcription factor, the concentration of bound transcription factor at equilibrium is: [3]
The bound transcription factor will bind to its promoter and the probability for each promoter being in open complex P is:
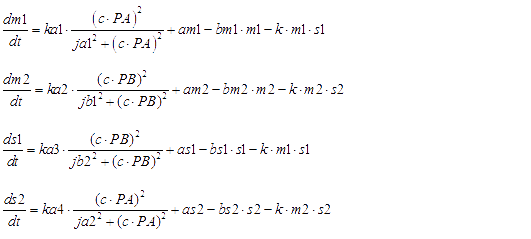
Hence the probability of the promoter under ON-state is a hill function. We further supplied a basal transcription rate. It is reasonable to speculate that the degradation of mRNA and the binding of mRNA and sRNA occur independently. [2]
The translation process of P1 and P2:
The transcription and translation process of P3 and P4
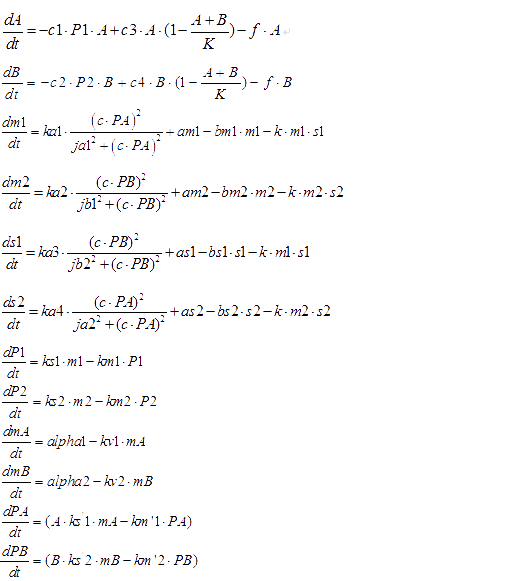
Here are all of ODEs we have constructed.
 "
"


