Team:EPF-Lausanne/Tools/MITOMI
From 2011.igem.org
(→MITOMI scans explanation) |
|||
| (2 intermediate revisions not shown) | |||
| Line 41: | Line 41: | ||
[[File:EPFL2011_MITOMIchip_beforewash_illustration.png|300px| After incubation: GFP fluorescence ]] | [[File:EPFL2011_MITOMIchip_beforewash_illustration.png|300px| After incubation: GFP fluorescence ]] | ||
[[File:EPFL2011_MITOMIchip_beforewashDNA_illustration.png|300px| After incubation: CY5 fluorescence ]] | [[File:EPFL2011_MITOMIchip_beforewashDNA_illustration.png|300px| After incubation: CY5 fluorescence ]] | ||
| + | |||
Green fluorescence comes from the GFP-tag fused to the protein or from the incorporated Green Lysine. | Green fluorescence comes from the GFP-tag fused to the protein or from the incorporated Green Lysine. | ||
Red fluorescence is due to the CY5 labeling of the DNA. | Red fluorescence is due to the CY5 labeling of the DNA. | ||
| Line 52: | Line 53: | ||
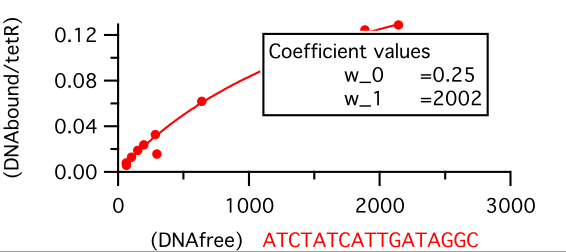
For data collection the fluorescence intensity measured under the button is normalised to the background and the DNA/protein ratio is calculated. This ratio is ploted against the intensity of the fluorescence of DNA in solution to make the saturation curves. And the Kd for each sequence is calculated from these curves by fitting the next equation: | For data collection the fluorescence intensity measured under the button is normalised to the background and the DNA/protein ratio is calculated. This ratio is ploted against the intensity of the fluorescence of DNA in solution to make the saturation curves. And the Kd for each sequence is calculated from these curves by fitting the next equation: | ||
| - | + | [[File:EPFL2011_MITOMI_Kd_fiting_formula.png|180px]] | |
[[File:EPFL2011_MITOMI_Example_Saturation_curve_fited.png|400px]] | [[File:EPFL2011_MITOMI_Example_Saturation_curve_fited.png|400px]] | ||
Latest revision as of 19:51, 28 October 2011
MITOMI
MITOMI stays for "mechanicaly induced trapping of molecular interactions", it is a high troughput method using microfluidic technology designed to mesure low affinity molecular interactions.
Purpose: We used MITOMI technique during our project to characterize transcription factor binding energy landscapes in absolute terms by determining dissociation constants (Kd) for a comprehensive set of target DNA sequences.
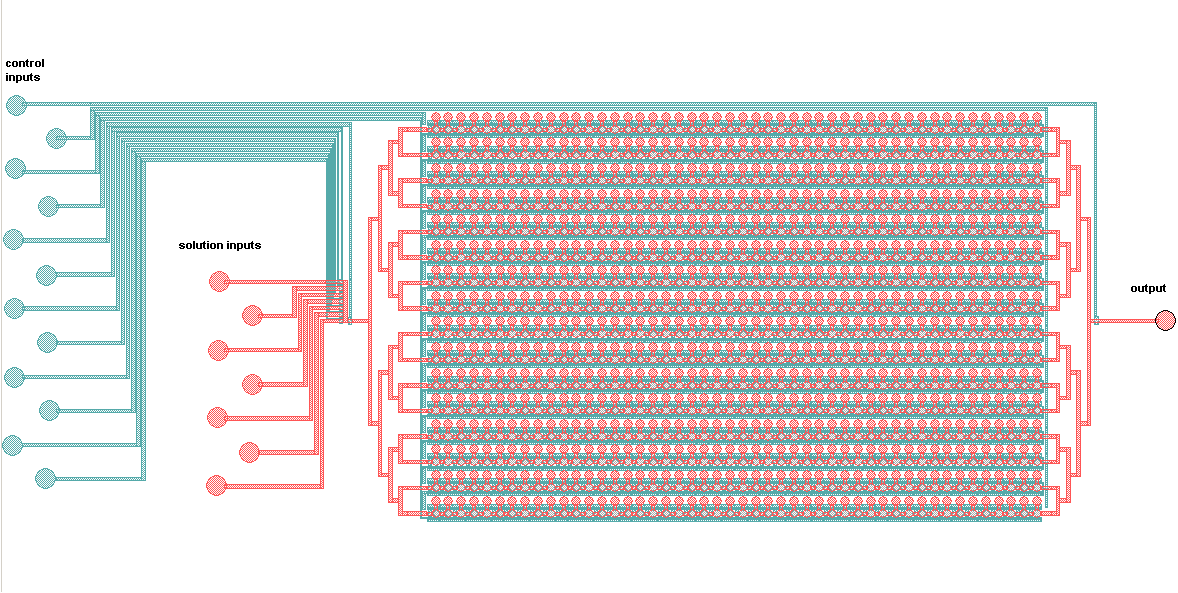
Schematic of the MITOMI platform:
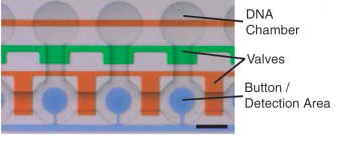
The control inputs control the valves that close the units or separate the chamber from the mixing space. Detailed view of the chambers and of the movable membrane used for mechanical trapping, referred to as the 'Button' .
Advantages: The movable membrane shown in the scheme below enables measurements of transient interactions, exhibiting sub micromolar affinities which are generally problematic to observe.
Maerkl, S.J. and S.R. Quake, A systems approach to measuring the binding energy landscapes of transcription factors. Science, 2007. 315(5809): p. 233-237.
Maerkl, S.J. and S.R. Quake, Experimental determination of the evolvability of a transcription factor. PNAS, 2009. 106(44):p. 18650-5.
Running a MITOMI experiment
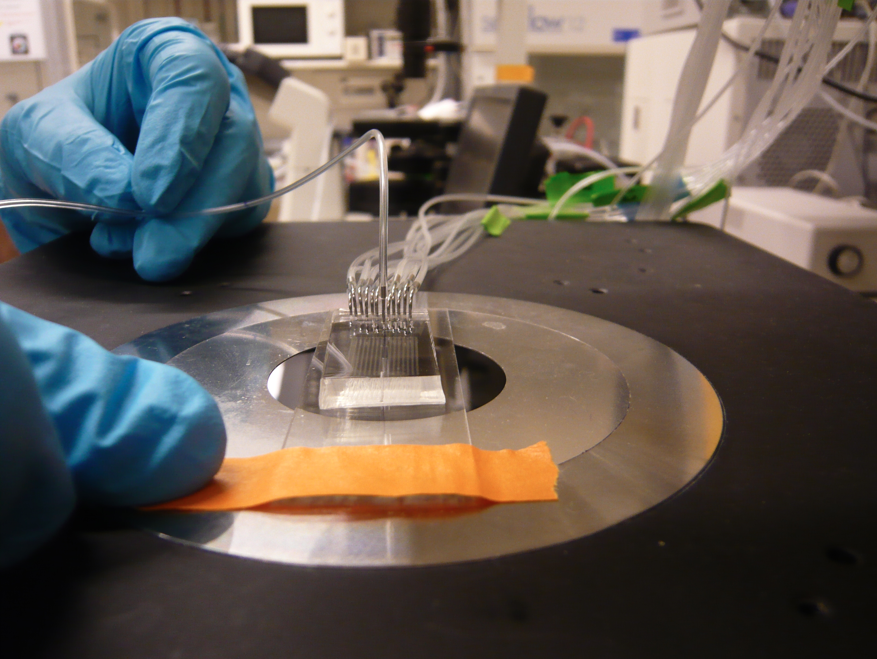
The protocol for the experiment can be found here. For more information on the mold or chip fabrication please check our Microfluidics pages.
MITOMI scans explanation
We've been using arrayWoRx scanner to acquire the images.
Two scans of the chip are necessary for the analysis of the molecular interactions.
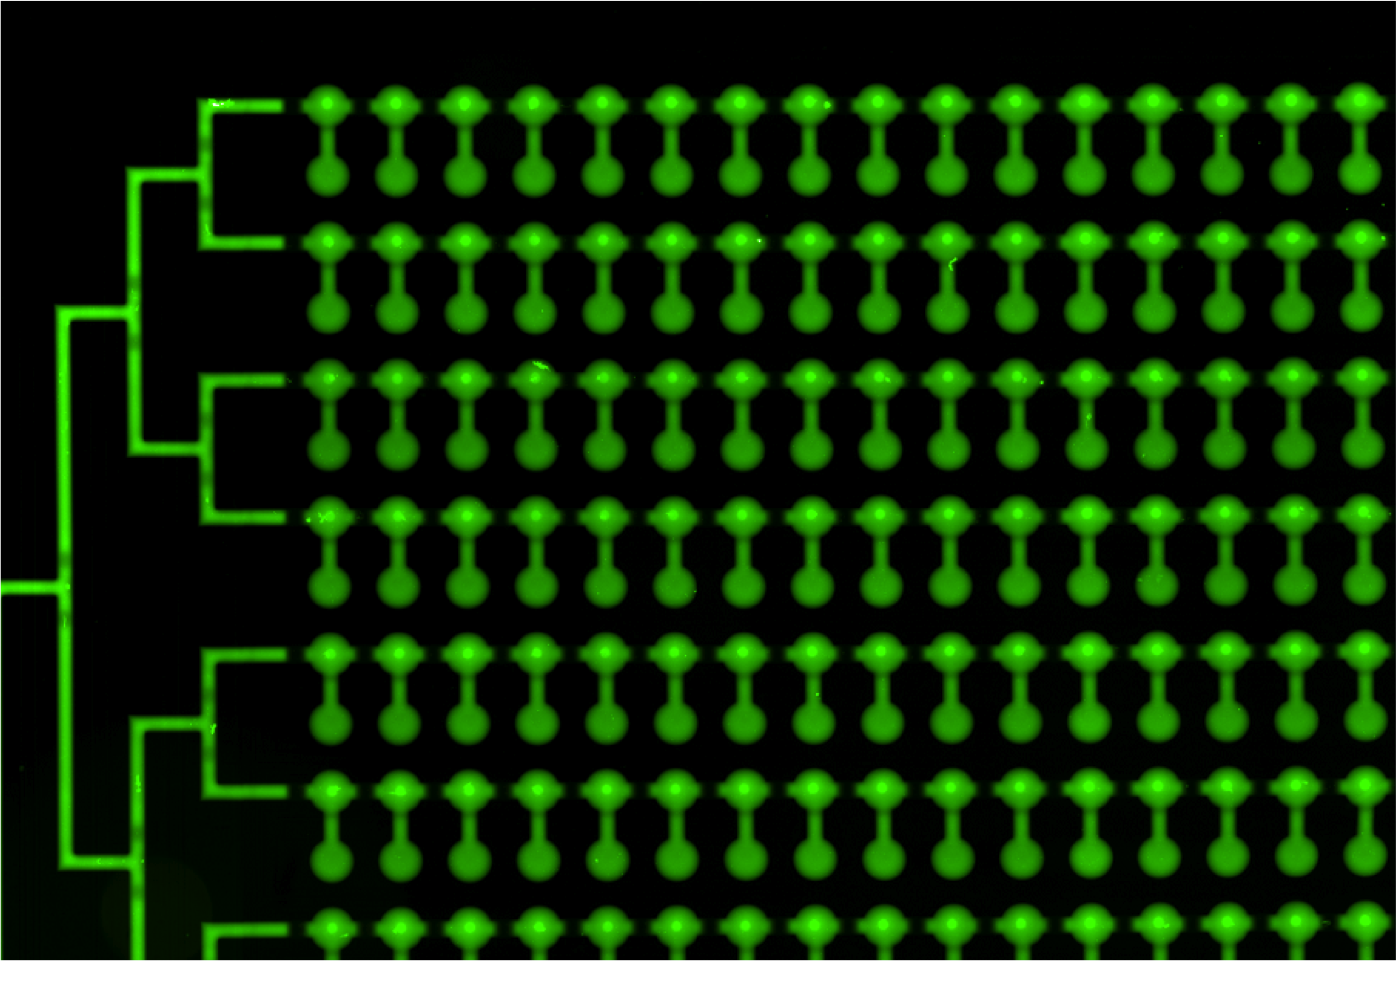
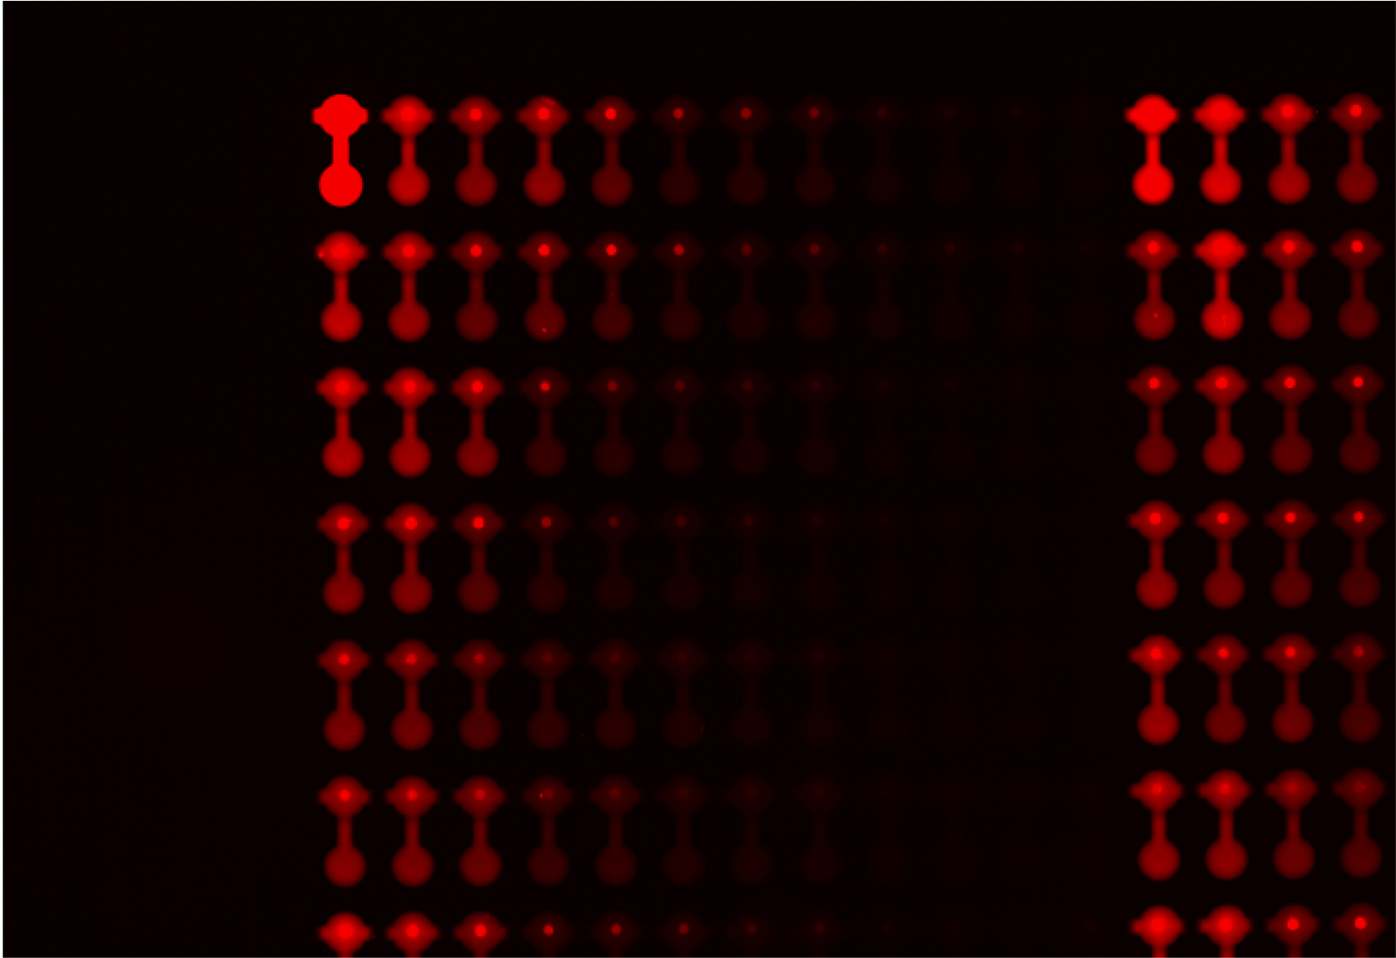
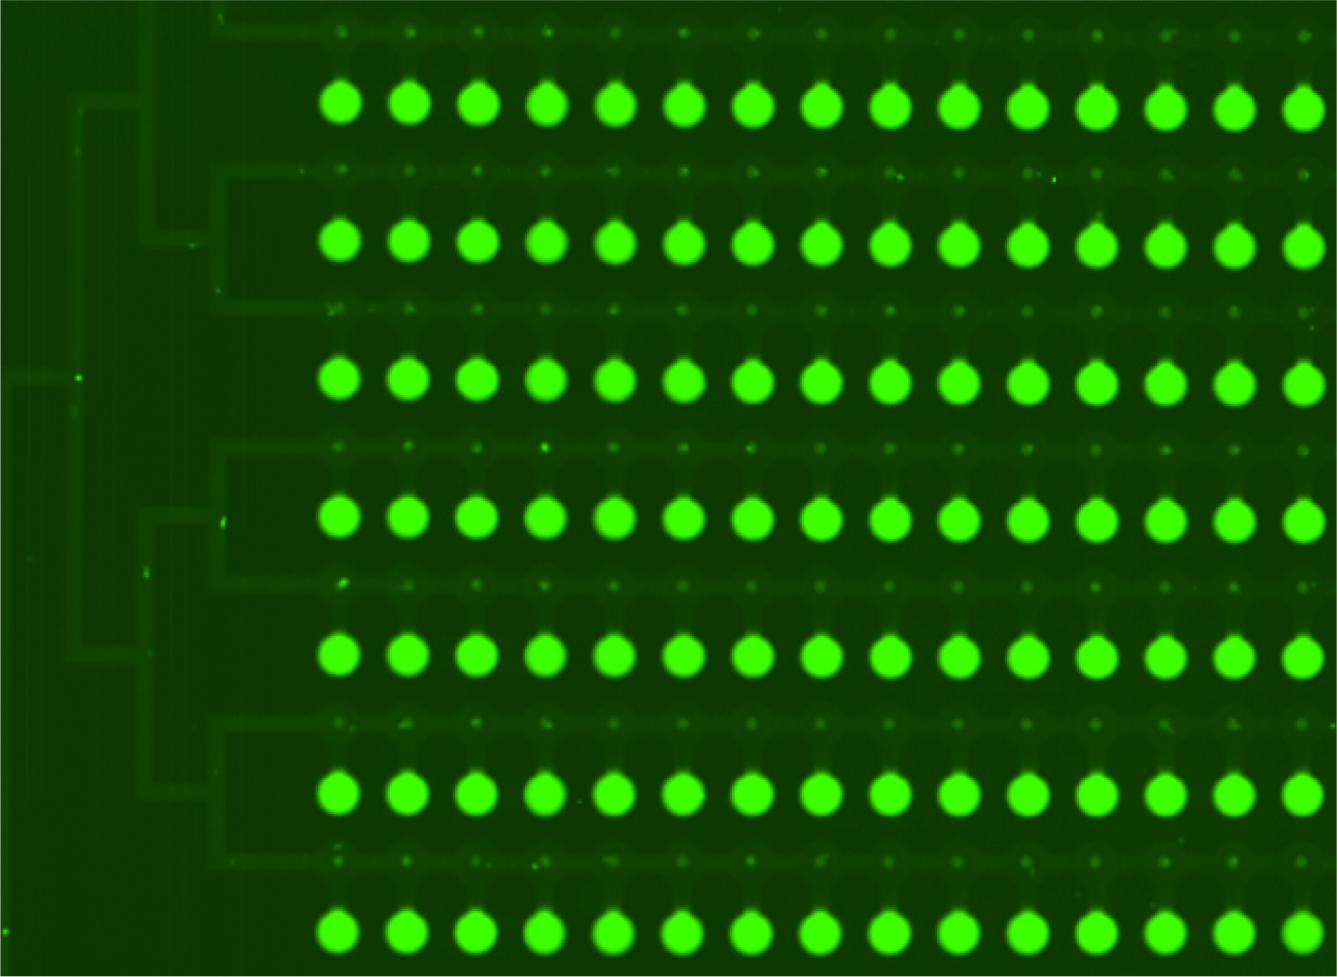
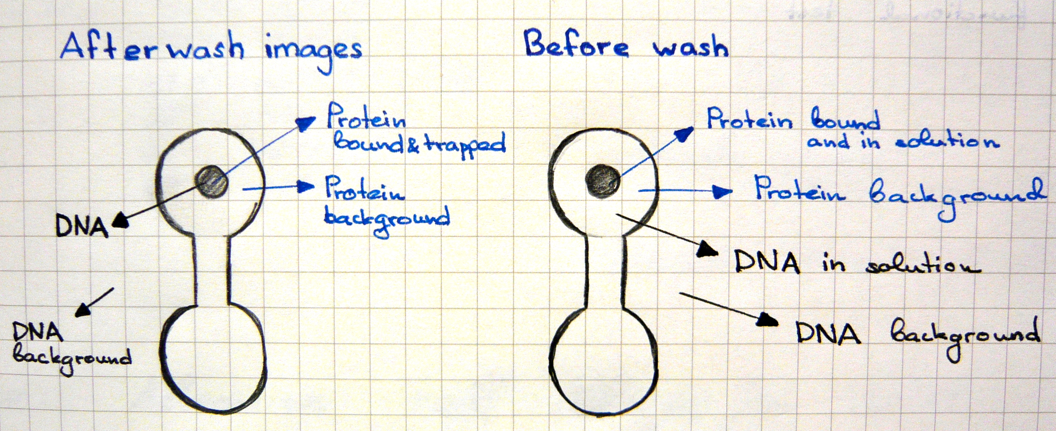
- First scan is taken after 30-60 minutes of incubation, when the protein-DNA interactions reach thermodynamic stability. At this point the chamber containing DNA is open to allow diffusion and the valves separating each of the 756 units are closed, which prevents contamination.
Green fluorescence comes from the GFP-tag fused to the protein or from the incorporated Green Lysine. Red fluorescence is due to the CY5 labeling of the DNA.
- Second scan is taken after 10-15 minutes of wash with PBS.
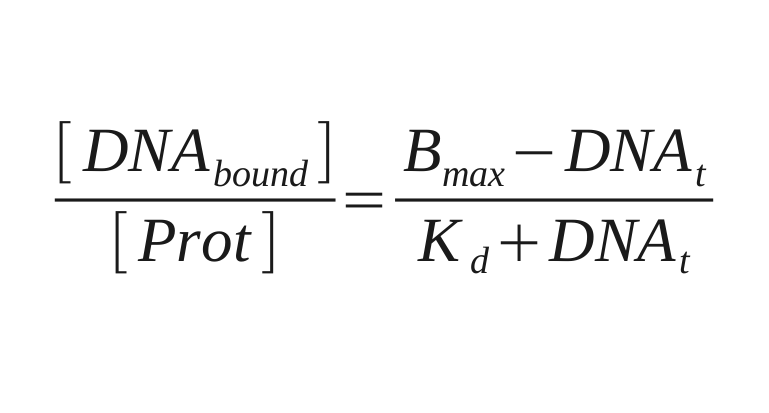
For data collection the fluorescence intensity measured under the button is normalised to the background and the DNA/protein ratio is calculated. This ratio is ploted against the intensity of the fluorescence of DNA in solution to make the saturation curves. And the Kd for each sequence is calculated from these curves by fitting the next equation:
 "
"
