Vitamin C
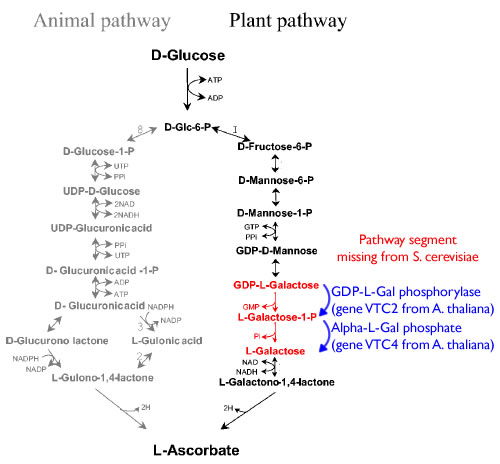
The genes for this pathway were taken from the genome of Arabidopsis thaliana and were codon optimized for yeast. The restriction sites from the biobrick prefix and suffix were removed to make them biobrick compatible. These in silico sequences were then constructed de novo using templateless PCR and overlap extension.
The plan for the construction of the Vitamin C synthesis pathway in yeast consisted of three steps.
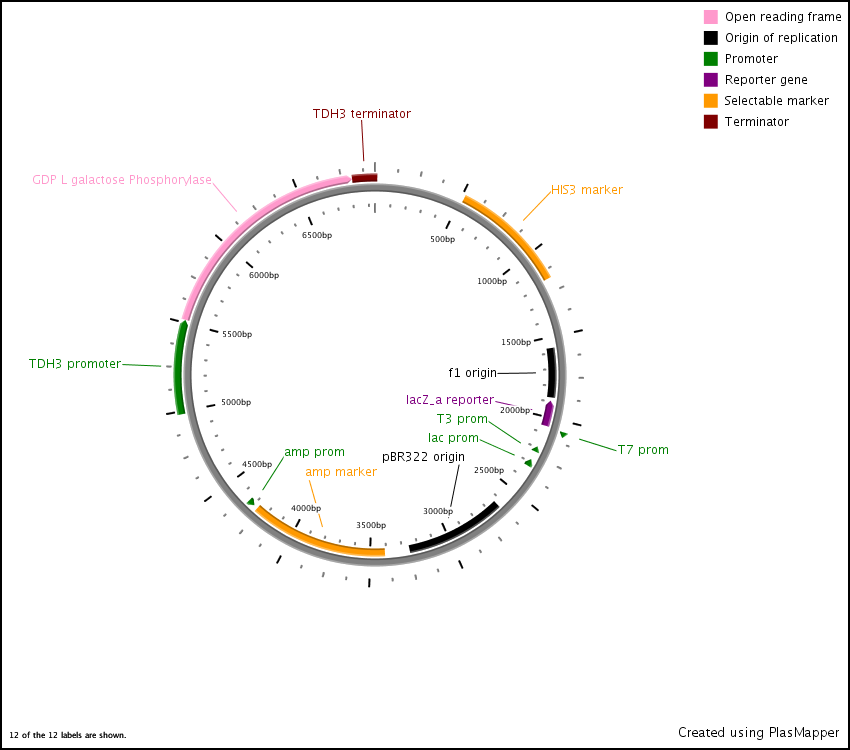
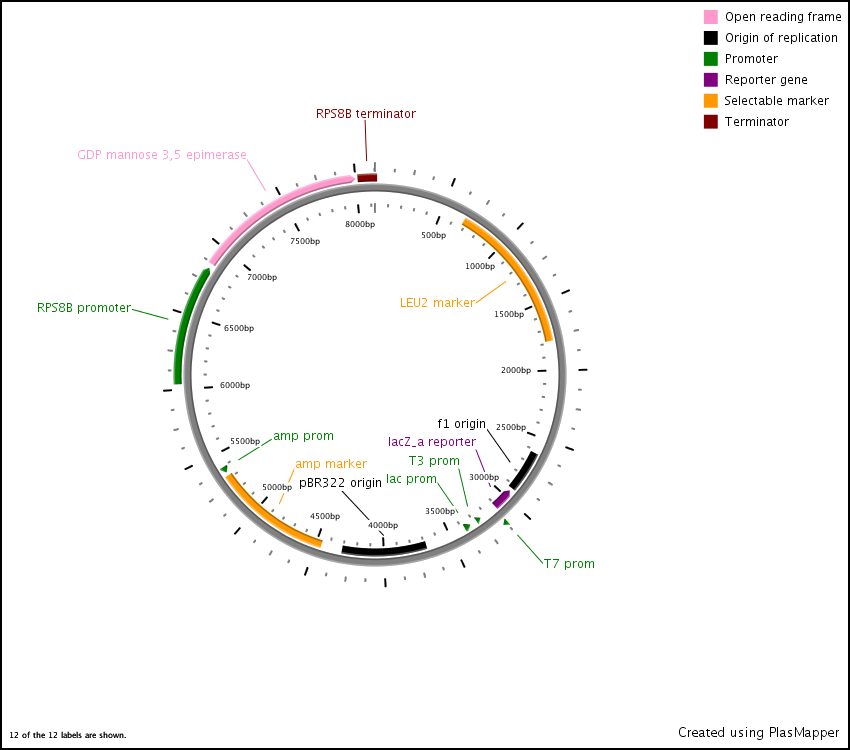
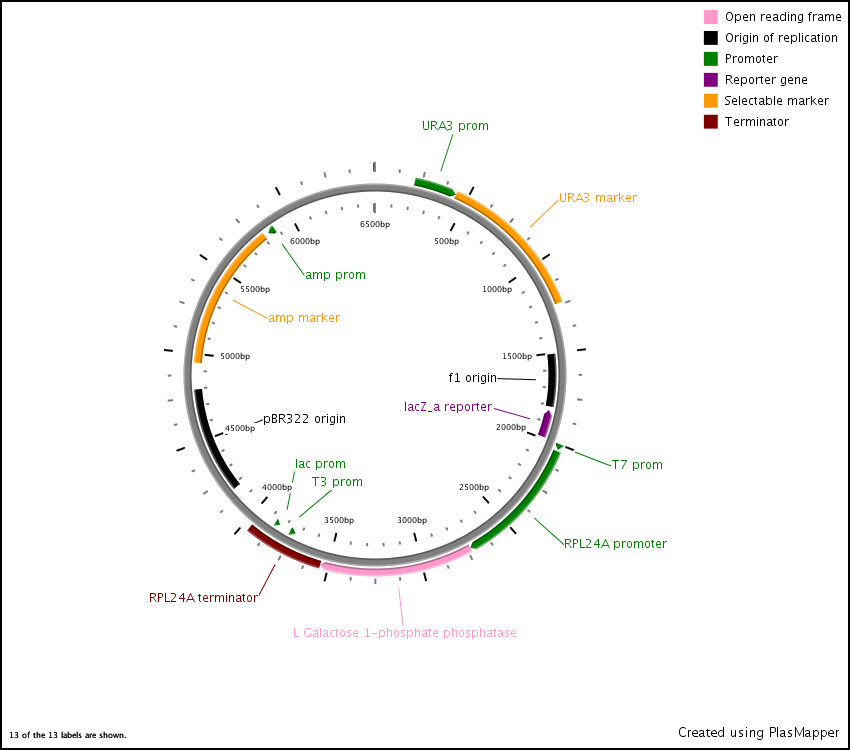
First we synthesized three open reading frames (ORF) corresponding to the three genes for producing GDP-mannose-3,5-epimerase, GDP-L-galactose phosphorylase, and L-Galactose 1-phosphate phosphatase. This was done using overlap extension to create two or more ‘building blocks’, each corresponding to a chunk of the ORF. Each building block had a 40 base pair overlap with its adjacent building block and with the vector (pRS416) in to which we inserted the ORF.
After this, the building blocks were assembled into the complete ORF in the vector using the CPEC assembly method. The ORFs were subsequently sequenced to make sure we constructed the correct sequences and then BioBricked using primers with the prefix and suffix flanking an overlap with the ORF.
In the end, the completed ORFs were assembled into expression cassettes under the influence of strong promoter and terminator combinations (TDH3, RPS8b, and RPL24a) again using the CPEC method of assembly.
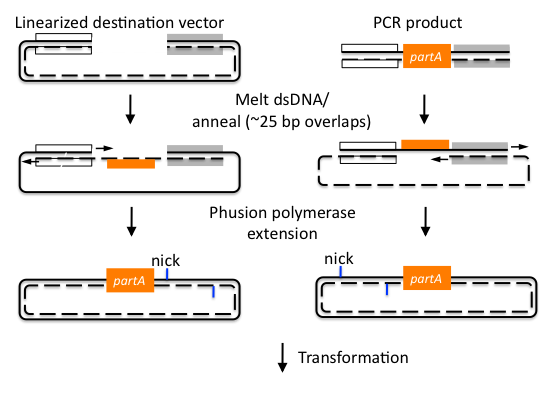 http://j5.jbei.org/j5manual/pages/22.html
We will later characterize our system by growing liquid cultures and assaying samples for ascorbic acid at incremental time intervals. We will then use this data to establish rate constants as well as quantify how much Vitamin C (ascorbic acid) our system can produce.
Once we have curves for Vitamin C production versus time, we will run a comparative study on how yeast producing Vitamin C grows on YPD plates (a lab standard) versus how it grows on our desired substrate, bread. To test its growth on bread we will create plates of dough-like media.
To optimize the production of ascorbic acid on the new substrate we will apply a strategy of directed evolution. We will make a combinatorial library of expression cassettes using Golden Gate Assembly for every synthesized ORF in the Vitamin C pathway. This will be made by using promoters and terminators of varying strengths from across the genome. Once constructed, this library will be plated on dough media plates with a calculated amount of peroxide in the agar. The presence of the peroxide will apply oxidative stress on the cells and, as Vitamin C confers oxidative stress resistance, this behaves as a selection for the cells that produce more Vitamin C. By adjusting the amount of peroxide on the plate, we can create a threshold of ascorbic acid production below which all the cells will die. To establish which one of the library members that passed through the selection is the best, we will perform a quantitative screen on the survivors. This will be done by growing up the cells in liquid culture, extracting the ascorbic acid, and determining its concentration through spectrophotometry.
Pathway
Sauer, M., Branduardi, P., Valli, M., & Porro, D. (2004). Production of L-ascorbic acid by metabolically engineered Saccharomyces cerevisiae and Zygosaccharomyces bailii. Applied and environmental microbiology, 70(10), 6086-91. doi: 10.1128/AEM.70.10.6086-6091.2004.
Experiments
Vitamin C concentration Assay (By Anne Marie Helmenstine, Ph.D) 1. Add 25.00 ml of vitamin C standard solution to a 125 ml Erlenmeyer flask. 2. Add 10 drops of 1% starch solution. 3. Rinse your buret with a small volume of the iodine solution and then fill it. Record the initial volume. 4. Titrate the solution until the endpoint is reached. This will be when you see the first sign of blue color that persists after 20 seconds of swirling the solution. 5. Record the final volume of iodine solution. The volume that was required is the starting volume minus the final volume. 6. Repeat the titration at least twice more. The results should agree within 0.1 ml. 7. You titrate samples exactly the same as you did your standard. Record the initial and final volume of iodine solution required to produce the color change at the endpoint.
 "
"


