Team:Harvard/Results/Chip Synthesis
From 2011.igem.org
qPCR curves
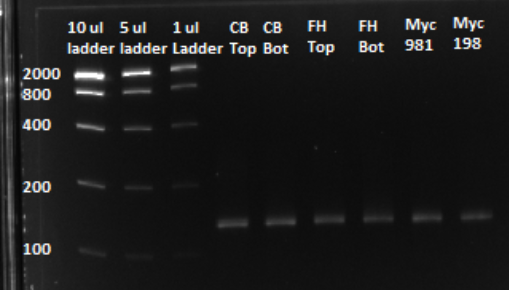
Each line on the graph below represents a qPCR for one of our sub-pools (each sequence we are targeting represents a sub-pool: CB top, CB bottom, FH top, FH bottom, Myc 198, Myc 981). By plotting the relative flouresence present in each cycle, we can visualize the pogress of the reaction. When performing a qPCR, one wants to run the reaction while the growth is still exponential. During this phase, all the oligos are replicated at equal rates. Once growth begins leveling off, as it does at the end of the graph below, the reaction should be stopped as the oligos are now being replicated unequally.
Based on the graph and gel below, we knew we successfully amplified each of our target sub-pools.
Sequencing results of Library transformation
Error rates
Still being updated
- Good: 57.8% (22/38)
- Single SNP: 5.3% (2/38)
- Multiple SNPs: 18.4% (7/38)
- Frame shift: 22.1% (17/77)
Distributions
Still being updated Each of the sequenced zinc fingers have original F1 fingers.
 "
"


