Team:EPF-Lausanne/Our Project/Data
From 2011.igem.org
Data
That's how the Data page should look like: https://igem.org/Sample_Data_Page
Perhaps we could only provide the link to the Registry page; if we put all the graphs here it's gonna be messy pages (TetR mutants, reporter plasmids and T7 variants)
We can make a "results" page with all the graphs, or put them in the descript
Contents |
New parts
Medium-strength Plac
blablabla
TetR Mutants
Lilia, are you also putting the WT into biobrick?
- V36F
Sequence
ATGTCCAGATTAGATAAAAGTAAAGTGATTAACAGCGCATTAGAGCTGCTTAATGAGGTCGGAATCGAAGGTTTAACAACCCGTAAACTCGCCCAGAAGCTAGGTTTCGAGCAGCCTACATTGTATTGGCATGTAAAAAATAAGCGGGCTTTGCTCGACGCCTTAGCCATTGAGATGTTAGATAGGCACCATACTCACTTTTGCCCTTTAGAAGGGGAAAGCTGGCAAGATTTTTTACGTAATAACGCTAAAAGTTTTAGATGTGCTTTACTAAGTCATCGCGATGGAGCAAAAGTACATTTAGGTACACGGCCTACAGAAAAACAGTATGAAACTCTCGAAAATCAATTAGCCTTTTTATGCCAACAAGGTTTTTCACTAGAGAATGCATTATATGCACTCAGCGCTGTGGGGCATTTTACTTTAGGTTGCGTATTGGAAGATCAAGAGCATCAAGTCGCTAAAGAAGAAAGGGAAACACCTACTACTGATAGTATGCCGCCATTATTACGACAAGCTATCGAATTATTTGATCACCAAGGTGCAGAGCCAGCCTTCTTATTCGGCCTTGAATTGATCATATGCGGATTAGAAAAACAACTTAAATGTGAAAGTGGGTCT
- P39K
- Y42F
- P39Q-Y42M
Sequence
ATGTCCAGATTAGATAAAAGTAAAGTGATTAACAGCGCATTAGAGCTGCTTAATGAGGTCGGAATCGAAGGTTTAACAACCCGTAAACTCGCCCAGAAGCTAGGTGTAGAGCAGCAAACAGTGATGTGGCATGTAAAAAATAAGCGGGCTTTGCTCGACGCCTTAGCCATTGAGATGTTAGATAGGCACCATACTCACTTTTGCCCTTTAGAAGGGGAAAGCTGGCAAGATTTTTTACGTAATAACGCTAAAAGTTTTAGATGTGCTTTACTAAGTCATCGCGATGGAGCAAAAGTACATTTAGGTACACGGCCTACAGAAAAACAGTATGAAACTCTCGAAAATCAATTAGCCTTTTTATGCCAACAAGGTTTTTCACTAGAGAATGCATTATATGCACTCAGCGCTGTGGGGCATTTTACTTTAGGTTGCGTATTGGAAGATCAAGAGCATCAAGTCGCTAAAGAAGAAAGGGAAACACCTACTACTGATAGTATGCCGCCATTATTACGACAAGCTATCGAATTATTTGATCACCAAGGTGCAGAGCCAGCCTTCTTATTCGGCCTTGAATTGATCATATGCGGATTAGAAAAACAACTTAAATGTGAAAGTGGGTCT
T7 Promoter Variants
Characterization of Variants Using Fluorescence
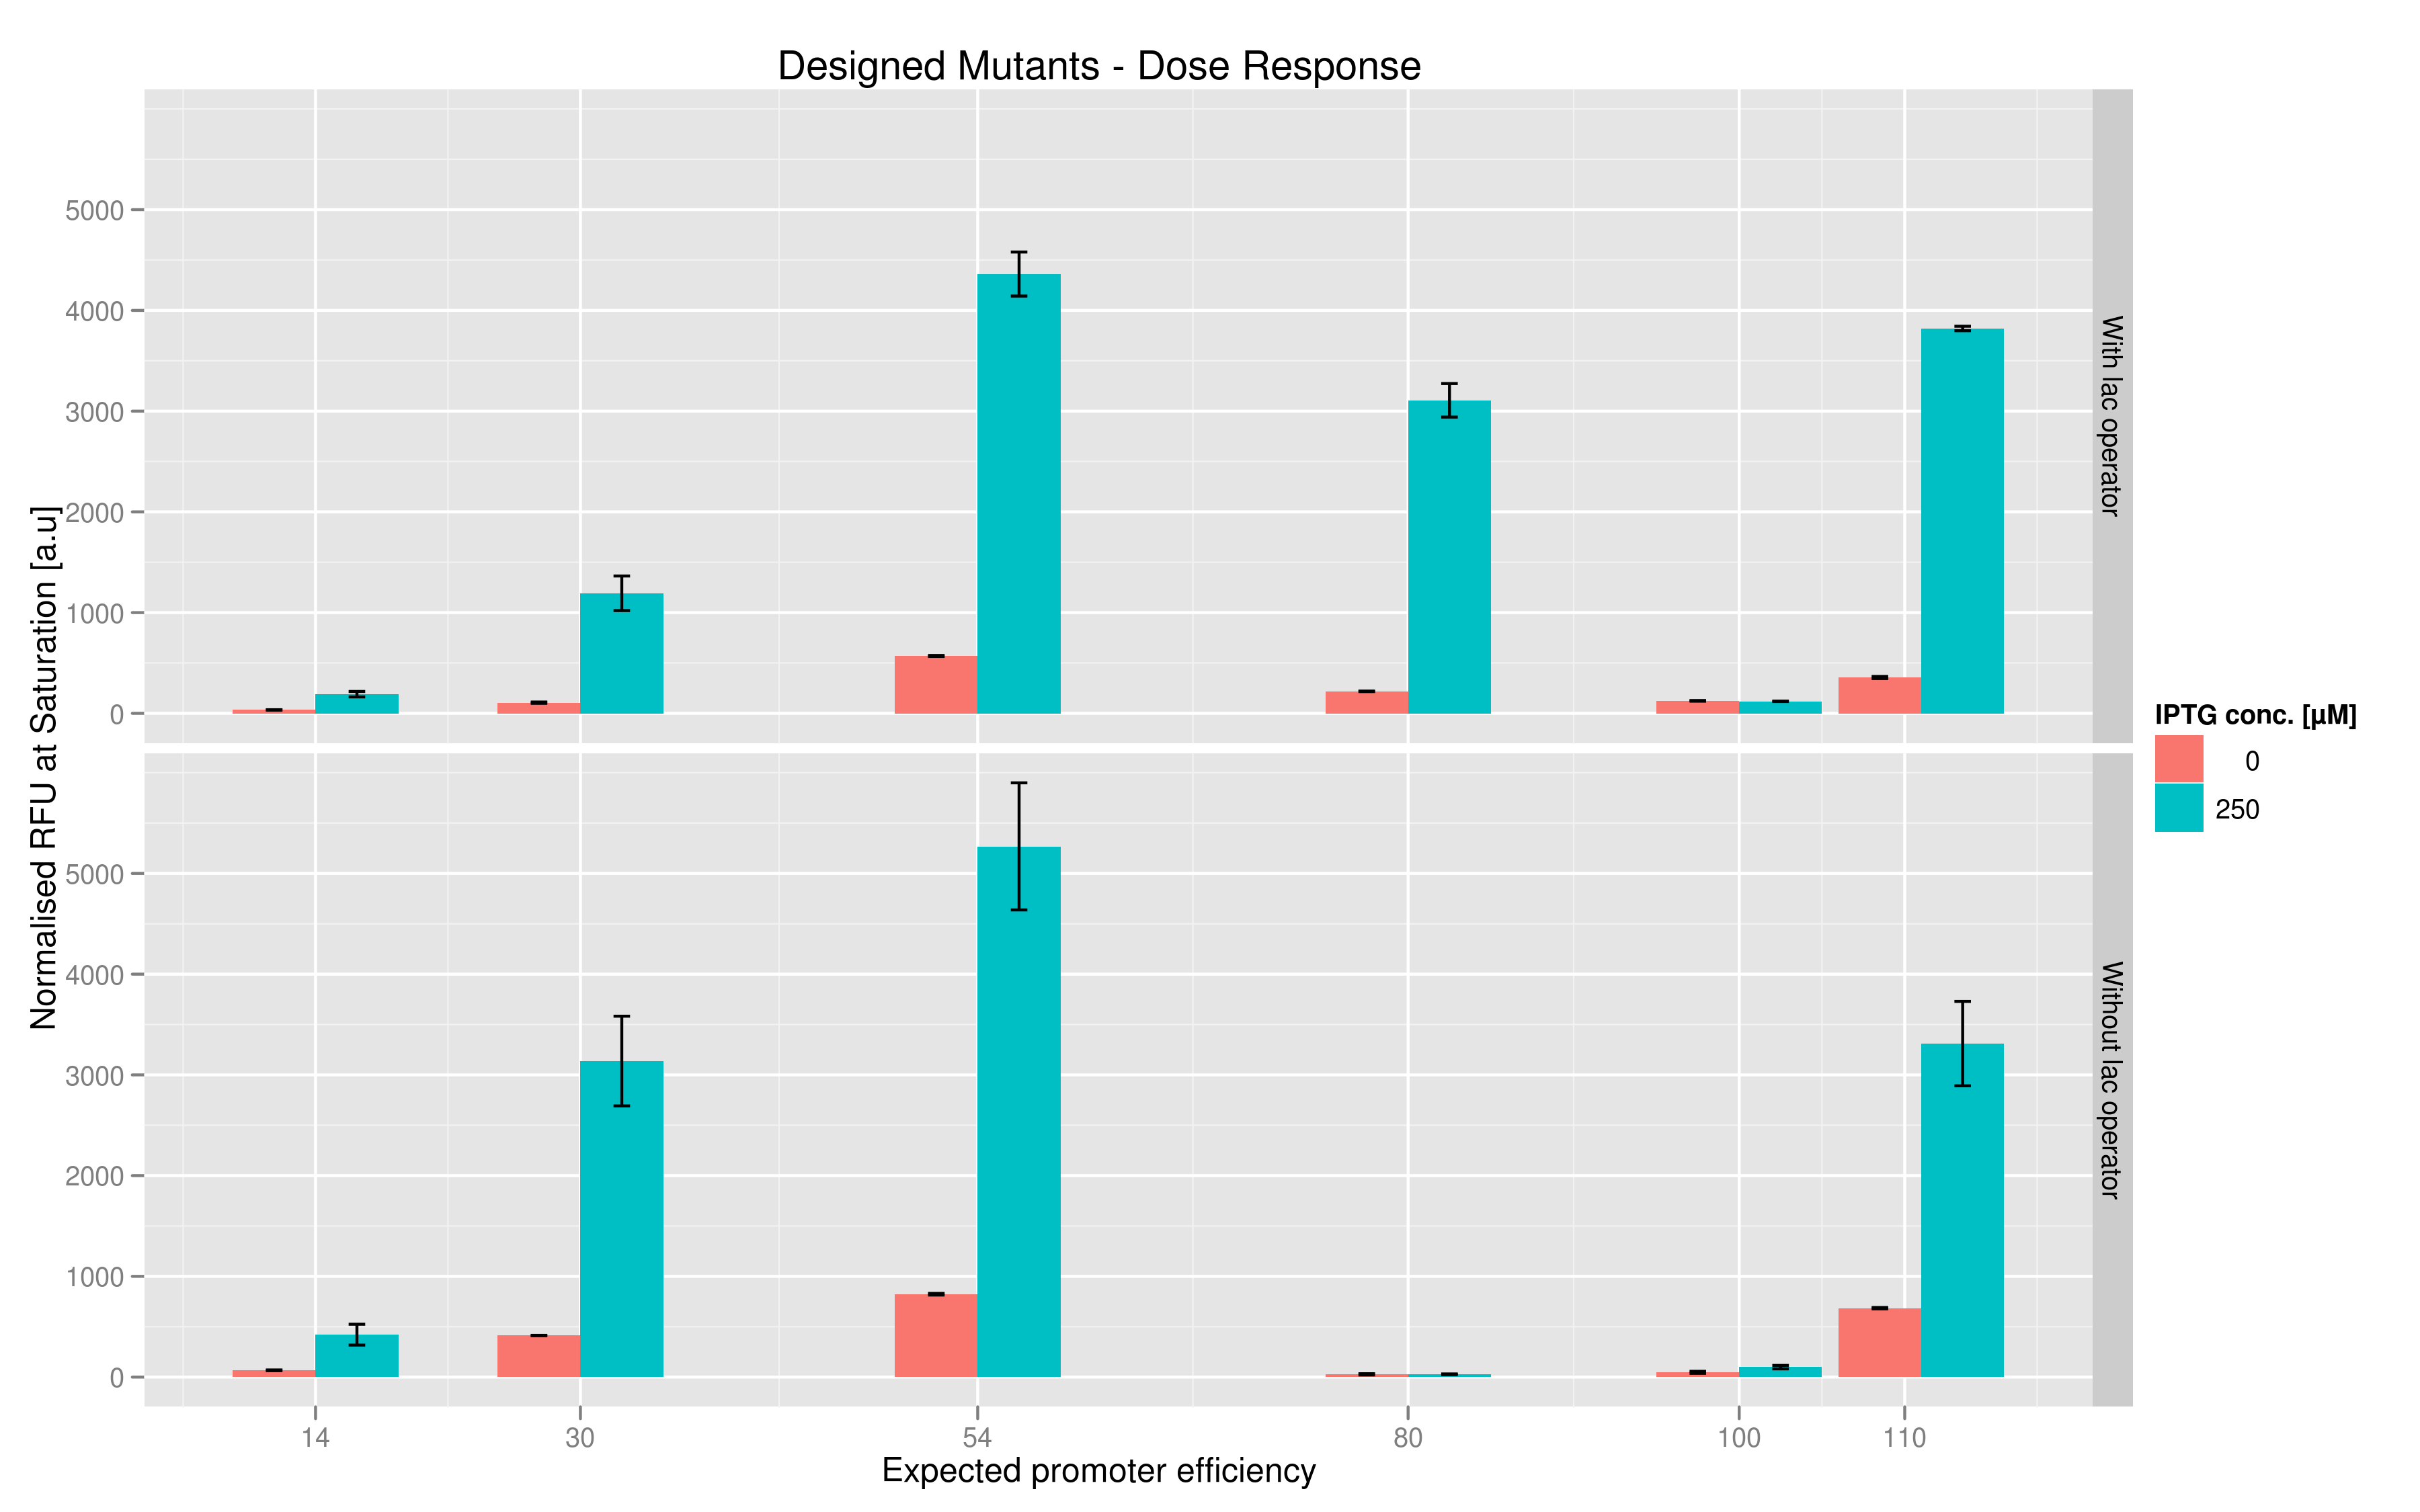
For each family, we tested the randomers and the designed variants separately. To characterize the promoter strengths, we used RFP as the reporter gene and used a platereader to test for fluorescence during and after induction with IPTG.
The six designed T7 promoter variants are named as a function of their predicted promoter efficiency, relative to the wildtype. For example, T7 14 has a predicted efficiency of 14% compared to the consensus T7 promoter, whereas T7 111 is predicted to be 111% more efficient than the wildtype. In the chart above, you find each of the designed promoter variants for both the T7 with and without the lac operator, arranged in increasing predicted efficiency. Contrary to our expectation, some variants that were designed to have a lesser efficiency than the wildtype (e.g. T7 54) seem to have a much higher strength (as measured by fluorescence at saturation, normalized by the optical density). Already in the designed variants, we see a substantial difference in the behavior of the promoters that have a lac operator as opposed to those that do not. The data for this graph was produced in triplicate, so the error bar represents the standard error across those three measurements.
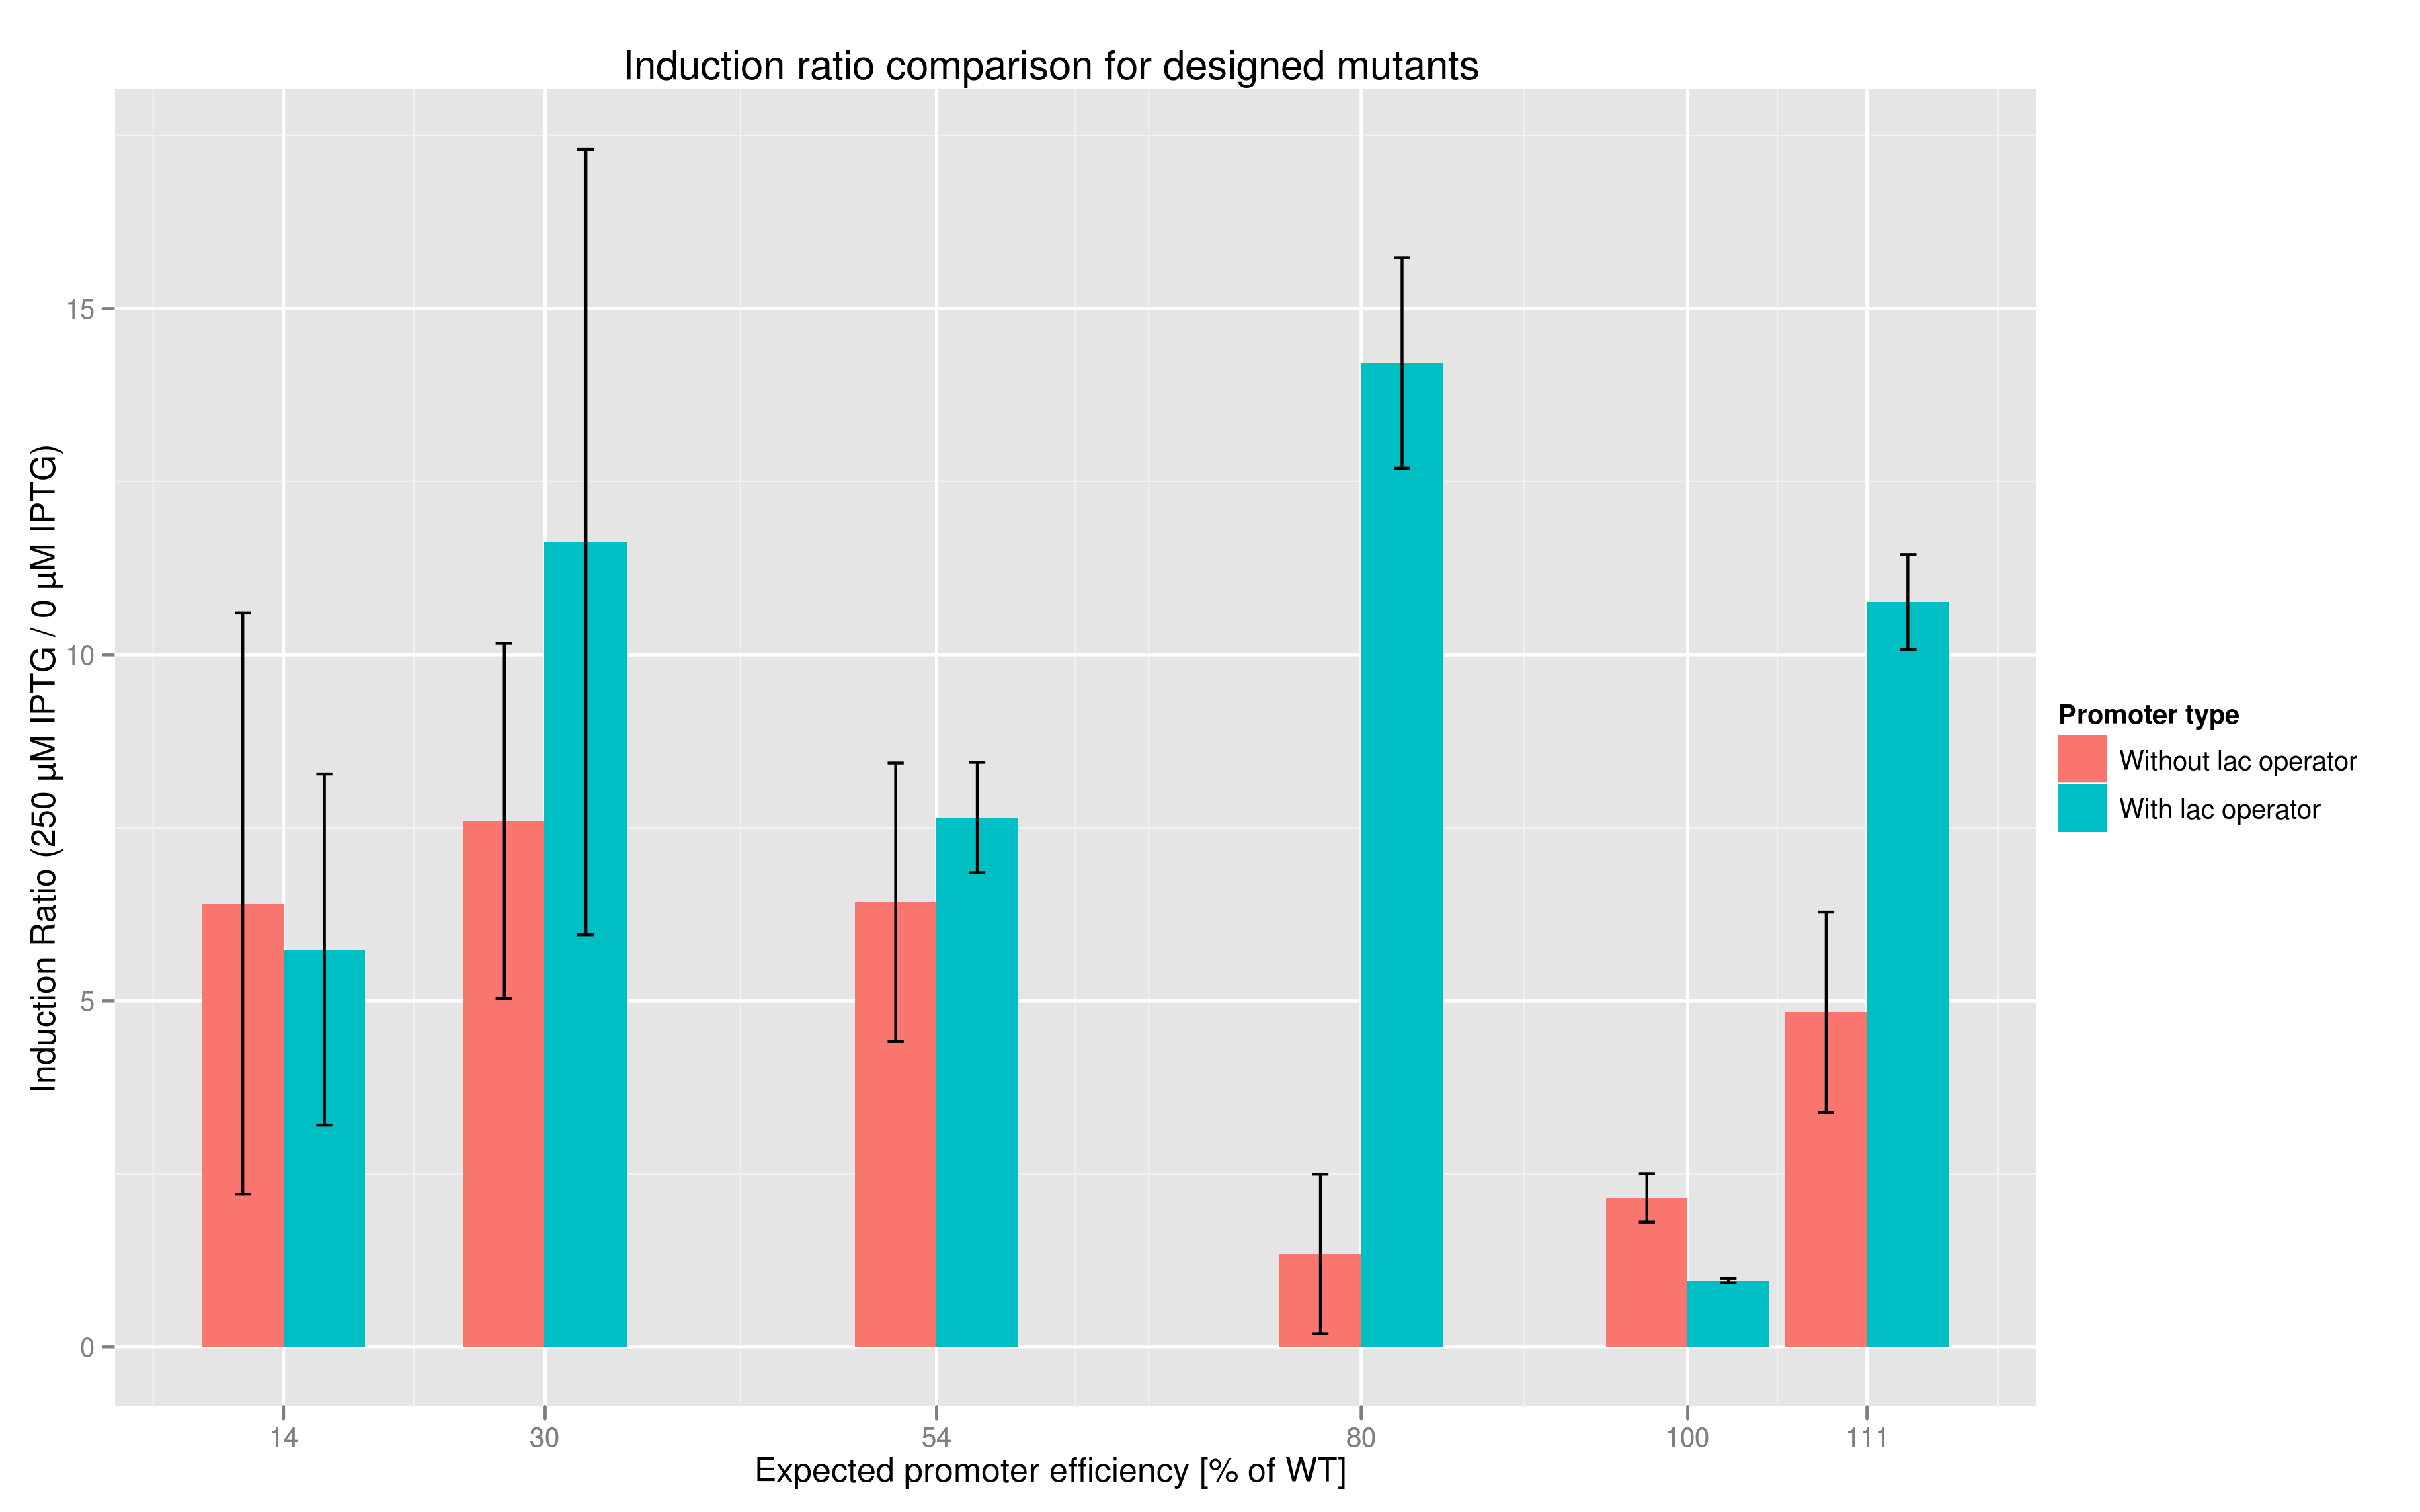
In addition to fluorescence at saturation, another way to characterize promoter strength is to look at its induction ratio, which is the ratio, at saturation, of fluorescence produced by induction with IPTG versus fluorescence produced without induction. In layman's terms, it indicates how strongly the promoter reacts to induction. Here again, our results indicate that some promoter variants (T7 80 in particular) stand out with respect to this feature. Here too the importance of the lac operator in producing high induction ratios is not to be underestimated.
For the three sets of randomers for T7 with and without the lac operator, we tested seventy-two different variants and characterized their expression using the same IPTG induction protocol as with the designed variants. The goal of using these variants was to examine the range of expressions that can be produced by random mutations as opposed to directed mutations. The results, as presented in the graph, indicate that the designed variants (with and without lac operator put together) produce a much higher average normalized fluorescence than the randomers.
Characterization and DNA Recovery with Lysis
Since a major component of our scheme for selecting promoters and transcription factors with strong binding affinities required the ability to lyse cells, we also wanted to test a T7-driven lysis cassette.
Induction with various concentrations of IPTG reveals a stready increase in the amount of lysis that can be obtained. Here 500 uM yields the most substantial amount of lysis, and that concentration was used in all further experiments dealing with lysis. The negative controls were two-fold: one is an unsuccessful attempt at inserting the lysis cassette downstream of a T7 promoter in the psB3K1 plasmid, while the other is a T7 promoter upstream of an RFP gene. Neither should express lysis.
Other assemblies - without new biobrick
J61002 Ptet-RFP
We are showing the data of RFP induction in cells containing J61002 Ptet-RFP, as a reference to compare the data of the first readout system (TetR and RFP), where the cells contain both J61002 Ptet-RFP and pSB3K1 Pconst-TetR.
ATC induction
[[File:]]
Dose-response
[[File:]]
Readout system - TetR and RFP
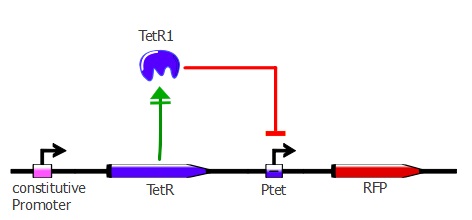
The first readout system is composed of TetR with a constitutive promoter, followed by RFP with a pTet promoter. If TetR binds to pTet, then RFP is repressed. This readout system is convenient for fluorescence detection experiments, but it would not be suited for using the lysis cassette as the reporter gene is being repressed upon TetR-pTet interaction. With the lysis device, the interesting cells (where TetR binds to pTet) would survive and we would recover only the useless TetR mutants.
The plasmids used here are pSB3K1 pConst-TetR and J61002 Ptet-RFP. For more details about them, please refer to the "Reporter plasmids" tab.
ATC induction
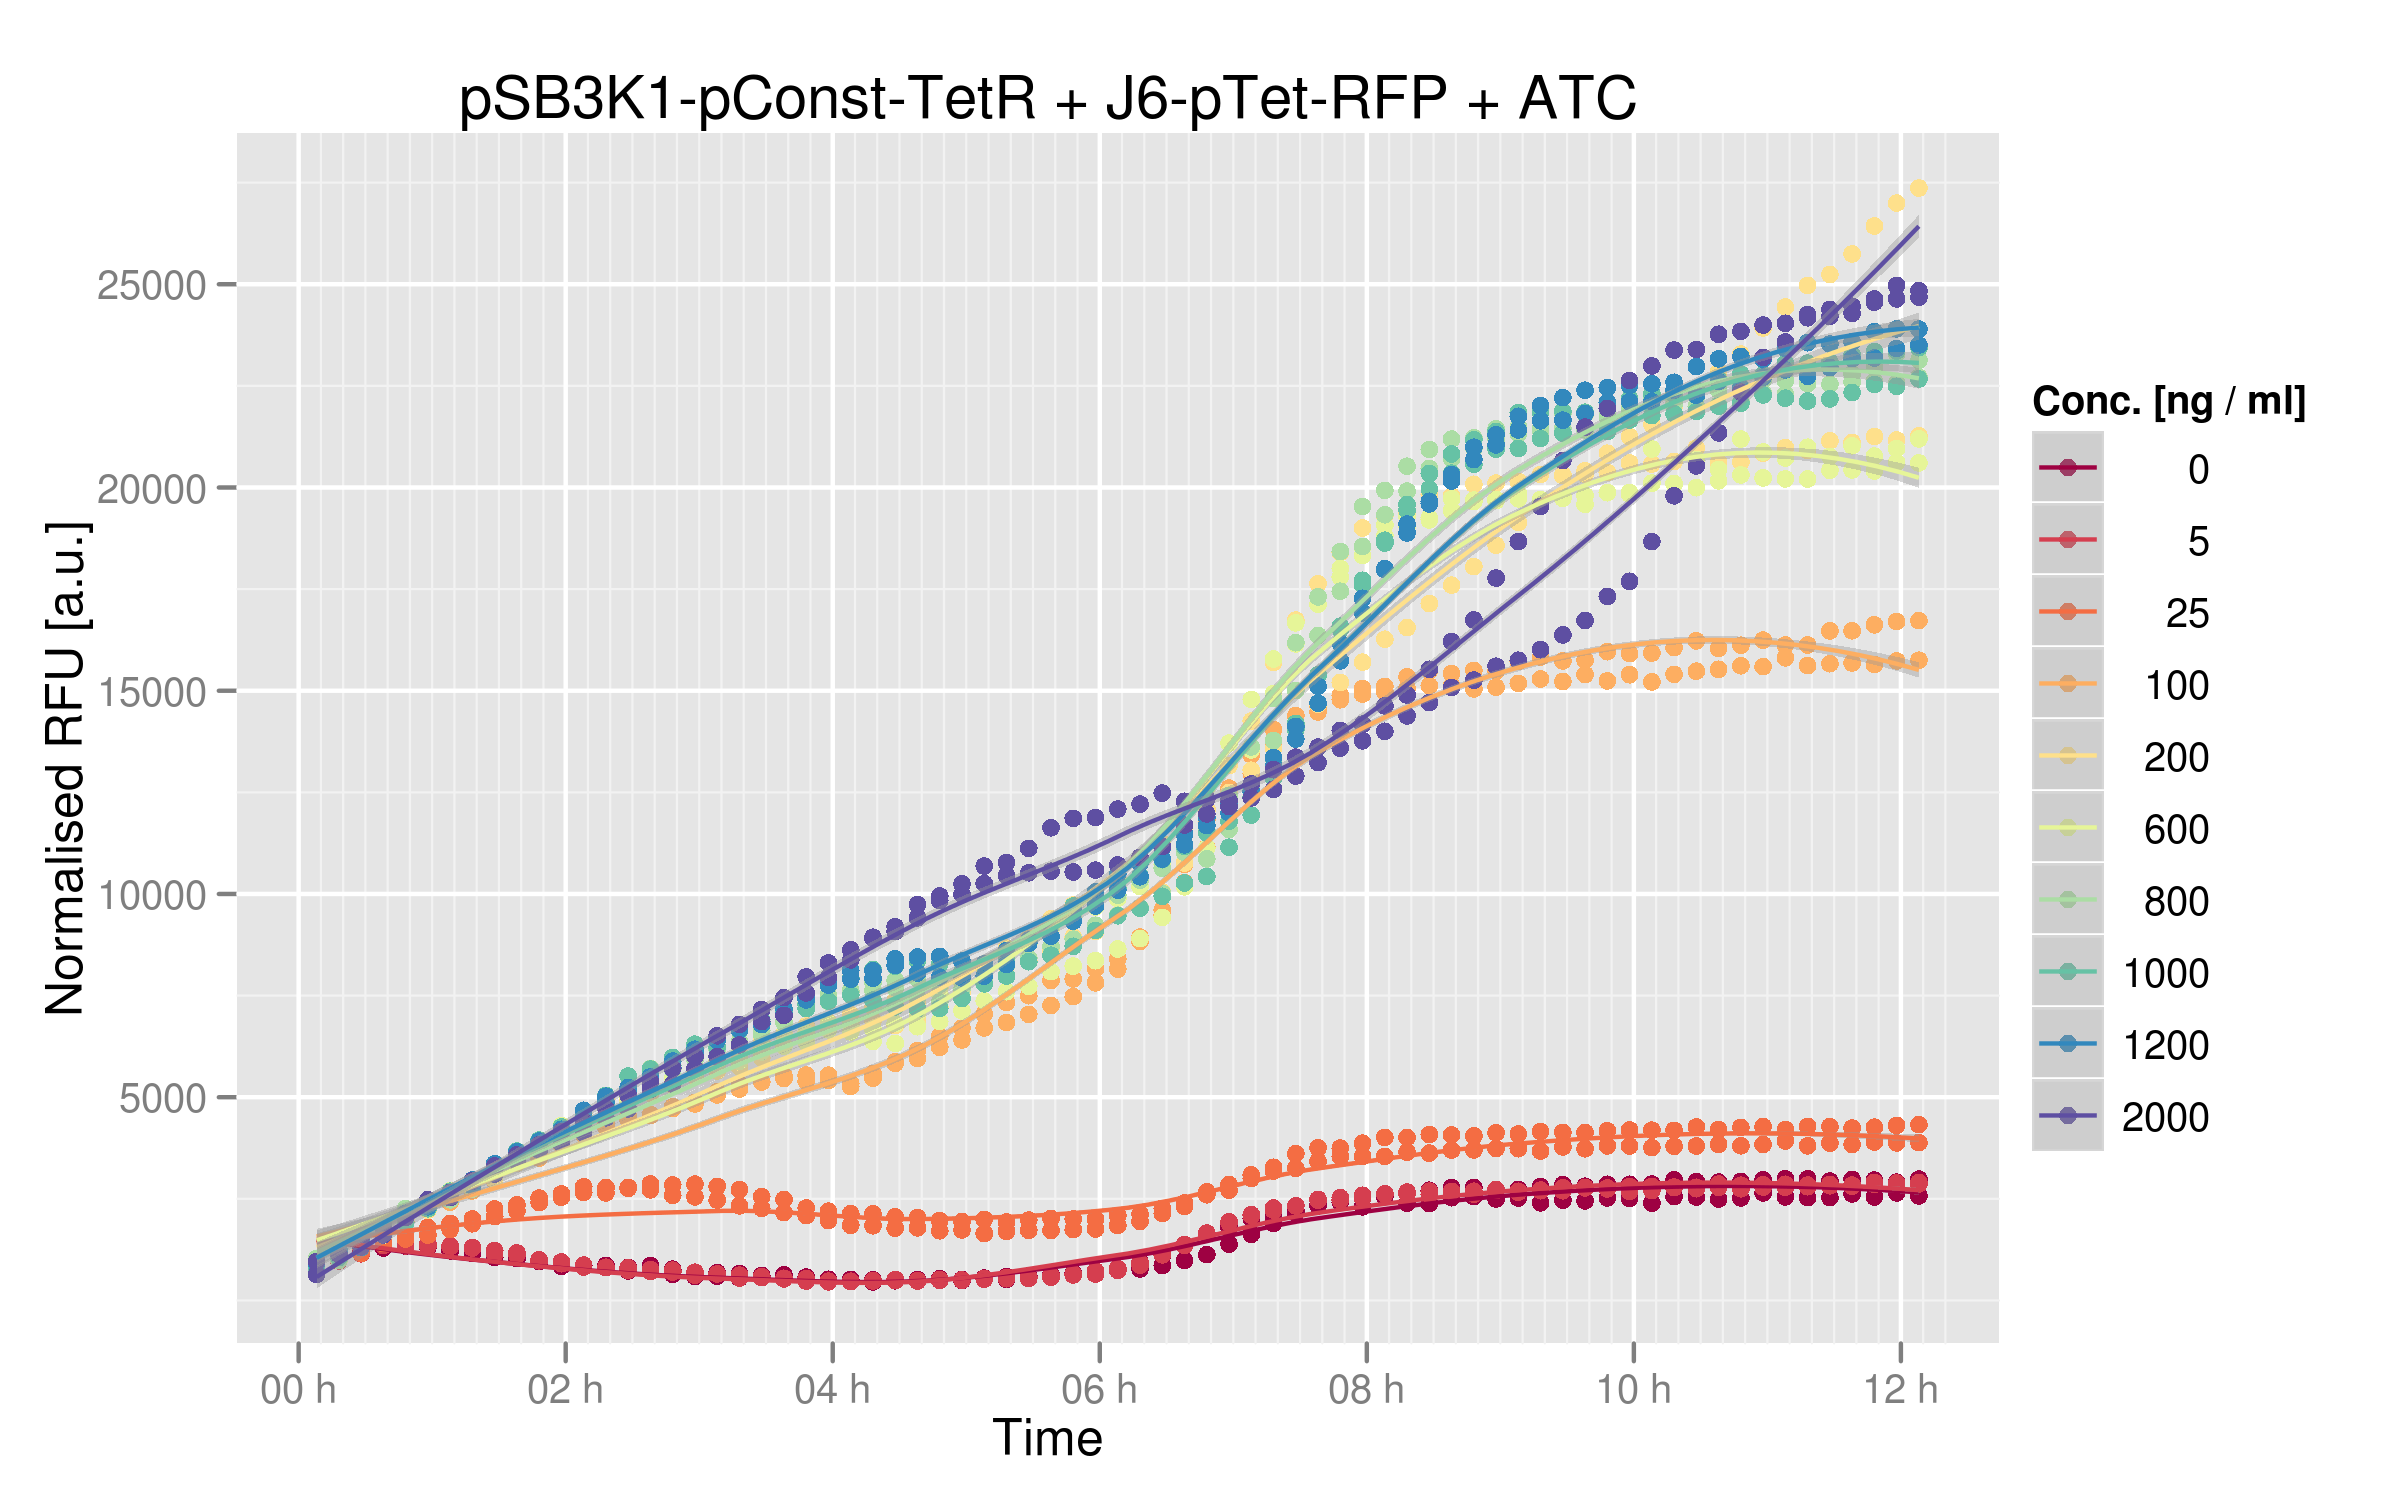
When adding ATC to the co-transformed cells, TetR is repressed and cannot stop RFP anymore, so RFP increases.
The induction curves show that RFP indeed increases with addition of TetR. Without any ATC in the medium, cells express about 2500 normalized RFUs when they reach a plateau, whereas with the highest values of ATC we have 25'000 normalized RFUs. There is a 10x difference between normal medium and additon of ATC, showing that our first readout system is effectively powerful: TetR mutants that would not recognize the consensus Ptet sequence would yield a lot more RFP expression than other mutants recognizing Ptet.
Dose-response
By looking at the dose-response graph, we can see a significant increase between 0 and 200 ng/microL ATC; then the RFUs are quite stable. Here again, the interaction TetR-Ptet has a strong impact on the output (i.e. normalized RFUs).
Readout system - TetR, LacI and RFP
This second readout system is composed of 3 genes: TetR under pConst control, LacI under pTet control (playing the role of an inverter) and finally RFP under pLac control. Here, RFP is induced when TetR binds to pTet. Lysis cassette can be put instead of RFP in thy system, having as a consequence that the cells where TetR mutants bind to pTet would lyse.
To get this readout system, we cotransformed pSB3K1 Pconst-TetR Ptet-LacI with J61002 Plac-RFP. Unfortunately, the sequence of Ptet in front of LacI got mutated during the assembly process, resulting in only a partial repression of LacI by TetR. Still, our results do show the effects of TetR and LacI on the whole system. For more details about the plasmids, please refer to the "Reporter plasmids" tab in the "Our project" menu.
ATC induction
ATC dose-response curve
IPTG induction
IPTG dose-response curve
 "
"


