Team:Edinburgh/Phage Replication
From 2011.igem.org
Phage Replication
A basic activity in biorefinery consists of the degradation of cellulose, due to the presence of enzymes. We are not only concerned with the activities and the amount of enzymes, but also with metabolism and activities of bacteriophage.
Contents |
M13 Replication
M13 is a filamentous bacteriophage: a worm-like virus approximately 1 um long with a 10 nm diameter that infects only E.coli.
- The viral particle consists of a single-stranded, closed circular DNA core surround by a protein coat.
- Prior to virus assembly, the coat proteins are fixed in the bacterial membrane by transmembrane domains.
- During assembly, viral DNA is extruded through the membrane and concomitantly enveloped by coat proteins.
- The ends of the assembled virus are capped by four minor coat proteins, and the length of the filament is covered by several thousand copies of the major coat protein(P8).
- The M13 phage attacks E. coli (host), multiplies in the host cell cytoplasm, and is released without causing the bacteria’s death (non-lytic).
Phage dynamic model
At first thought, the rate of change of population = production rate of population - loss rate of population.
For non lytic M13 phage
- dx/dt=a*k1*x-b*v*x
- Rate of change of quantity of uninfected E. coli equals to the uninfected E. coli replicate itself minus the E. coli infected by M13 phage.
- dy/dt=a*k2*y+b*v*x
- Rate of change of quantity of infected E. coli equals to the quantity of infected E. coli replicate itself plus the E. coli infected by M13 phage.
- dv/dt=c*y-b*v*x-m*v
- Rate of change of quantity of free phage equals to the phage released by infected E. coli minus the phage which is to infect an E. coli and the decayed phage.
- X(t) — uninfected E. coli
- Y(t) — infected E. coli
- V(t) — free phage
- a — replication coefficient of E. coli
- b — transmission coefficient of phage
- c — replication coefficient of phage
- m — decay rate of phage
- K1, K2 — account for the difference of the rate of replication between infected E.coli and uninfected E.coli
Simulations
The MATLAB code uses a Runge-Kutta method of order four to solve the system.
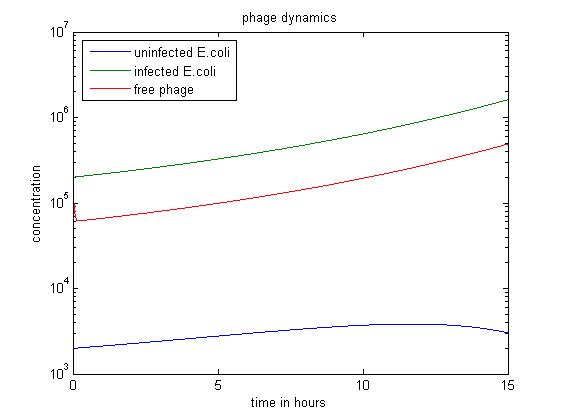
- The above figure shows a simulation going over 15 hours.
- The simulation shows when the amount of uninfected E.coli is significantly smaller than others, the infected E. coli population dominates.
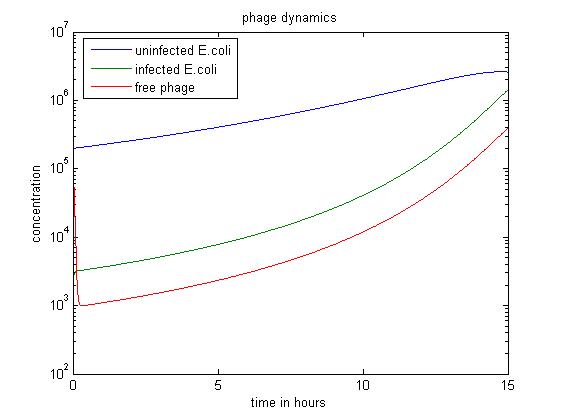
- The above figure shows a simulation going over 15 hours.
- The simulation shows when the amount of infected E.coli is significantly smaller than others, the infected E. coli population dominates as well.
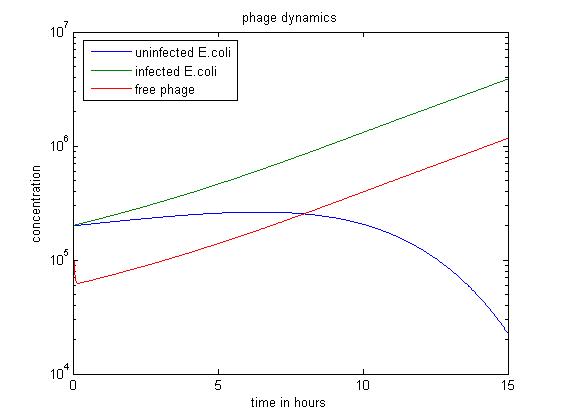
In some cases a increase of the slope of decrease of uninfected E.coliis observed. This means probably that as the population of free phage increasing, more e.coli can be infected by phage.
References
- Gregory A. Weiss, Sachdev S. Sidhu(2000)[http://www.utoronto.ca/sidhulab/pdf/08.pdf: Design and Evolution of Artificial M13 coat Proteins]
- Slonczewski JL, Foster JW (2010) [http://www.wwnorton.com/college/biology/microbiology2/ch/11/etopics.aspx Microbiology: An Evolving Science], 2nd edition. W. W. Norton & Company
- Robert J.H Payne, Vincent A. A. Jansen(2011)[http://personal.rhul.ac.uk/ujba/115/jtb01.pdf Understanding Bacteriaphage therapy as a density-dependent kinetic process]
- Cattoen C (2003) [http://msor.victoria.ac.nz/twiki/pub/Groups/GravityGroup/PreviousProjectsInAppliedMathematics/bacteria-phage_REPORT.pdf Bacteriaphage mathematical model applied to the cheese industry]
- A.O. Converse, J.D. Optekar(1993) [http://onlinelibrary.wiley.com/doi/10.1002/bit.260420120/pdf: A synergistic Kinetics Model for Enzymatic Cellulose Hydrolysis Compared to degree-of-synergism Experimental Results]
- Kadam KL, Rydholm EC, McMillan JD (2004) [http://onlinelibrary.wiley.com/doi/10.1021/bp034316x/full: Development and Validation of a Kinetic Model for Enzymatic Saccharification of Lignocellulosic Biomass]
 "
"


