Team:EPF-Lausanne/Our Project/Reporter Systems/lacI
From 2011.igem.org
(→IPTG induction) |
|||
| Line 53: | Line 53: | ||
Gene expression in the cell without IPTG: | Gene expression in the cell without IPTG: | ||
[[File:EPFL_3reporter_ss.JPG|350px]] | [[File:EPFL_3reporter_ss.JPG|350px]] | ||
| - | |||
Gene expression in the cell with IPTG: | Gene expression in the cell with IPTG: | ||
[[File:EPFL_3reporter_IPTG.JPG|400px]] | [[File:EPFL_3reporter_IPTG.JPG|400px]] | ||
| - | |||
Below you can see the induction curves with different IPTG concentrations added in the cell's medium: | Below you can see the induction curves with different IPTG concentrations added in the cell's medium: | ||
[[File:EPFL_Nadine-exp5-induction.png|600px]] | [[File:EPFL_Nadine-exp5-induction.png|600px]] | ||
| + | |||
Indeed, RFUs increase 8-fold between zero IPTG and the highest concentrations. Note that the RFU intensity for the curve with no IPTG matches the intensity of the curve with no ATC in the ATC induction experiment, showing that these two experiments are consistent. The curves with the highest IPTG concentrations are not overlapping, indicating that we could repress LacI even further with higher IPTG concentrations. | Indeed, RFUs increase 8-fold between zero IPTG and the highest concentrations. Note that the RFU intensity for the curve with no IPTG matches the intensity of the curve with no ATC in the ATC induction experiment, showing that these two experiments are consistent. The curves with the highest IPTG concentrations are not overlapping, indicating that we could repress LacI even further with higher IPTG concentrations. | ||
Latest revision as of 20:16, 28 October 2011
In Vivo Characterization
In vivo Main | TetR-RFP System | TetR-LacI-RFP System | Ptet Characterization | Plac Characterization | Plasmid DetailsContents |
TetR - LacI - RFP System
Description
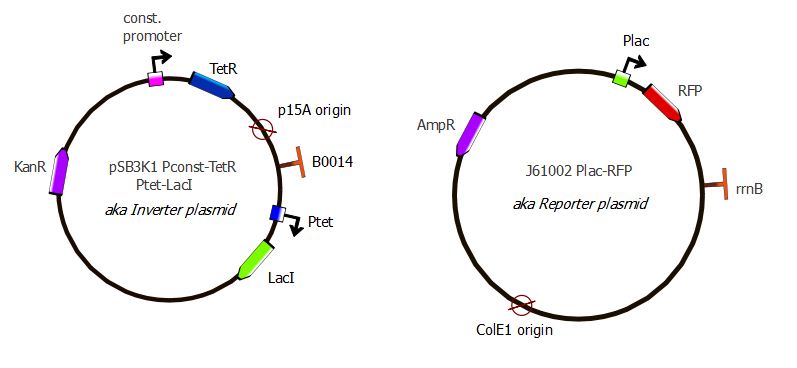
Our second readout system contains LacI in addition to TetR and RFP. TetR is still induced by a constitutive promoter, then LacI is under Ptet regulation and RFP is under Plac regulation. LacI plays the role of an inverter, in order to measure directly TetR-Ptet interactions: if TetR binds to Ptet, LacI is not expressed, so RFP is not repressed and is instead expressed. Here, TetR mutants with a higher binding affinity for Ptet will result in higher levels of RFP expression. There will be a direct proportional link between RFP expression levels and TetR binding affinity, which is more convenient that the inverted readout obtained in the TetR-RFP system.
Here also we have a two-plasmid system: TetR and LacI are placed on the pSB3K1 Pconst-TetR Ptet-LacI plasmid whereas RFP is on the J61002 Plac-RFP plasmid. You can read more about these plasmids on the plasmids details page.
Experimental validation - with wild-type TetR
As discussed above, our second readout system is based on both TetR and LacI. To validate our construct, we repressed the two transcription factors sequentially with ATC and IPTG, respectively. Details of these experiments are given in the following sections.
ATC induction
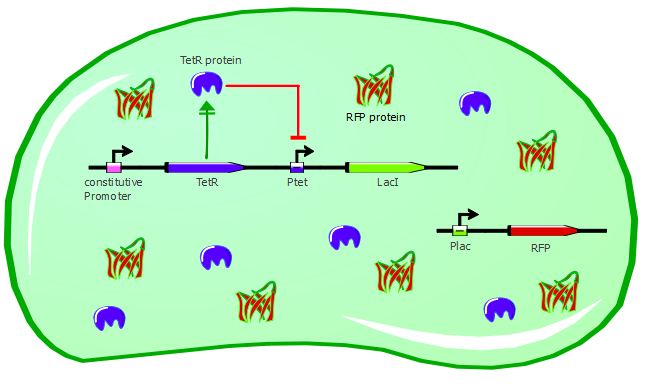
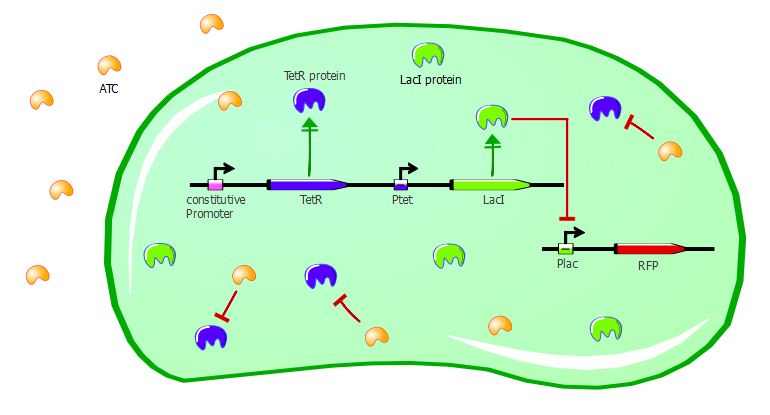
Adding ATC in the medium of the co-transformed cells will inactivate TetR. As a consequence, LacI will be expressed and RFP will be repressed, as shown in the cartoons below. We should then see a decrease of RFUs correlating with increasing concentrations of ATC.
Gene expression in the cells without ATC:
Gene expression in the cells with ATC:
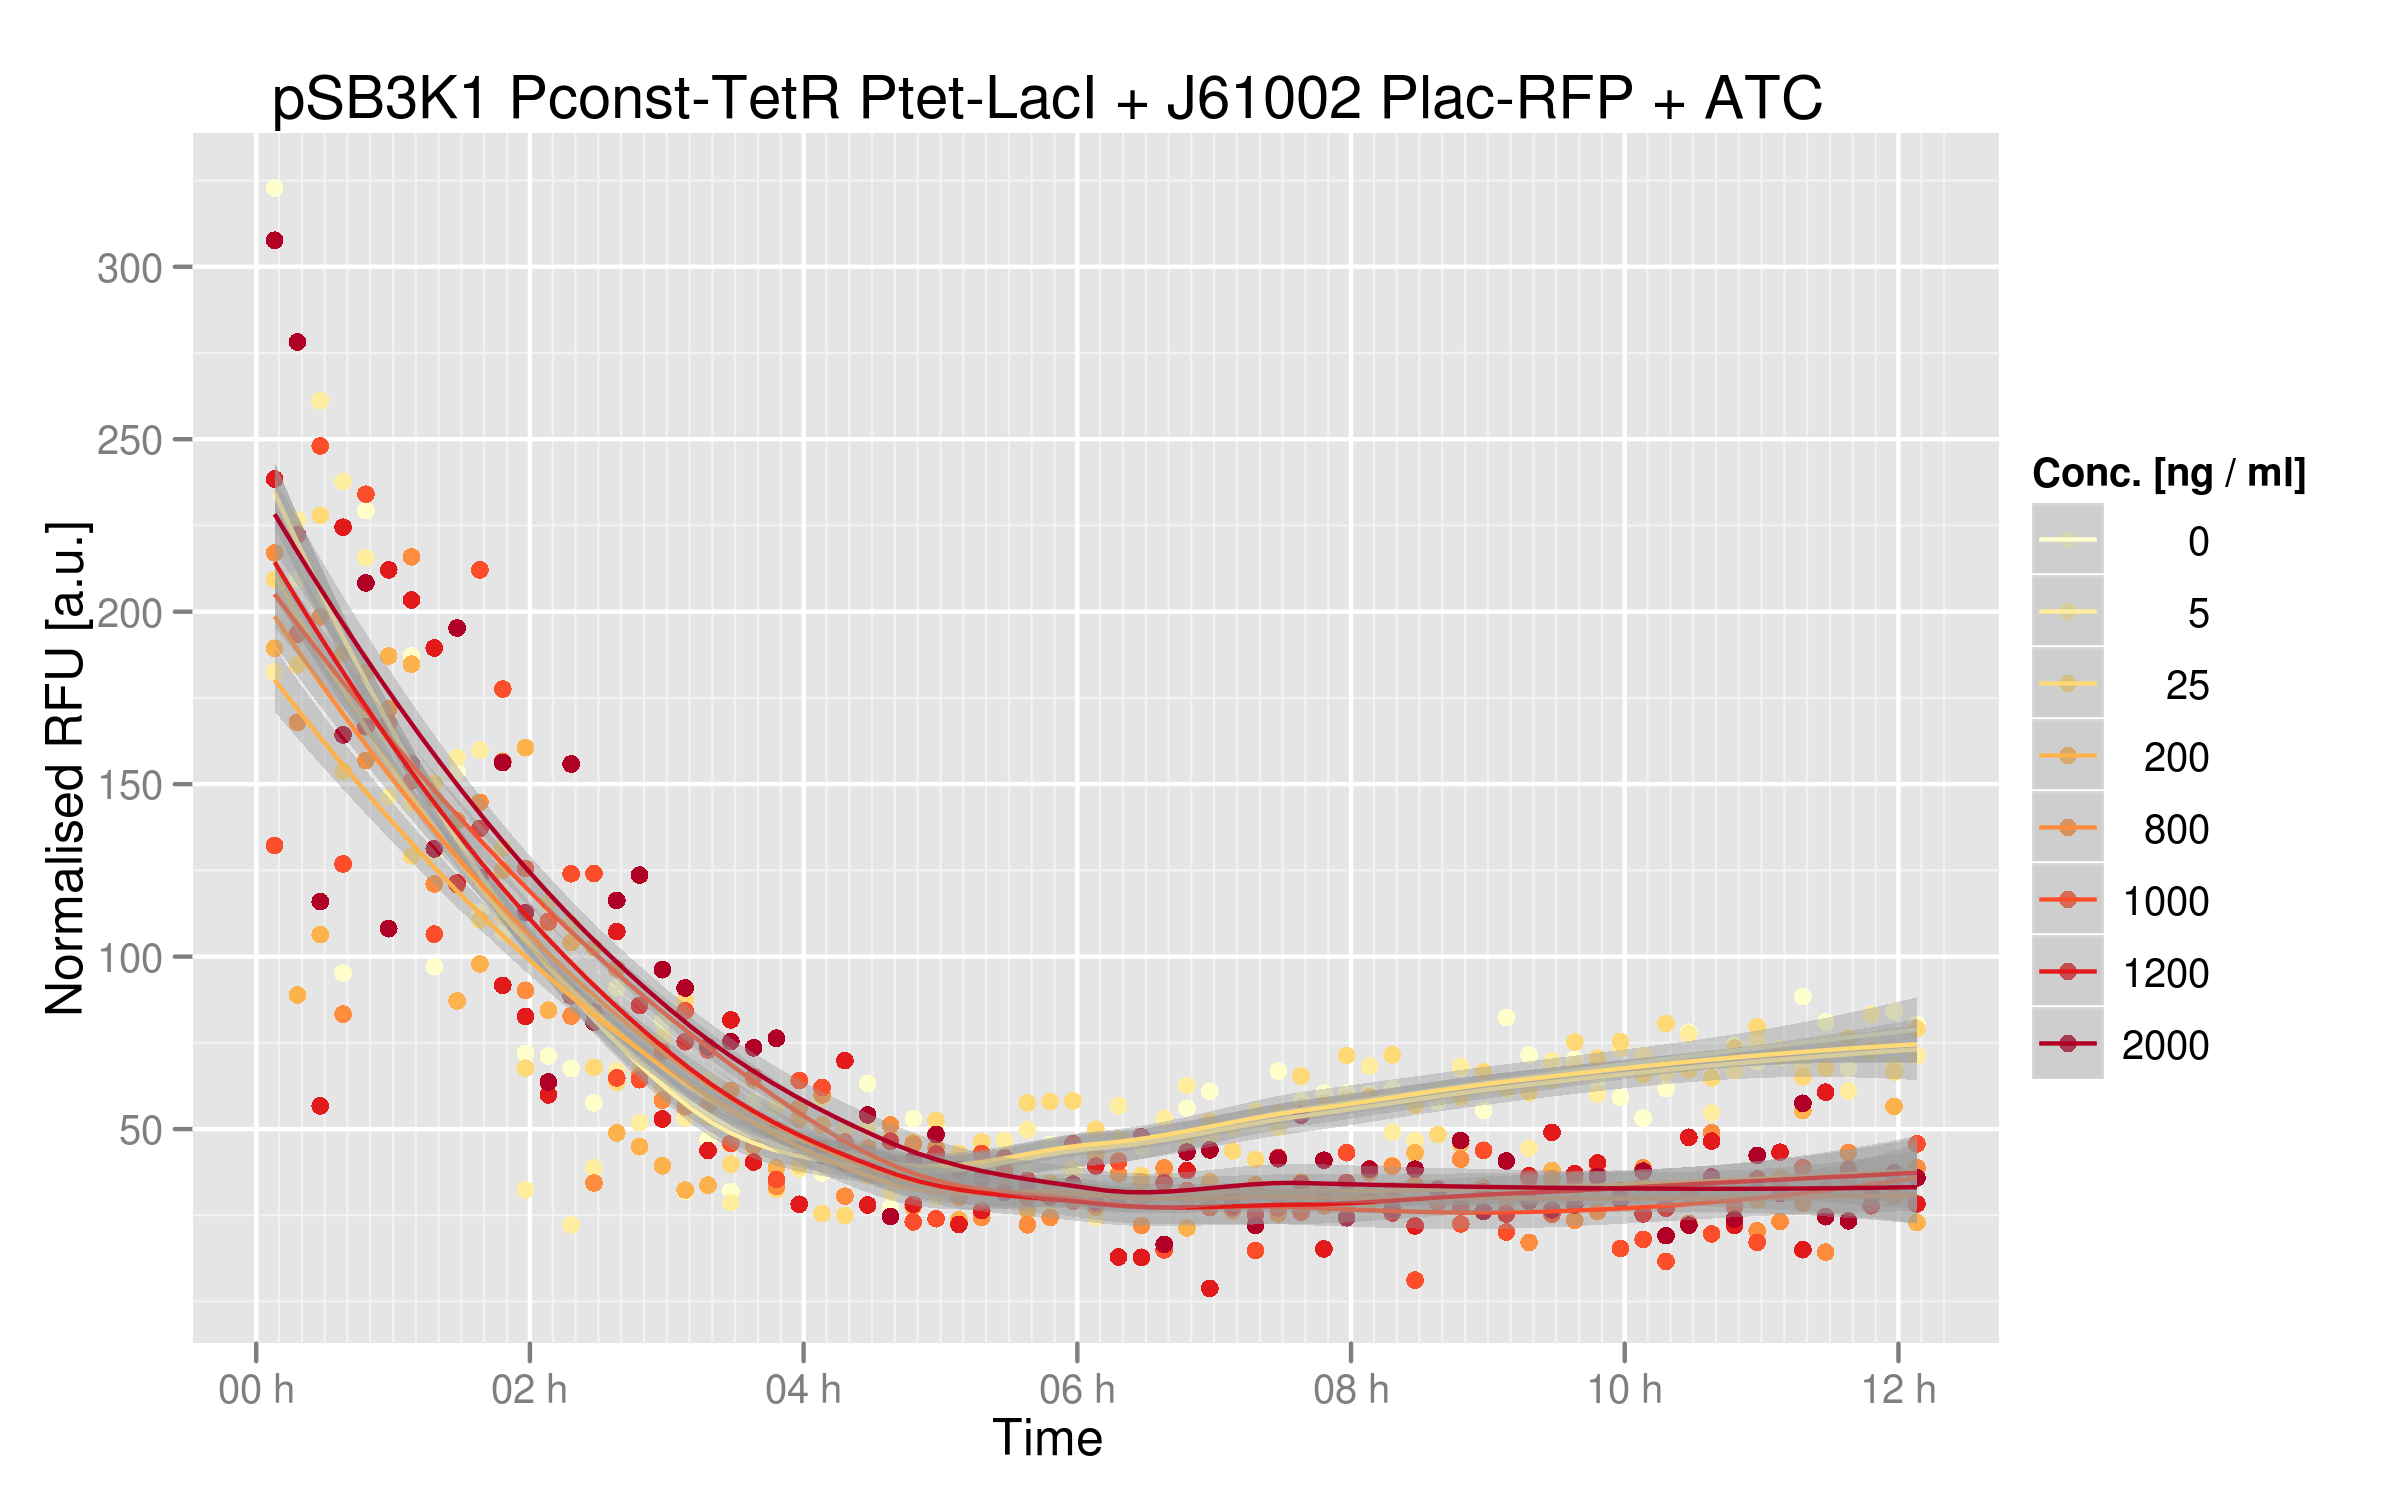
With the wild-type TetR, the induction curves at different ATC concentrations added to the growth medium are shown here:
With zero or low concentrations of ATC in the cells' medium, RFP expression is quite weak. Normally, we should see RFP expression since TetR binding to Ptet is not hindered by ATC. However, Ptet has been mutated when added to our plasmids and thus TetR can't repress LacI efficiently. LacI being still produced in the cell, RFP is repressed even when TetR binds to Ptet. Nevertheless, our results show a decrease in RFP expression when we add sufficient amounts of ATC. Even in our mutated system, TetR interaction with Ptet still has an effect on the output. There is a 2-fold difference between high ATC concentrations and zero ATC; we believe that by restoring the Ptet sequence, this difference would be higher, then allowing a detection window wide enough for characterizing mutants.
ATC dose-response curve
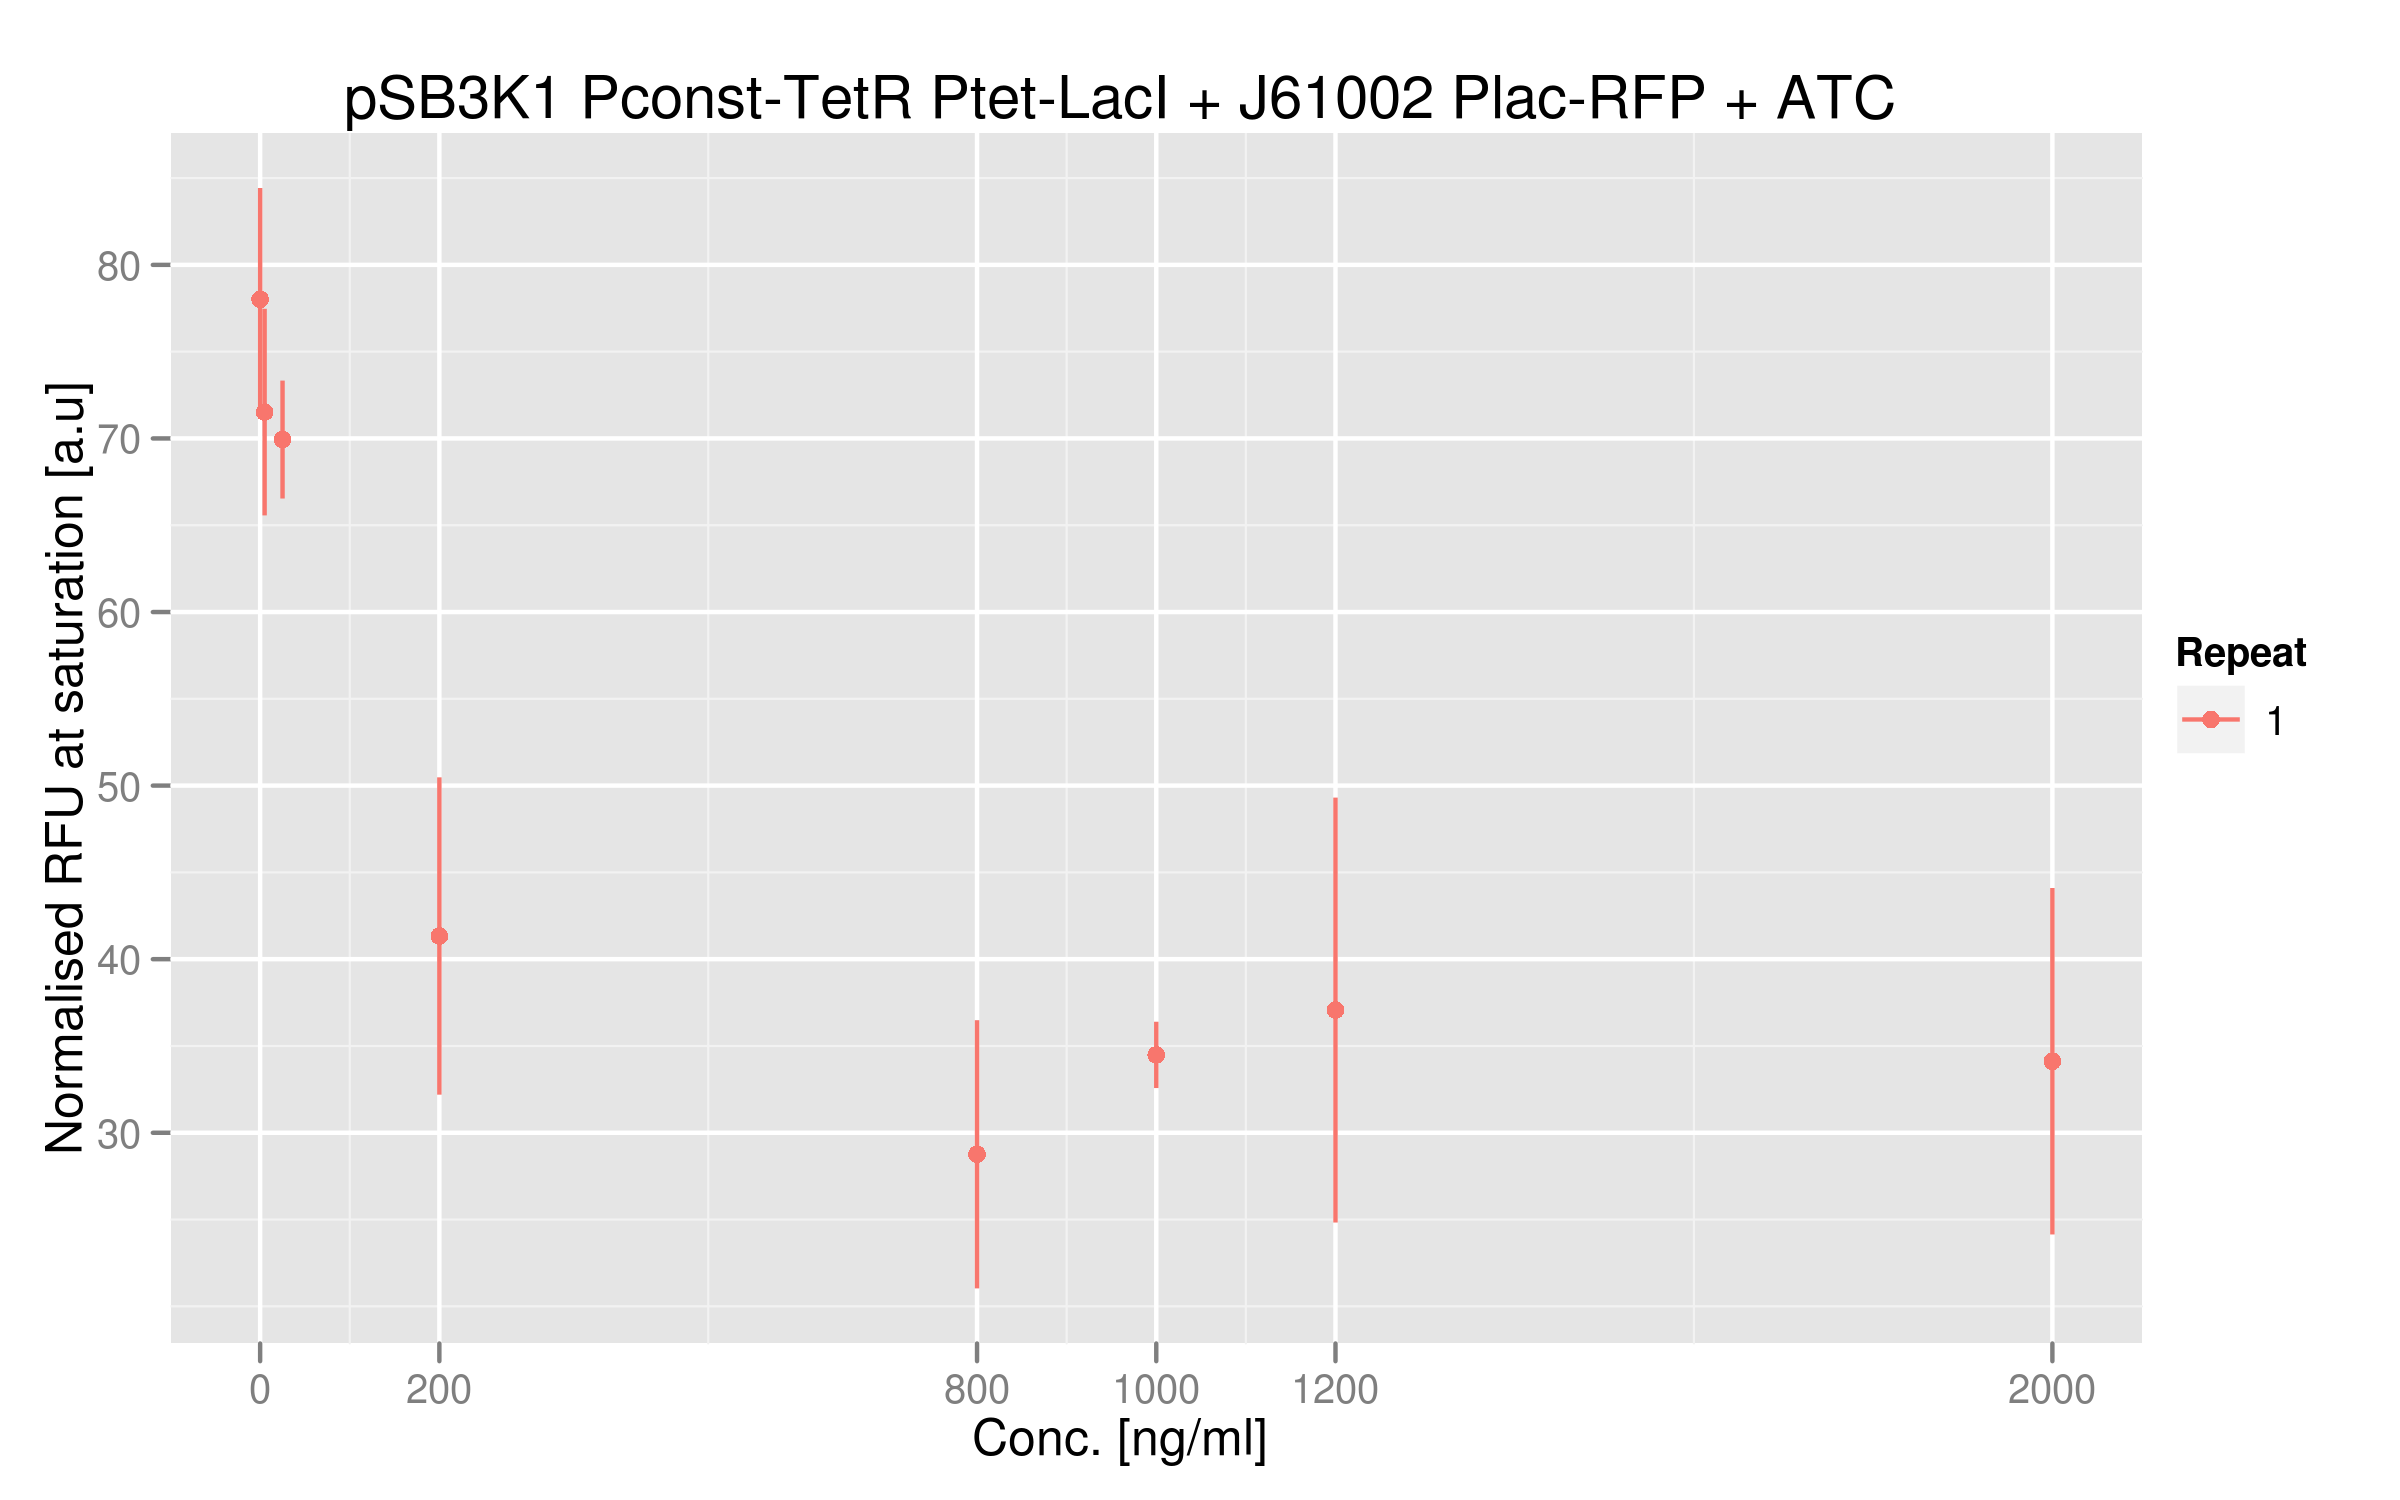
This graph shows more clearly the difference of normalized RFUs for low or high concentrations of ATC - even if the intensities are low. As in our first readout system, the highest ATC efficiency seems to be reached with 200 ng/microL already.
IPTG induction
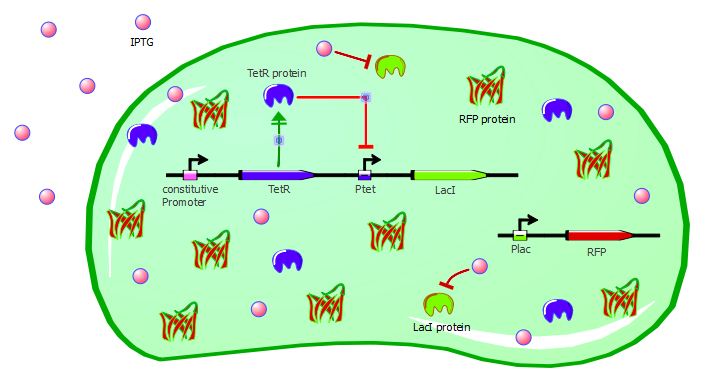
IPTG will inactivate LacI, so that RFP will be more highly expressed as depicted in the cartoons below. From this we expect an increase in RFP expression with increasing IPTG concentration in the medium.
Gene expression in the cell without IPTG:

Gene expression in the cell with IPTG:
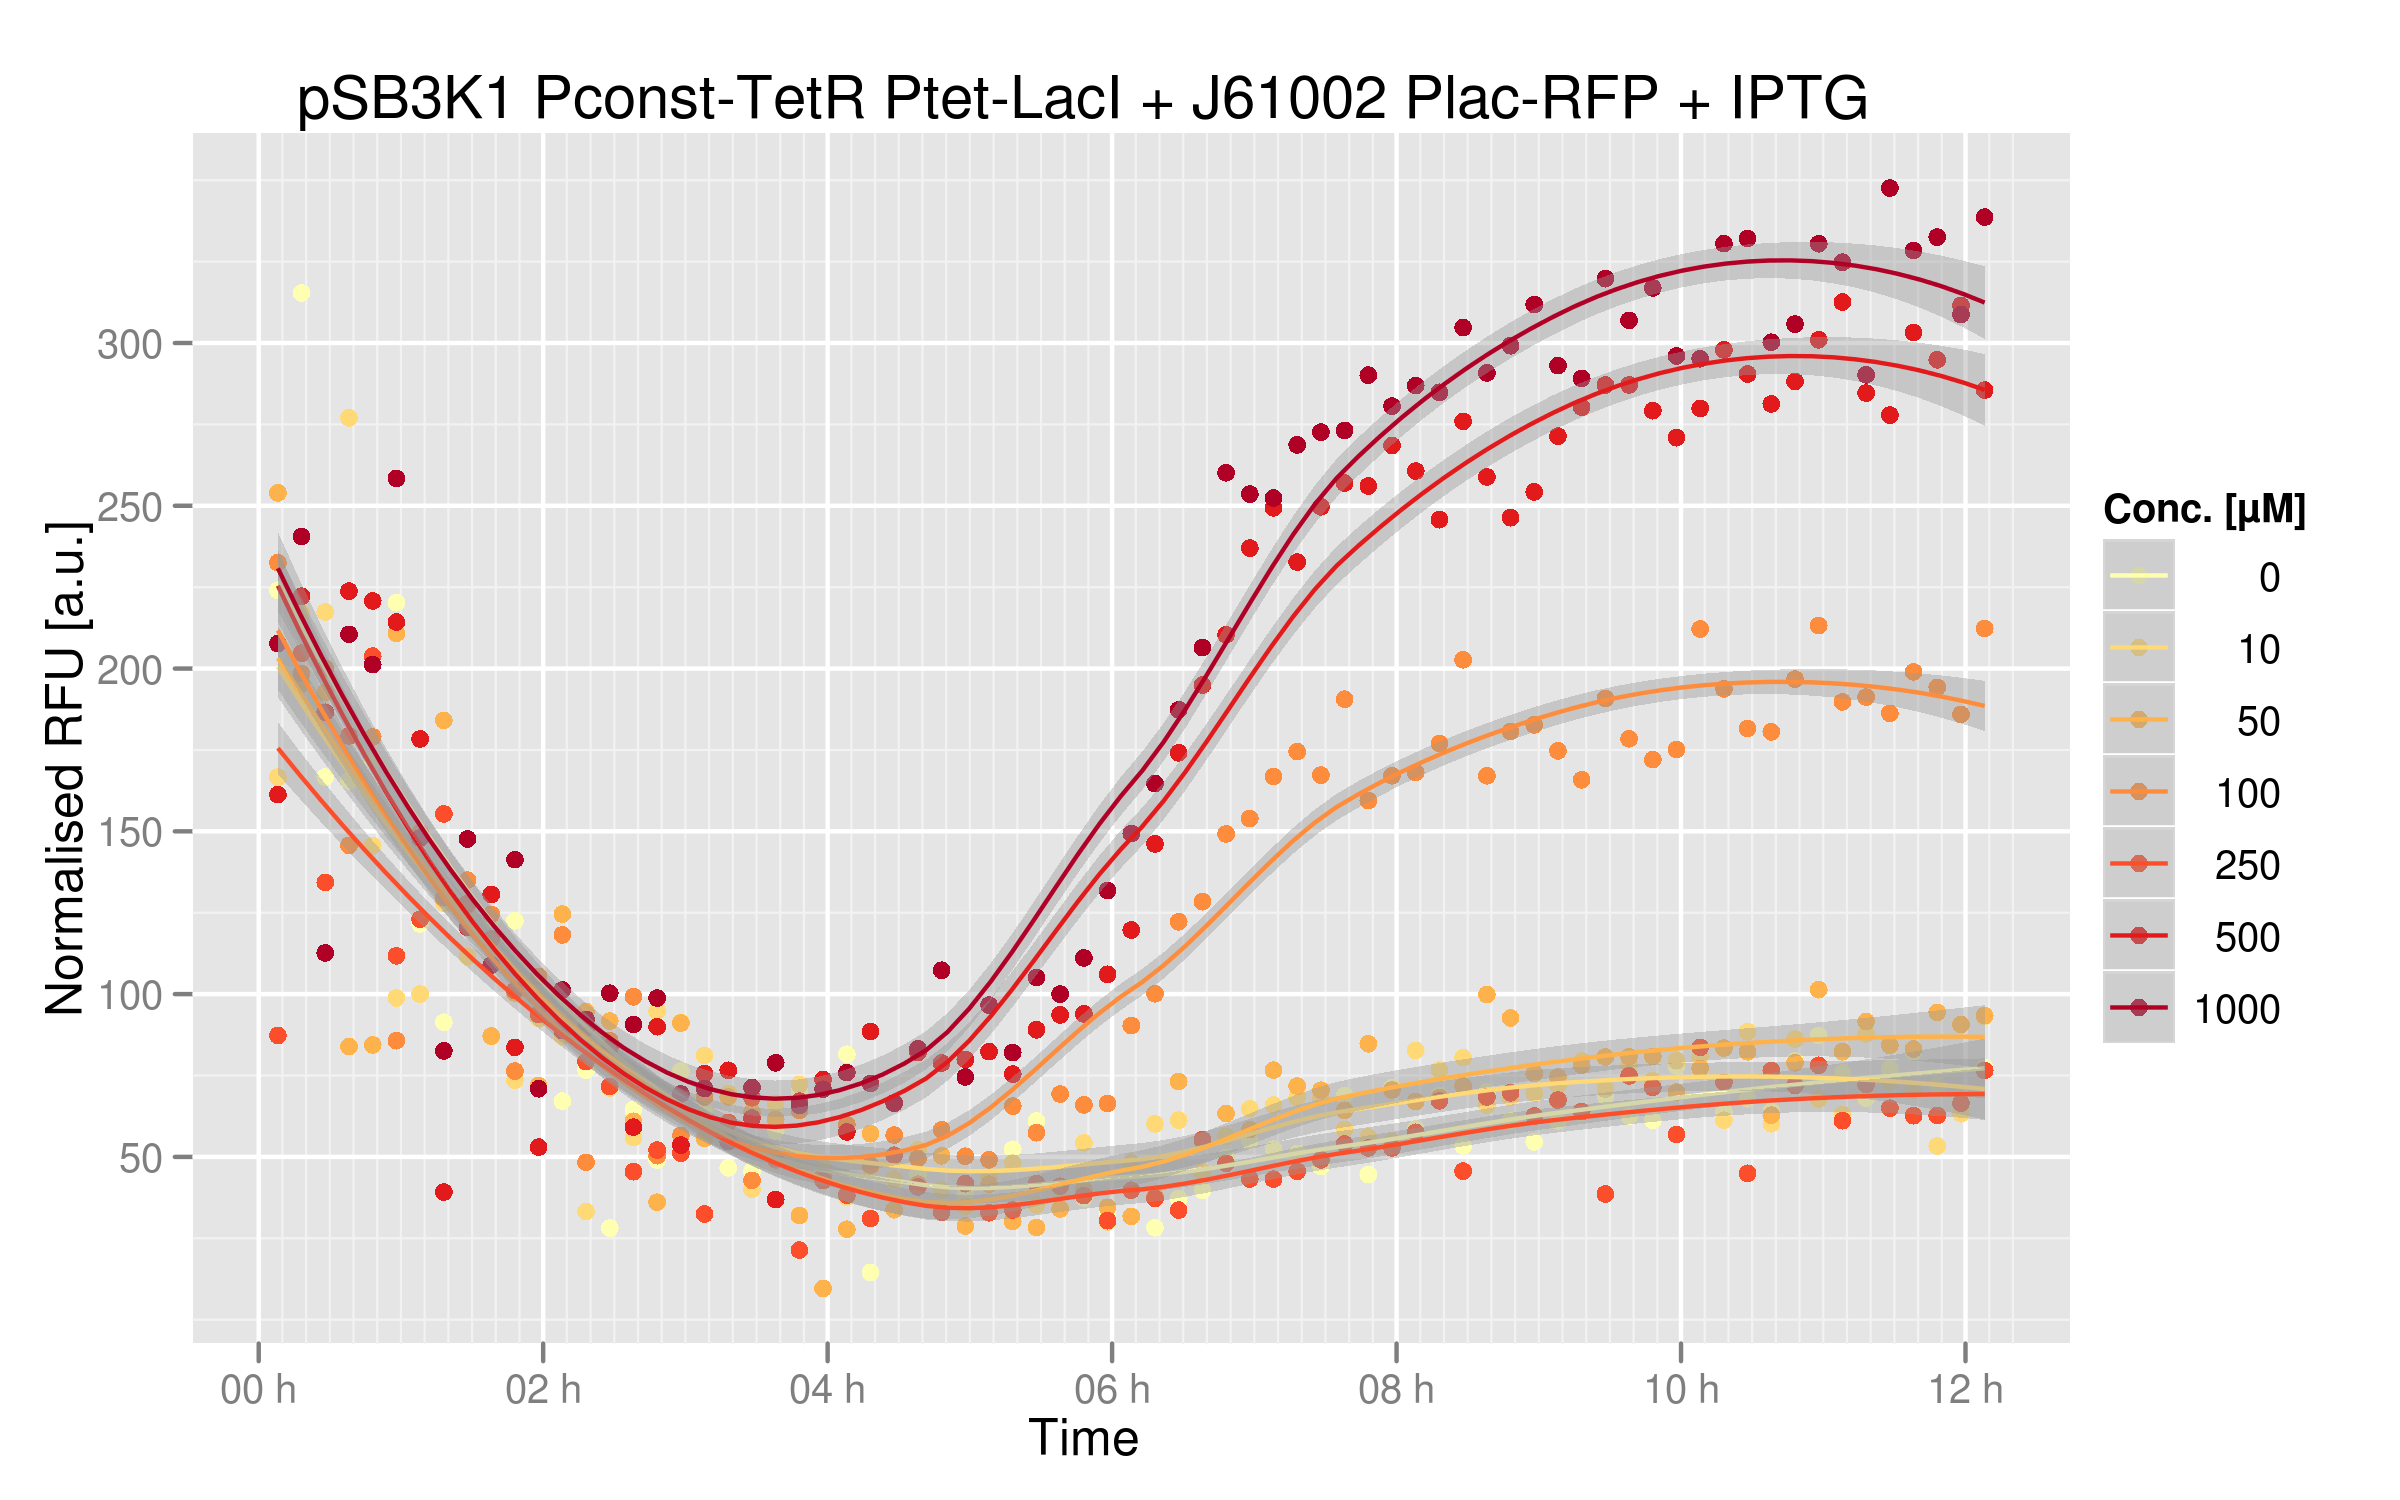
Below you can see the induction curves with different IPTG concentrations added in the cell's medium:
Indeed, RFUs increase 8-fold between zero IPTG and the highest concentrations. Note that the RFU intensity for the curve with no IPTG matches the intensity of the curve with no ATC in the ATC induction experiment, showing that these two experiments are consistent. The curves with the highest IPTG concentrations are not overlapping, indicating that we could repress LacI even further with higher IPTG concentrations.
You can compare these results with the characterization of Plac alone. Without IPTG, RFP expression is much lower than the real Plac strength; thus LacI has a powerful effect on our system by limiting RFP expression
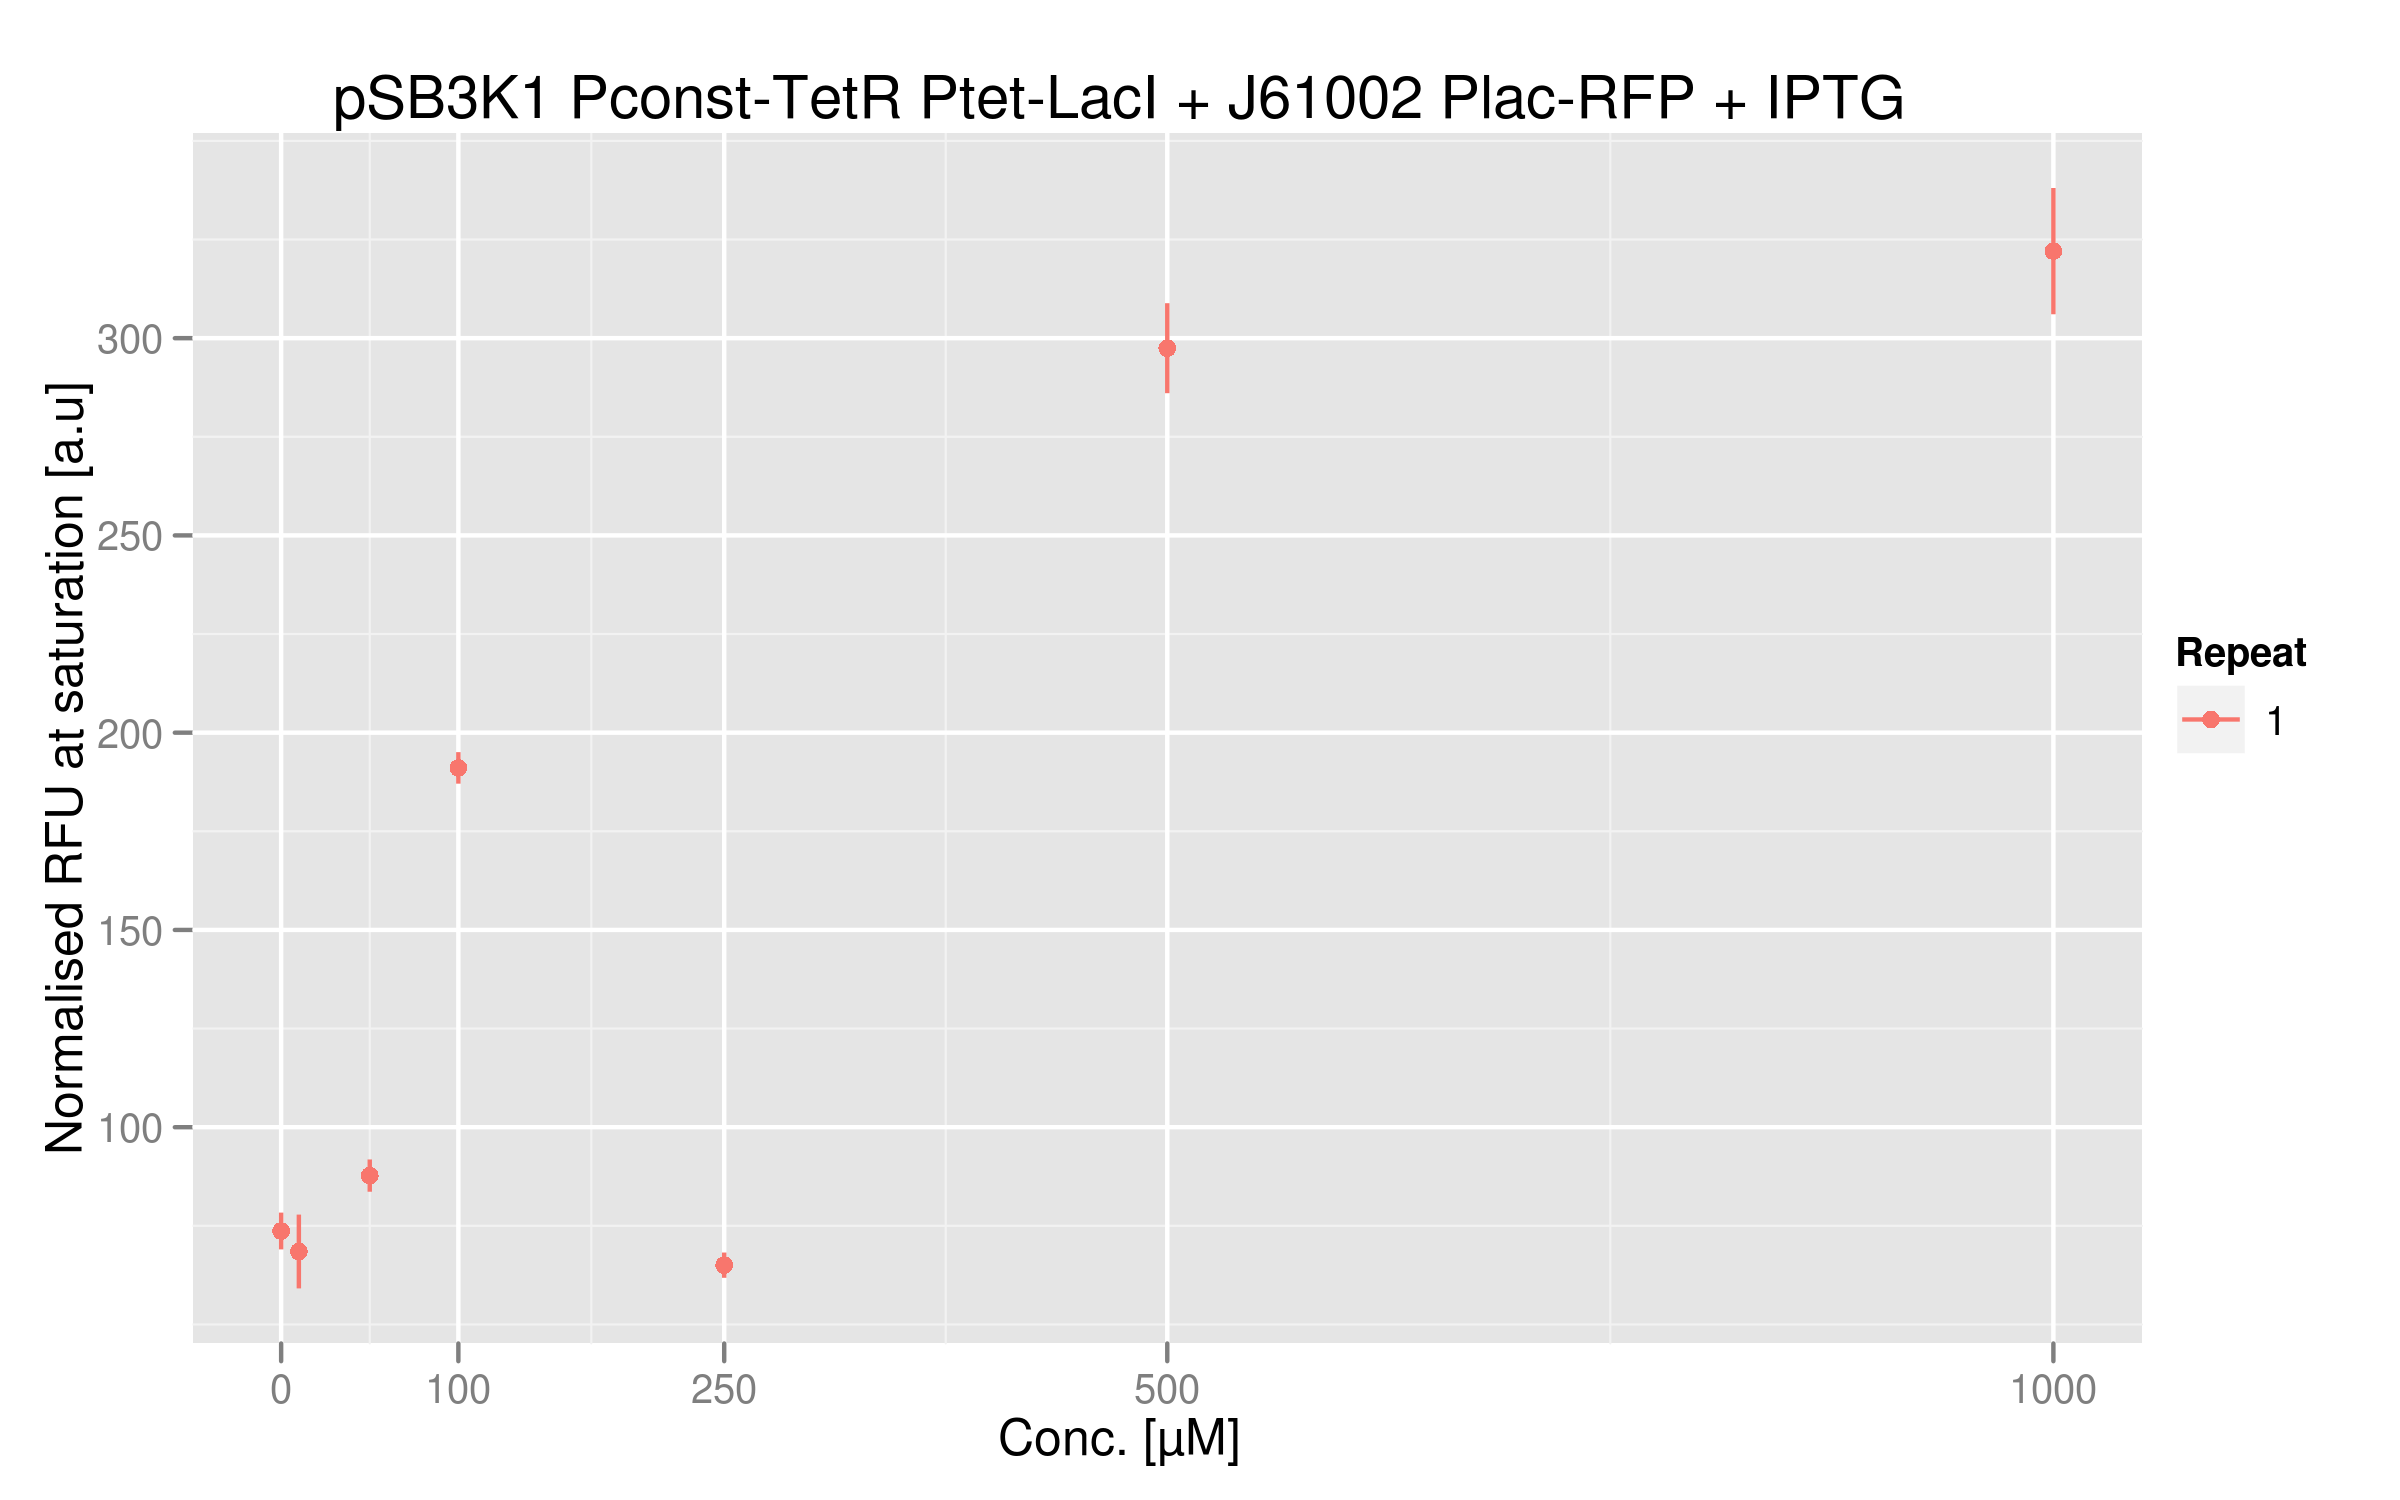
IPTG dose-response curve
Even if the RFU range is small, there is a clear parallel between RFUs intensities and IPTG dosage. An 8-fold difference between the two extremes can be sufficient for an effective and reliable readout system; however we could use a stronger Plac promoter to get more RFP expression and perhaps a bigger difference.
 "
"

