Team:UT-Tokyo/Project/Results
From 2011.igem.org
(Difference between revisions)
| Line 110: | Line 110: | ||
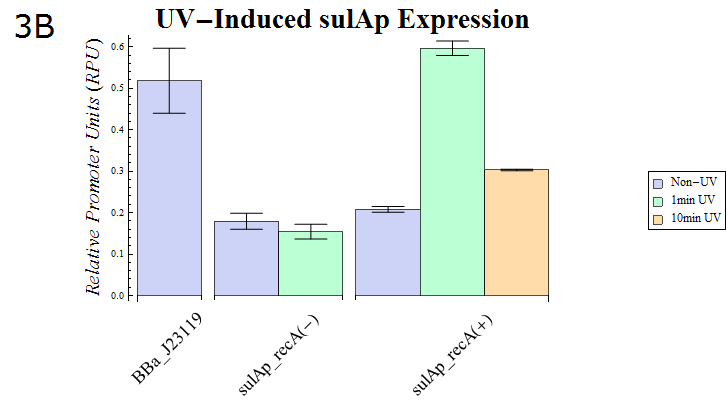
:{{:Team:UT-Tokyo/Templates/Image|file=Ut_Uv-induced_sulAp_expression.png|option=700px|caption =|desc = ''Fig. 3B'': The result of a Dual luciferase assay assayed for the sulA promoter. Strains possessing recA and those lacking the gene were transformed. The transformed <i>E. coli</i> were split into dishes after they were cultured until the OD600 is 0.4-0.6. They were then exposed to UV (15W / 254nm) for the shown durations while agitating gently. After UV irradiation finished, they were cultured for recovery for 30 min. at 37° C. Then, the cells were lysed and assayed using our system.}} | :{{:Team:UT-Tokyo/Templates/Image|file=Ut_Uv-induced_sulAp_expression.png|option=700px|caption =|desc = ''Fig. 3B'': The result of a Dual luciferase assay assayed for the sulA promoter. Strains possessing recA and those lacking the gene were transformed. The transformed <i>E. coli</i> were split into dishes after they were cultured until the OD600 is 0.4-0.6. They were then exposed to UV (15W / 254nm) for the shown durations while agitating gently. After UV irradiation finished, they were cultured for recovery for 30 min. at 37° C. Then, the cells were lysed and assayed using our system.}} | ||
| - | :''Fig. 3B'' shows the sulAp strength after exposure to UV (15W / 254nm) for a minute. recA is required for expression from the sulAp and therefore a strain lacking the gene is used as a negative control. The relative activity of sulAp decreased after 10 minutes exposure of the same strength compared with that after 1 minutes exposure. This suggests that many E.coli died as a result of the 10 minute exposure. In support of this hypothesis, the OD of <i>E. coli</i> exposed to UV for 10 minutes was less than that of E.coli exposed for 1 minute (data not shown) after a 30 minute recovery culture.<!--回復培養でのそれぞれのODの違いはこれを裏付けるだろう--> | + | :''Fig. 3B'' shows the sulAp strength after exposure to UV (15W / 254nm) for a minute. recA is required for expression from the sulAp and therefore a strain lacking the gene is used as a negative control. The relative activity of sulAp decreased after 10 minutes exposure of the same strength compared with that after 1 minutes exposure. This suggests that many E.coli died as a result of the 10 minute exposure. In support of this hypothesis, the OD of <i>E. coli</i> exposed to UV for 10 minutes was less than that of ''E.coli'' exposed for 1 minute (data not shown) after a 30 minute recovery culture.<!--回復培養でのそれぞれのODの違いはこれを裏付けるだろう--> |
:A detailed explanation of our system can be shown in Data section, and full method can be shown in Method section. | :A detailed explanation of our system can be shown in Data section, and full method can be shown in Method section. | ||
:We assayed promoters this time, but the “Dual luciferase assay” system makes it possible to measure not only transcriptional but also translational activity with appropriate control. | :We assayed promoters this time, but the “Dual luciferase assay” system makes it possible to measure not only transcriptional but also translational activity with appropriate control. | ||
Revision as of 01:32, 6 October 2011
Results

iGEM UT-Tokyo
- This page is composed of the results of our experiments.
- The experiments are to evaluate the possibility and potential of our idea and can be divided into two sections: chemoattraction and production of L-Asp, and motility regulation by CheZ. Each page of the two sections includes the goal and methodological outline of experiments carried out as well as the results.
- In addition, we deviced “dual luciferase assay kit” in order to establish better measurement of gene expression. This kit is designed so that luciferase assay can easily be conducted for iGEM-standardized promoters. Explanation and analysis of this kit is given here.
- Details of methods and experimental conditions for each experiment are provided in Method page
Section 1: Cell Assembling System
1. Summary
- To accomplish our system, SMART E. coli, it is required that we make worker cells assemble to guider cells. For this we utilize a property known as chemotaxis. Chemotaxis occurs in bacteria including Escherichia coli. They are believed to be attracted toward certain substances, including L-aspartate (L-Asp). We have tried to make workers attract guiders toward itself by a substrate-stimulated production of L-Asp. When guider cells synthesize L-Asp, worker cells assemble around the guider cells and workers are able to perform their assigned task effectively. Also, we characterized the chemoattraction of E. coli toward L-Asp, and compared the results to a computational simulation. We obtained supportive evidence for the agreement of wet and dry experiments. We propose that, if we get an E. coli secreting enough level of L-Asp, we can devise an inducible cell mustering system.
1.1. The production of L-Asp
- In previous studies accomplished L-Asp over-production, the amount of L-Asp was measured by HPLC [1][2]. However, having no available HPLC-apparaturs, we were unable to use this method, so we tried to detect it in alternative ways.
- We first tried to make E. coli producing L-Asp using the lac promoter, BBa_R0011. WT cells transformed with lacP-RBS-AspA-d.Ter (BBa_K518004) were pre-cultured with 1mM IPTG. The culture was soaked in fumaric acid solution containing annmonia. Note that AspA synthesizes L-Asp from fumaric acid and ammonia. The reaction mix was incubated at 37 degrees celcius for 1 hour. After the incubation, the concentration of L-Asp was measured by ninhydrin staining and ultraviolet-visible spectroscopy. Unfortunately, we were not able to obtain data that was obvious. We had ninhydrin react with L-Asp produced by AspA. However, Ninhydrin probably reacted not only with L-Asp but also with the remaining ammonia.
- The second attempt was TLC. Two microliters of the supernatant of the incubated reaction solution was spotted onto a TLC sillica plate, and extracted with 70% ethanol. We had expected L-Asp and ammonia to be separated. However, it was impractical to separate them using ethanol. We then tried various concentrations of acetone as a developing solvent, only to observe lanes with smears.
- One of the main reasons of the failure is that our methods relied on the ninhydrin reaction. Ninhydrin certainly reacts with L-Asp. However, ninhydrin also reacts with an indispensable substrate of the AspA reaction. We should have selected a way in which only one of the reactants and products can be detected. Now then, the sequencing result shows that Assembling BBa_K518004 was successful. So, it may be possible confirm the result if the right method is selected. For example, L-Asp can be detected by HPLC and the AspA protein can be detected instead of L-Asp.
1.2. The characterization of L-Asp chemotaxis
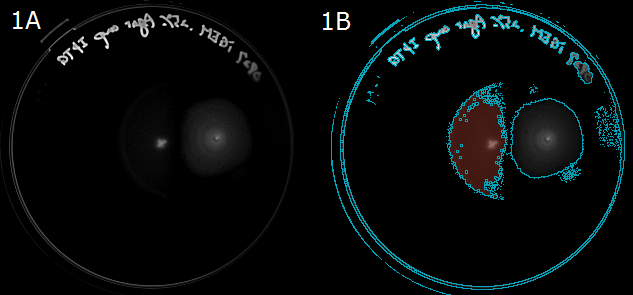
- Next, to show that E. coli moves in the direction of a higher L-Asp concentration, we carried out swarming assays. A WT colony was innoculated into a 0.25% agar LB plate and L-Asp solution was instilled. Plates were left at room temperature. After 20 hours, these plates were photographed. The representative photograph of a swarming colony is shown in Fig. 1A.
- To determine the movement of colonies toward the location of L-Asp instillation, we then performed an image analysis. Obtained images were subjected to computational processing to find edges of the colonies. The processed image is shown in Fig. 1B.
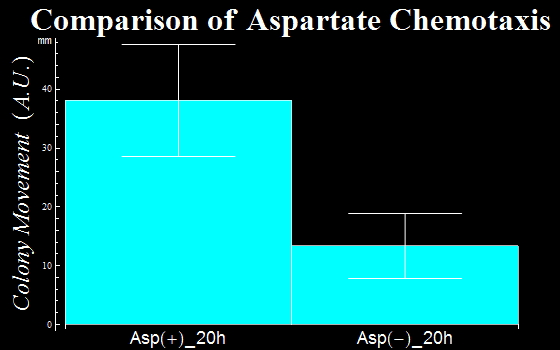
- In this assay, we defined as a vector the distance a colony moves from the center of a colony to the initial tip position. The distances are represented in Fig. 1C. The migration distance of colonies were measured to be 38(±9) mm for a plate with L-Asp solution, while this was 13(±6) mm for a plate without L-Asp. The results clearly show that colonies exposed to the L-Asp solution swarmed significantly, compared to colonies of the control group. Data was averaged from more than 6 experiments.
References
- [1] Chao, Y. P., Lai, Z. J., Chen, P., & Chern, J. T. (1999). Enhanced conversion rate of L-phenylalanine by coupling reactions of aminotransferases and phosphoenolpyruvate carboxykinase in Escherichia coli K-12. Biotechnol Prog, 15(3), 453-458.
- [2] . Chao, Y., Lo, T., & Luo, N. (2000). Selective production of L-aspartic acid and L-phenylalanine by coupling reactions of aspartase and aminotransferase in Escherichia coli. Enzyme Microb Technol, 27(1-2), 19-25.
Section 2: Cell Arrest System
2. Summary
- To maintain the once elevated cell density, we then design a substrate-induced Cell Arrest System. To realize a cell arrest, we controlled the expression of cheZ, one of the flagellum-regulating genes in Escherichia coli, in a cheZ-defective strain (JW1970). We first constructed an inducible-cheZ cassette (BBa_K518007) and successfully demonstrated its capability of rescuing the motility of cheZ-defective cells with proper induction. We then constructed a cheZ expression device (BBa_K518008) which is repressed by the lambda cI repressor (BBa_C0051) in response to IPTG. Our data suggested that our device enables E. coli to respond to the induction ―this time IPTG― and lose motility. In conclusion, we were able to show that our inducible Cell Arrest System is feasible.
2.1. cheZ transformation rescues cheZ- strain's motility
- To show that our cheZ expression cassette (BBa_K518007) rescues the defective motility of cheZ- cells, we first transformed cheZ- cells with an IPTG-induced cheZ expression device (BBa_K518006) (we call these cheZres) , and analyzed their colony diffusion patterns. As a cheZ- cell, a cheZ-defective strain JW1970 was used. After inoculation of respective colonies, 0.25% agar LB plates were left at room temperature. These plates were imaged 3 times each with an interval of approximately 24 hours. The photographs of representative colonies are shown in Fig. 1A. Obtained images were thresholded to identify the edge of the colonies. Processed images corresponding to images in Fig. 1A are shown in Fig. 1B.
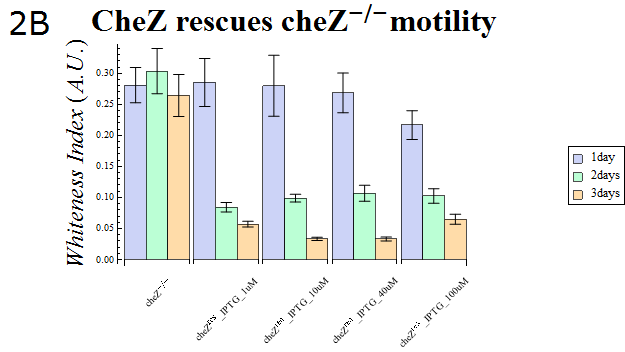
- To determine the motility of these cells, we then performed an image analysis. In this project, we defined two parameters for analyzing cellular motility; one was a colony size, which was defined as the total pixel count of the thresholded colony, and the other was the relative "whiteness" of each colony. We defined an arbitrary whiteness index (WI) as the mean of the pixel intensity of the thresholded colony normalized by its size. This WI value can be interpreted as a parameter of how thin, or diffusible, the colony is.
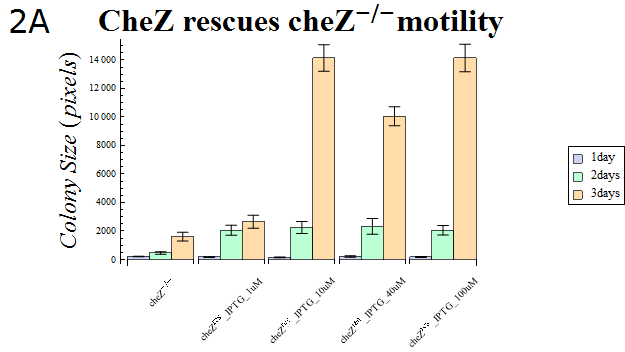
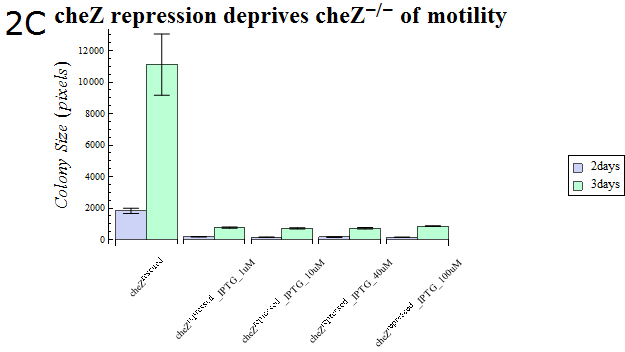
- The colony sizes are represented in Fig. 2A. This result indicates that cheZ-strains have significantly lower motility compared to cheZres cells after enough IPTG-induction, which suggests that our cheZ cassette (BBa_K518007) and IPTG-induced cheZ expression device (BBa_K518006) works as expected.
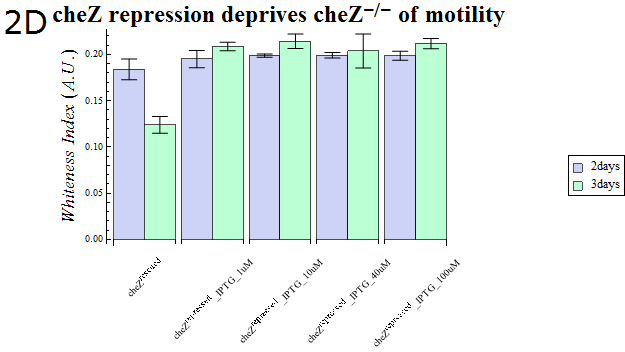
- The WI values of those colonies are also presented in Fig. 2B. This data also supports the hypothesis that cheZ- has a higher tendency to aggregate than the cheZ-rescued strain. For both charts, data obtained from triplicate experiments is presented as mean ± S.D..
2.2. Inducible repression of cheZ deprives rescued cheZ- of motility
- As our cheZ expression cassette (BBa_K518007) was proven to work properly, we next aimed at creating an inducible Cell Arrest System. To achieve this, we must devise an induction-based repression of cheZ. We utilized lambda cI repressor (BBa_C0051) and an inducible promoter (BBa_R0051). As with the previous section, gel swarming assays were conducted, with an induction of IPTG. This time, cheZ- cells transformed with R0051-K518007 only were used as a control, and the motility of cells possessing a construct allowing IPTG-induced cI repression of cheZ (BBa_K518008) in addition to R0051-K518007 were analyzed.
- Colony sizes and WI values are represented in Fig. 3C and D. Our data suggest that, by inducing the c1 repressor with IPTG, R0051-K518007 was strongly repressed and the motility of cheZ- strains decreased, control showed significant diffusion across the gel media. The data shows that induction by even IPTG at 1uM is adequate for repressing cheZ. As with section 1, data obtained from triplicate experiments is presented as mean ± S.D..
2.3 Conclusion
- We designed and characterized an inducible cheZ expression device and a cheZ repression device. We were able to show that both IPTG-induction of cheZ expression and its repression altered the motility of the cheZ- strain as expected. We found even 1uM IPTG may over-induce the downstream c1p, so future works include finding the proper condition of inductions. With enough induction, our Cell Assembling System can be achieved.
Reference
-
Shana Topp and Justin P. Gallivan, Supporting Material Guiding Bacteria with Small Molecules and RNA. Department of Chemistry and Center for Fundamental and Applied Molecular Evolution, Emory University, 1515 Dickey Drive, Atlanta, GA 30322, S2-S3.
Section 3: UV Switch
3. Summary
- We characterized ultraviolet (UV)-induced promoters to devise a "UV Switch". Our SMART System requires a promoter induction at the location of substrate, so is applicable only to those substrates for which responsive promoters are already known. To address this issue, we tried to provide a well-characterized easy-inducible promoter as a genetic switch. We chose UV as an example of induction, and characterized some UV-induced promoters recAp (BBa_J22106), recNp (BBa_K518011), and sulAp (BBa_K518010). To quantitatively and accurately evaluate the promoter activity, dual luciferase assay method was employed. Our results show that sulAp works as an acute switch. Combining the UV Switch with our SMART System, it becomes possible to "switch on" the self-assembling and localization at the location of our interest.
3.1. Dual Luciferase Assay System
- It is very important to be able to regulate gene expression as you like in biotechnology. To apply a regulator, such as a promoter, of the relevant strength to a gene, it is first essential to take an accurate measurement of the activity of regulators. However, it is difficult to measure the activity of regulators because the activity often changes depending on the conditions. In order to deal with this problem, Kelly et. al. (2009) proposed a BioBrick promoter assay system based on relative promoter strengths.[3] Their system measures the fluorescence intensity of GFP placed downstream of the promoter of interest, which is used to compute the absolute promoter strength. This value is normalized to the strength of a “standard” promoter which is simultaneously measured so that differences between experiments could be minimized.
- In this project, we suggest an alternative promoter assay system. In the dual luciferase assay(Hannah et al 1998), the luminescent intensity caused by firefly luciferase, used as a reporter of the promoter of choice, is compared to that caused by renilla luciferase, used as a reporter for a control promoter, both placed within the same plasmid.[4] Importantly, because the promoter to be measured and its comparison are placed within the same plasmid, differences in expression between cells are minimized. In addition, the need to normalize cell densities between sample and control is abolished, which can often be a difficult and inaccurate task. Also, the use of luciferase as a reporter allows a quick and accurate measurement and in addition is not fluorescence-based, nullifying the need to worry about fluorescence quenching.


- We assembled the Dual luciferase assay system from existing BioBrick parts, and used BBa_J23118 as the control promoter. We measure the relative intensity of this promoter to BBa_J23119, which has been already measured by the aforementioned assay, and so the intensities of promoters from the two systems can be compared to each other using BBa_J23119 as a standard.
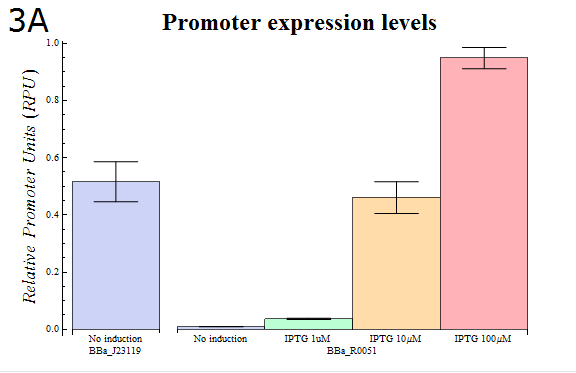
- In order to confirm that our system is workable, we assayed using our system how the activity of the lactose promoter (BBa_R0010) , an IPTG-inducible promoter, changes according to the strength of induction (Fig. 3A)
- As Fig. 3A shows, it was observed that the relative activity of lactose promoter increased with increasing IPTG concentrations. The result that concentration-dependent activity was observed with little variation between trials confirms that our “Dual luciferase assay” system can be used to measure quantitatively the intensities of promoters.
3.2. Evaluation of UV-induced Promoters
- As our dual luciferase assay kit (K518002) has been confirmed to work, we then assayed sulAp (BBa_K518010), which is known to belong to the family of SOS promoters, activity. (Fig. 3B)
Fig. 3B: The result of a Dual luciferase assay assayed for the sulA promoter. Strains possessing recA and those lacking the gene were transformed. The transformed E. coli were split into dishes after they were cultured until the OD600 is 0.4-0.6. They were then exposed to UV (15W / 254nm) for the shown durations while agitating gently. After UV irradiation finished, they were cultured for recovery for 30 min. at 37° C. Then, the cells were lysed and assayed using our system.
- Fig. 3B shows the sulAp strength after exposure to UV (15W / 254nm) for a minute. recA is required for expression from the sulAp and therefore a strain lacking the gene is used as a negative control. The relative activity of sulAp decreased after 10 minutes exposure of the same strength compared with that after 1 minutes exposure. This suggests that many E.coli died as a result of the 10 minute exposure. In support of this hypothesis, the OD of E. coli exposed to UV for 10 minutes was less than that of E.coli exposed for 1 minute (data not shown) after a 30 minute recovery culture.
- A detailed explanation of our system can be shown in Data section, and full method can be shown in Method section.
- We assayed promoters this time, but the “Dual luciferase assay” system makes it possible to measure not only transcriptional but also translational activity with appropriate control.
References
- [3]Jason R Kelly, Adam J Rubin et.al “Measuring the activity of BioBrick promoters using an in vivo reference standard” J Biol Eng. 2009; 3: 4.
- [4] Rita R. Hannah, Martha L et.al “Rapid Luciferase Reporter Assay Systems for High Throughput Studies” Promega Notes Number 65, 1998
 "
"


