Team:UQ-Australia/Data

From 2011.igem.org

(Difference between revisions)
Line 2: Line 2:
{|style="width:100%;" border="0" cellpadding="10" cellspacing="0"  
|rowspan="2"|A brief summary of some of our laboratory findings is included below. For more information, see the 'project' page.
|rowspan="2"|A brief summary of some of our laboratory findings is included below. For more information, see the 'project' page.
-
! width="125" |[[File:IGEM basic Logo stylized.png|125x125px|link=https://2011.igem.org]]
+
![[File:UQ-Australia_logo_2011.png|125x125px|link=https://2011.igem.org/Team:UQ-Australia]]
|-
|-
-
|[[File:UQ-Australia_logo_2011.png|125x125px|link=https://2011.igem.org/Team:UQ-Australia]]
+
|
|}
|}

Revision as of 12:31, 5 October 2011


A brief summary of some of our laboratory findings is included below. For more information, see the 'project' page. UQ-Australia logo 2011.png

We conducted a heat cycle PCR to determine the optimum conditions for amplifying our araC gene. The lanes here are loaded as follows:

1: 1kb+ ladder

2: Negative control (H2O)

3-7: pBAD33 plasmid at temperatures 50C, 55C, 58C, 60C and 65C.

8: Negative control (H2O)

9-13: pBAD33 plasmid at temperatures 50C, 55C, 58C, 60C and 65C.

The expected 900bp band for araC is seen at each temperature

AraC.jpg

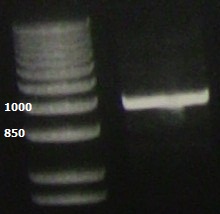
PCR of the lacI gene showing the expected ~1kb band.

Laci.jpg

PCR of glnG (lanes 2 and 3), glnAp2 (lanes 5 and 6), and the promoter Plac/ara (lanes 2-4 of the second gel). Only glnG is the expected size (1.6kb), while the other two significantly smaller parts (200-300bp) have not been amplified.

Glngplac.jpg