Team:WITS-CSIR SA/Characterization
From 2011.igem.org
| Line 308: | Line 308: | ||
</table> | </table> | ||
| - | < | + | <p><h2>References</h2> |
| - | <h2>References</h2> | + | |
<p>Lynch, S. A. & Gallivan, J. P. 2009. A flow cytometry-based screen for synthetic riboswitches. Nucleic Acids Res, 37, 184-92.</p> | <p>Lynch, S. A. & Gallivan, J. P. 2009. A flow cytometry-based screen for synthetic riboswitches. Nucleic Acids Res, 37, 184-92.</p> | ||
| - | <p>Topp, S. & Gallivan, J. P. 2007. Guiding bacteria with small molecules and RNA. J Am Chem Soc, 129, 6807-11.</p> | + | <p>Topp, S. & Gallivan, J. P. 2007. Guiding bacteria with small molecules and RNA. J Am Chem Soc, 129, 6807-11.</p></p> |
</div> | </div> | ||
Revision as of 14:21, 26 October 2011
Media:Example.ogg<!DOCTYPE html PUBLIC "-//W3C//DTD XHTML 1.0 Transitional//EN" "http://www.w3.org/TR/xhtml1/DTD/xhtml1-transitional.dtd">
Characterization of Parts
In order to characterize our final machines, we performed the following assays:
 |
 |
 |
 |
 |
| microscopy: Liquid Culture |
microscopy: Smeared Culture |
|
|
Theophylline Riboswitches
To characterise the theophylline riboswitches (1 and 2), we quantified their activation at different theophylline concentrations (0 mM, 0.5 mM, 1 mM, 1.5 mM and 2 mM) over a period of time using fluorometry. Competent E. coli (strain DH5a) cells were transformed with plasmid vectors containing the riboswitch and were cultured until the mid-log phase of growth. Thereafter, a different concentration of theophylline was added to each culture for induction. The activation of the riboswitch was detected as a fluorescent response as a result of increased translation of the fluorescent fusion protein CheZ-Venus, in the presence of the activator. A Jasco FP-6300 spectrofluorometer was used to excite the cultures at 514 nm and the intensity of the emission peak was detected at 528 nm. Twenty readings were taken every 15 minutes for each culture, for a total period of 135 minutes. An empty vector was used to correct for autofluorescence. Conversely, a construct that comprised of a Promoter-RBS-CheZ-Venus-double terminator (BBa_K537013) was used as a positive control. Fluorescent data for the 3D plots (Fig 1-4) were corrected for autofluorescence by subtracting the fluorescent values of the cultures transformed with the empty vector, from that of the riboswitches.
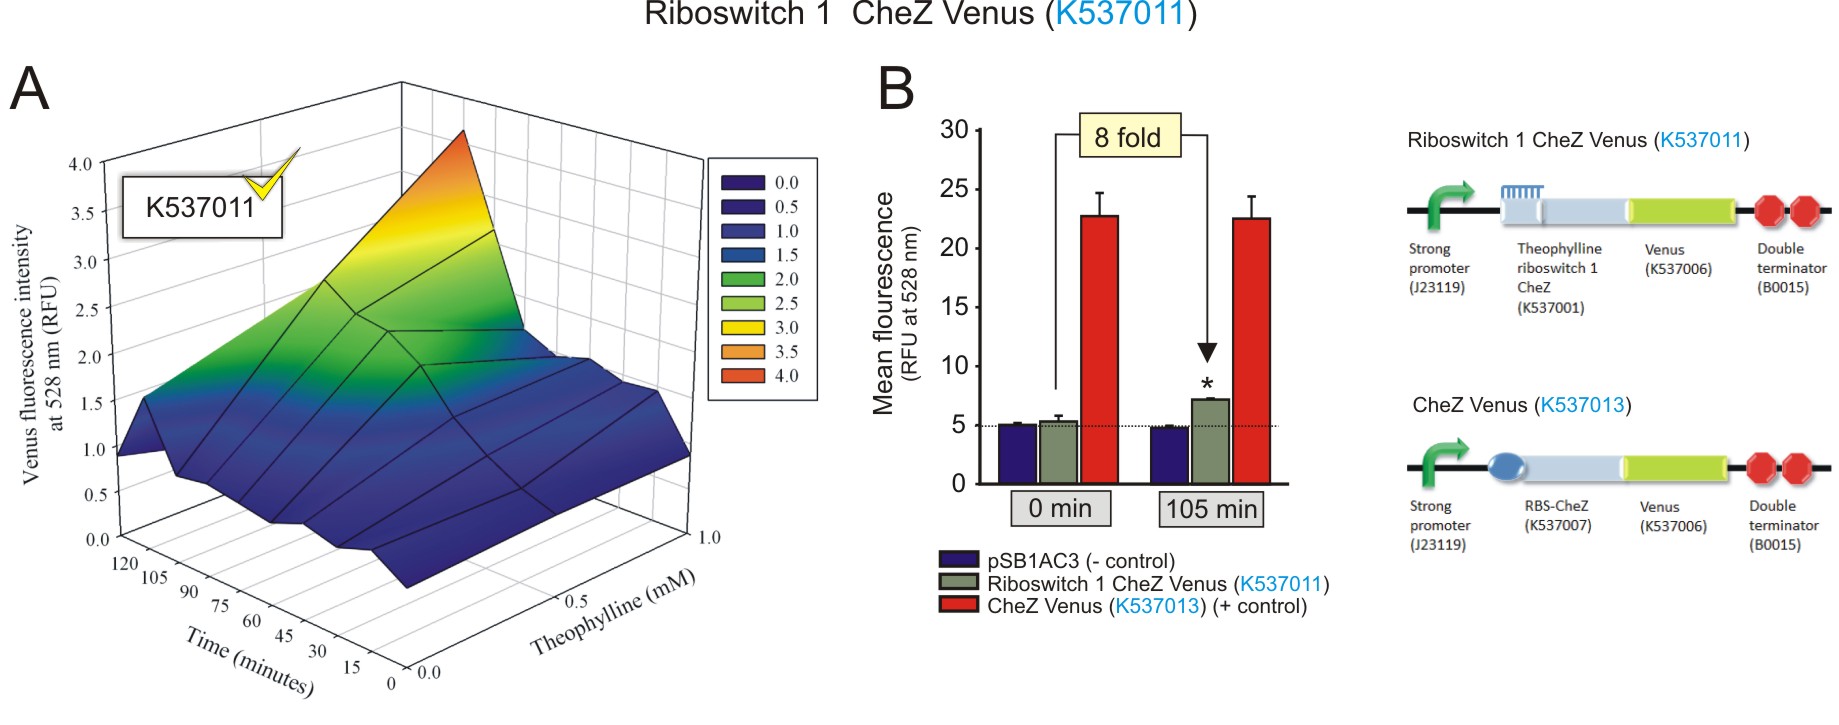
Figure 1: The fluorescence of the CheZ-Venus fusion protein under the regulation of theophylline riboswitch 1 (BBa_K537011). A) The activation of the riboswitch over time at different concentrations of theophylline. The fluorescence increased over time, with an increasing concentration of theophylline, indicating the theophylline concentration-dependent expression of the CheZ-Venus fluorescent fusion protein. The fluorescence peaks 105 minutes after the addition of 1 mM theophylline. B) The maximum fluorescence detected was compared to negative and positive controls at 1 mM theophylline after 105 minutes incubation, and to that of baseline levels (0 minutes with 1 mM theophylline). 1 mM of theophylline induced the expression of CheZ-Venus to increase 4-fold after 105 minutes (fold change was calculated by dividing the fluorescence observed at 105 minutes by the fluorescence at 0 minutes, after subtracting the corresponding autofluorescence values) (Click to enlarge) |

Figure 2: The fluorescence of the Venus reporter protein under the regulation of theophylline riboswitch 1 (BBa_K537009). A) The fluorescent peak occurred prematurely after 75 minutes of incubation with 0.5 mM theophylline, compared to riboswitch 1, which contained the gene for the CheZ-Venus fusion protein. The maximum fluorescent intensity observed was also lower by a factor of 2 RFU. B) The maximum fluorescence detected was compared to negative and positive controls at 0.5 mM theophylline after 75 minutes of incubation, and to that of baseline levels (0 minutes with 0.5 mM theophylline). A 4.5-fold increase in protein expression was observed as the maximum (fold change was calculated by dividing the fluorescence observed at 75 minutes by the fluorescence at 0 minutes, after subtracting the corresponding autofluorescence values). This fold change is comparable to that described in Figure 1. (Click to enlarge) |

Figure 3: The fluorescence of the CheZ-Venus fusion protein under the regulation of theophylline riboswitch 2 (BBa_K537012). A) The activation of the riboswitch over time at different concentrations of theophylline. The same trend of increased switch activation over time, with increasing theophylline concentrations was seen as with theophylline riboswitch 1. However, with the theophylline riboswitch 2, the fluorescence peaks 135 minutes after the addition of 1.5 mM theophylline. B) The maximum fluorescence detected was compared to negative and positive controls at 1.5 mM theophylline after 135 minutes incubation, and to that of baseline levels (0 minutes with 1.5 mM theophylline). 1.5 mM of theophylline induced a 37-fold increase in CheZ-Venus expression after 135 minutes (fold change was calculated by dividing the fluorescence observed at 135 minutes by the fluorescence at 0 minutes, after subtracting the corresponding autofluorescence values). (Click to enlarge) |

Figure 4: The fluorescence of the Venus reporter protein under the regulation of the theophylline riboswitch 2 (BBa_K537010). A) The activation of the riboswitch was affected by the lack of the CheZ gene in the switch construct. The increase in fluorescence was minimal upon induction and incubation over time. Furthermore, the fluorescent peak occurred prematurely after 60 minutes of incubation with 0.5 mM theophylline, when compared to the theophylline riboswitch 2 that contained the gene for the CheZ-Venus fusion protein. B) The maximum fluorescence detected was compared to negative and positive controls at 0.5 mM theophylline after 60 minutes of incubation, and to that of baseline levels (0 minutes with 0.5 mM theophylline). A 2-fold increase in protein expression was observed as the maximum (fold change was calculated by dividing the fluorescence observed at 60 minutes by the fluorescence at 0 minutes, after subtracting the corresponding autofluorescence values) . This is far less than the value described for the same switch in Figure 2.(Click to enlarge) |
Both the theophylline riboswitches displayed activation in response to increasing theophylline concentrations and incubation times. Theophylline riboswitch 2 controlling CheZ-Venus expression (BBa_K537012) clearly showed a superior level of activation compared to that theophylline riboswitch 1 (BBa_K537011). This was expected as it was selected by FACS for its optimised expression platform that allows for minimal leakiness at basal levels, and a strong activation in the presence of theophylline (Lynch and Gallivan, 2009). The activation shown by both the riboswitches regulating CheZ-Venus expression should be able to restore the motility of E. coli cells deficient in CheZ, in the presence of theophylline. More importantly, the theophylline concentration-dependent increase in CheZ-Venus expression alludes to the ability of directed cell movement, that is moving up concentration gradients of theophylline (Topp and Gallivan, 2007). Interestingly, the data suggests that the presence of the CheZ gene, as part of the CheZ-Venus fusion sequence, enhances the activation of the switches when compared to the constructs with venus alone. This may be due to some sort of structural stability conferred by the presence of the CheZ sequence.
Atrazine Riboswitch
Preliminary activation data was obtained for the atrazine riboswitch.Fluorometry was performed on E. coli (DH5a) cells transformed with a construct that contained a Promoter-atrazine riboswitch-mRFP-double terminator (BBa_K537014). Similar to the theophylline riboswitches, different concentrations (0 mM, 0.5 mM, 1 mM, 1.5 mM, 2 mM) of atrazine were added to the cultures for induction. The cultures were excited at 584 nm and detected at 607 nm using a Jasco FP-6300 spectrofluorometer. Readings were taken every 15 minutes for 120 minutes in total. The same empty vector was used as a negative control. The 3D plot data was normalised the same way as for the theophylline riboswitches.
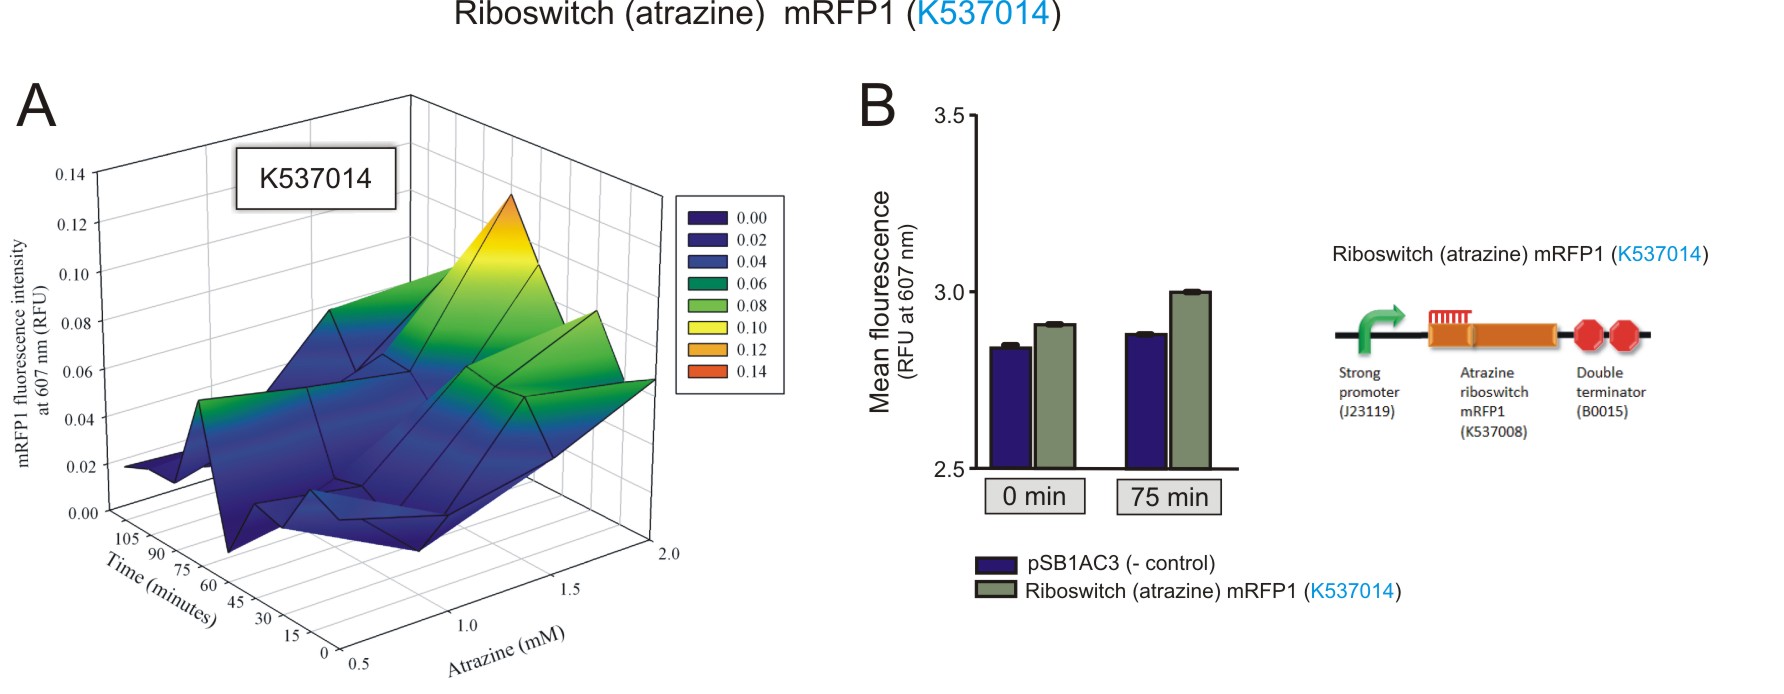
Figure 5: The fluorescence of the mRFP1 reporter protein under the regulation of the atrazine riboswitch(BBa_K537014). A) The activation of the atrazine riboswitch at different atrazine concentrations over time. There was an increase in fluorescence as the atrazine concentration and incubation time increased. The amount of fluorescence detected was very small, with a maximum of 0.1 RFU detected after 75 minutes of incubation with 2 mM atrazine. B) The maximum was compared to the negative control at 75 minutes, 2 mM atrazine, and to that of fluorescent levels detected at basal levels (0 minutes, 2 mM atrazine). A 1.7-fold increase in expression of mRFP1 was observed over the 75 minute period (values used for the calculation had the corresponding negative control value subtracted first).(Click to enlarge) |
References
Lynch, S. A. & Gallivan, J. P. 2009. A flow cytometry-based screen for synthetic riboswitches. Nucleic Acids Res, 37, 184-92.
Topp, S. & Gallivan, J. P. 2007. Guiding bacteria with small molecules and RNA. J Am Chem Soc, 129, 6807-11.
Epi-fluorescence Wide-Field Microscopy
Fluorescent imaging was performed for a qualitative assay of the engineered bacteria.
Bacterial culture and Manipulation:
4 ml of LB broth with Ampicillin was inoculated from colonies off a master plate of positive clones and grown overnight at 37°C in a shaking incubator. 2 ml of each bacterial culture was then used to inoculate 25 ml of LB broth with Ampicillin and grown for ± 3 hours in a shaking incubator at 37°C until the cells reached an OD600 of 0.55 (mid-log phase). 2 x 5 ml of each sample culture was aliquoted into separate 15 ml falcon tubes. One tube was left untreated; 150 µl of 15 mM theophylline was added to the other (to make a final concentration of 1.5mM theophylline). These 5 ml aliquots were placed in a shaking incubator at 37°C for 30 min each to allow for activation. 200 µl of each treated and untreated sample was then used in a microscope plate for imaging. Imaging was done using Zeiss Axioscope (Andor EMCCD Camera, Till Photonics Polychrome V).
Widefield fluorescence microscopy was used to assess the expression of the Venus protein. The bacterial samples were excited at 500 nm using the polychrome as an excitation source. The fluorescence was then observed by capturing light in the emission spectrum of Venus (528 nm). The figure below represents a schematic of the imaging setup. Corresponding bright-field images (using white light) were also captured for each experiment.
Below are the images that were obtained for the parental strain (BW25113) of the E. coli CheZ-deletion mutant, which served as the negative, and the CheZ deletion mutants transformed with Promoter-theophylline riboswitch 1-venus (thRS1-V) (BBa_K537009) and Promoter-theophylline riboswitch 2-venus (thRS2-V) (BBa_K537010).
Please note: Bacteria which were transformed with constructs which contained the CheZ gene were not tested in this assay. This experiment served as a means of observing the activation of the theophylline riboswitches, hence only expression of the venus reporter protein was needed for detection of fluorescence. Activation of motility was not assessed in this case – it was examined in the motility assays on semi-solid agar plates. Differences in fluorescence intensities were not calculated from the images below since the fluorometry experiments served as the quantitative approach to measurement of riboswitch activation.

Figure 6: The parental strain (BW25113) of the E. coli CheZ deletion mutants were not transformed with any plasmid DNA. The brightfield images in the left column depict all bacterial cells. The venus images in the right column depict bacterial cells which emitted fluorescence. In both the absence and presence of theophylline, the parental bacteria did not fluoresce – which was the expected result. (Click to enlarge) |
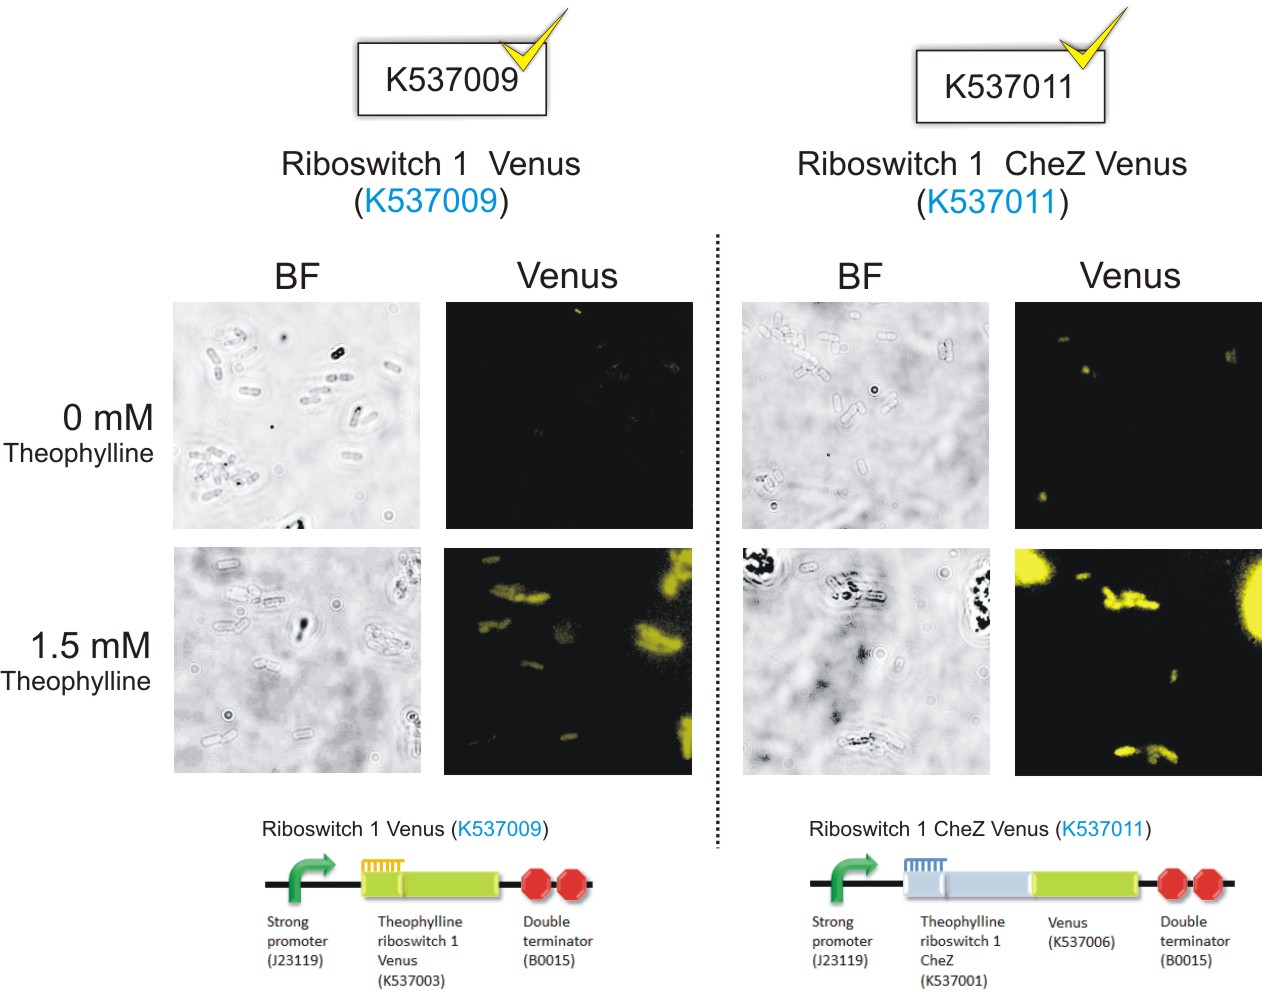
Figure 7: E. coli CheZ-deletion mutants which were transformed with the Promoter-theophylline riboswitch 1-venus (thRS1-V) (BBa_K537009) construct. The brightfield images in the left column depict all bacterial cells. The venus images in the right column depict bacterial cells which emitted fluorescence. In the absence of theophylline, almost no fluorescence occurred. Upon the addition of theophylline at a concentration of 1.5 mM, many of the cells emitted fluorescence showing activation of the theophylline riboswitch type 1.(Click to enlarge) |
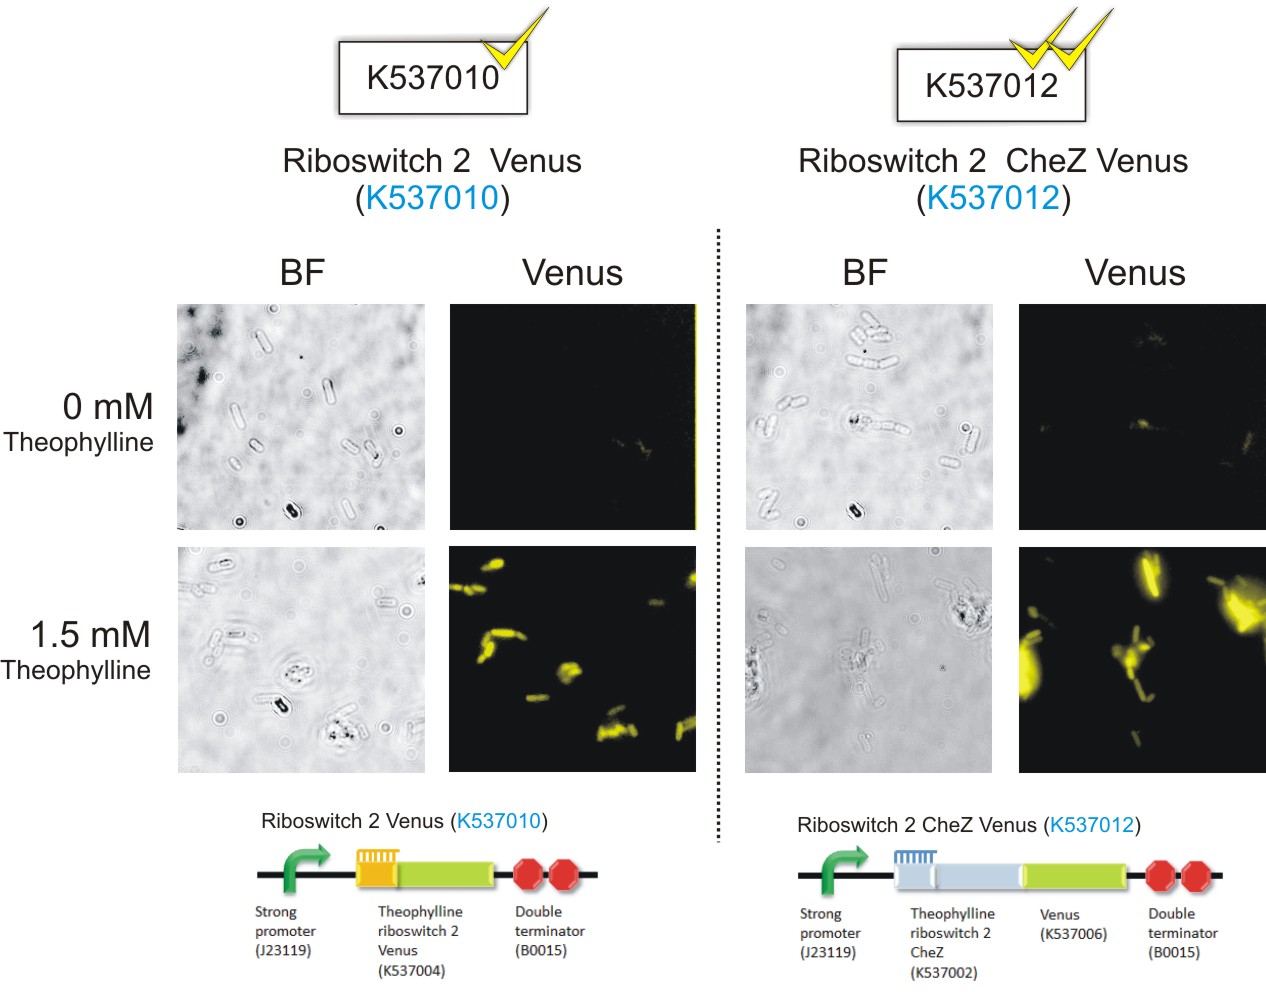
Figure 8: E.coli CheZ-deletion mutants which were transformed with the Promoter-theophylline riboswitch 2-venus (thRS2-V) (BBa_K537010) construct. The brightfield images in the left column depict all bacterial cells. The venus images in the right column depict bacterial cells which emitted fluorescence. In the absence of theophylline, some fluorescence was observed. This result showed the leakiness of the riboswitch. A substantial amount of venus translation is permitted because of the flexible conformation of this riboswitch. Upon the addition of theophylline at a concentration of 1.5 mM, much more fluorescence was detected. More venus was expressed in these cells due to the activation of the riboswitch via theophylline.(Click to enlarge) |
Fluorescent imaging was performed again after the European Jamboree, using a different technique. The aim of this data is to depict the exact same brightfield and fluorescent static fields of view.

Semi-solid agar plates containing different concentrations of theophylline (0mM, 0.5mM, 1.0mM and 1.5mM) were made. Promoter-theophylline riboswitch 1-CheZ-Venus-double terminator (thRS1-Ch-V)(BBa_K537011), Promoter-theophylline riboswitch 2-CheZ-Venus-double terminator (thRS2-Ch-V) (BBa_K537012), Promoter-theophylline riboswitch 1-Venus-double terminator (thRS1-V) (BBa_K537009) and Promoter-theophylline riboswitch 2-Venus-double terminator (thRS2-V) (BBa_K537013) were transformed into CheZ deletion mutants and grown to mid-log phase (OD600 = 0.55). 1.5 µl of culture was plated into the centre of the plates containing the various concentrations of theophylline and incubated at 37°C for 24 hours. This experiment was performed in triplicate. The protocol for this experiment can be found here.

Figure 9: The distance travelled by CheZ deletion mutants (mm) over a 24 hour period at 37°C on semi-solid agar plates containing different theophylline concentrations (mM)(Click to enlarge) |
The thRS1-V and thRS2-V transformants did not travel from the point of inoculation for all concentrations of theophylline. The CheZ deletion mutants containing thRS1-Ch-V travelled 0 mm at 0 mM theophylline and reached a maximum travelling distance of 5 mm at 1.5 mM theophylline. The thRS2-Ch-V containing CheZ deletion mutants travelled 2 mm in the absence of theophylline and at a concentration of 1.5 mM theophylline, were able to travel 22mm from the point of inoculation
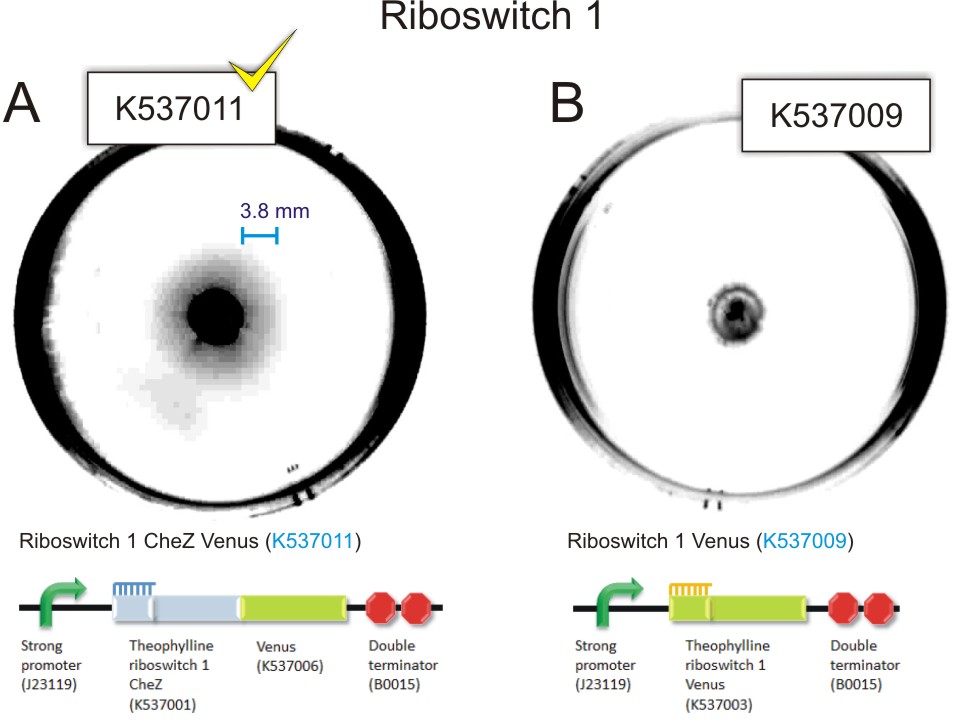

Figure 10: 85 mm semi-solid agar plates containing 1.0 mM theophylline showing the point of inoculation and distance travelled by the bacteria. A) Inoculation of 1.5 µl of mid-log phase E. coli CheZ deletion mutants transformed with thRS1-Ch-V(BBa_K537011). There is evidence of movement of bacteria from the point of inoculation. This can be observed as a faint halo surrounding the point of inoculation.B) Inoculation of 1.5 µl of mid-log phase E. coli CheZ deletion mutants transformed with thRS1-V. Converse to A, there is no evidence of movement of the bacteria from the point of inoculation C) Inoculation of 1.5µl of mid-log phase E. coli CheZ deletion mutants transformed with thRS2-Ch-V (BBa_K537012). There is evidence of movement of the bacteria from the point of inoculation. This can be observed as a faint halo surrounding the point of inoculation. D) Inoculation of 1.5µl of mid-log phase E. coli CheZ deletion mutants transformed with thRS2-V. Converse to C, there is no evidence of movement of bacteria from the point of inoculation (Click to enlarge) |
Discussion and conclusion
The construct thRS1-Ch-V transformed into the CheZ deletion mutants are non-motile at a concentration of 0 mM theophylline, since in the absence of the activator, the riboswitch is sequestering the RBS and thus inhibiting the translation of CheZ (Topps and Gallivan, 2007). On the semi-solid agar plates containing theophylline, the motility of E.coli is evident, as the interaction of theophylline with the riboswitch enables the exposure of the RBS and the translation of the downstream CheZ, allowing for bacterial motility. The distance travelled by the bacteria transformed with the thRS1-Ch-V construct, from the start position (mm) in the presence of different concentrations of theophylline, is not significantly different (P=0.005). This indicates that the CheZ expression at 0.5 mM-1.5 mM is sufficient to allow the bacteria to move a distance of 5 mm. The construct thRS2-Ch-V transformed into the CheZ deletion mutants are slightly motile in the absence of theophylline, travelling 2mm over a 24 hour period indicating that this riboswitch is slightly leaky. Upon addition of 0.5 mM-1.5 mM theophylline, the bacteria were able to travel 20mm over a 24 hour period.
The distance travelled from the start position by the CheZ deletion mutants containing the thRS2-Ch-V is significantly higher than that those with the thRS1-Ch-V construct. This can be explained by the high fold-increase in CheZ protein expression by this riboswitch, as shown by fluorometry. Theophylline riboswitch 1 has a lower fold increase in CheZ expression from 0 mM to 1.5 mM theophylline, compared to the increase shown by the theophylline riboswitch 2. Therefore, in order to achieve maximum motility under the control of theophylline, at concentrations of between 0.5 mM and 1.5 mM, theophylline riboswitch 2 should be used.
References Topp, S. & Gallivan, J. P. 2007.Guiding bacteria with small molecules and RNA. J Am ChemSoc, 129, 6807-11
Both the t1-V and t2-V constructs transformed into the CheZ deletion mutants are non-motile, each having travelled a distance of 0mm at all concentrations of theophylline (See A and B). This indicates that in the absence of the CheZ protein, the bacteria are non-motile (Topps and Gallivan, 2007).
In order to determine whether we had successfully engineered the E. coli CheZ deletion mutants to chemotactically migrate towards theophylline, we performed a capillary assay. Bacteria transformed with thRS1-V (BBa_K537009), thRS2-V (BBa_K537010), RBS-Ch-V (BBa_K537013), thRS1-Ch-V (BBa_K537011) and thRS2-Ch-V (BBa_K537012) were grown to mid-log phase. Activation of chemotaxis was achieved by incubating the cultures with 1 mM theophylline prior to the assay. A 50 µl drop of each culture was then placed onto separate sterile surfaces and two capillary tubes were placed into each drop. The first capillary tube was a control, containing only PBS and 20 µM EDTA. The second tube contained PBS, 20 µM and 2mM theophylline. The two capillary tubes were suspended into each drop of culture for 30 minutes. A dilution series of the solutions in the tubes were plated and colonies counted after 12 hours. Further details of this protocol can be found here.

Figure 11: add text here (Click to enlarge) |
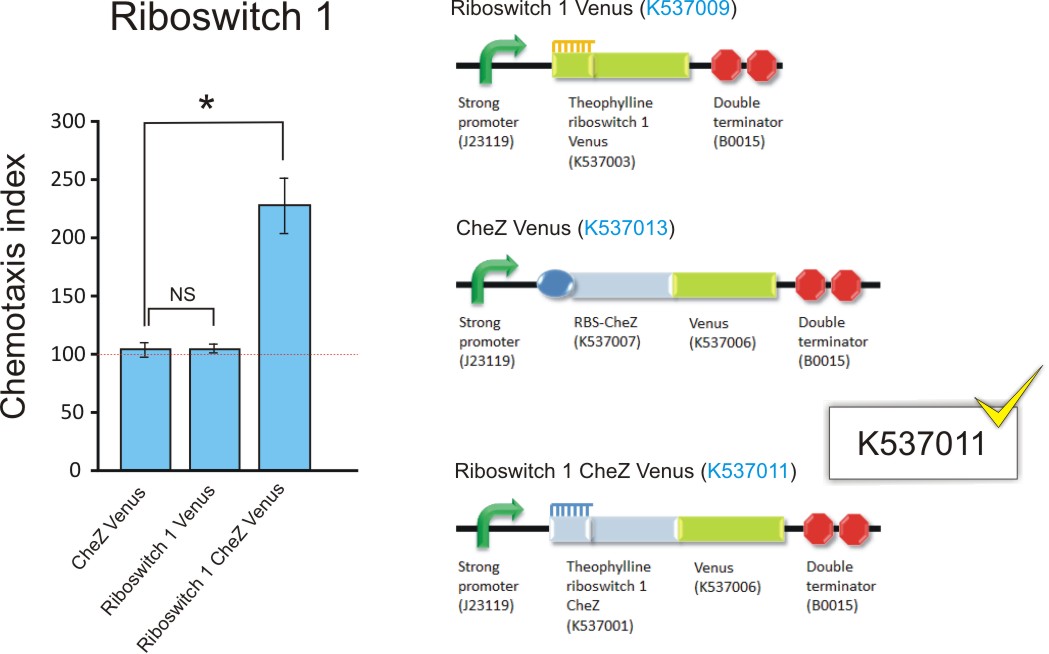

Figure 12: add text here (Click to enlarge) |
Discussion and conclusion
Cells transformed with thRS1-V, thRS2-V and RBS-Ch-V all displayed an index of approximately 100, indicating the same number of bacteria moved towards the control (0mM theophylline) and the experiment (2mM theophylline) capillary tube. This proves that none of these constructs induce chemotactic behaviour. In terms of both thRS1-V and thRS2-V, the lack of CheZ results in the inability of CheY dephosphorylation and the swimming motion observed in chemotaxis, which is a key driver in directed movement towards an attractant (Topps and Gallivan, 2007). Although the RBS-Ch-V construct constitutively expresses CheZ, and bacterial swimming is achieved through CheY dephosphorylation, the expression levels remain constant regardless of the presence or absence of theophylline. Random movement will occur as a result.
The thRS1-Ch-V and thRS2-Ch-V transformants, with chemotaxis indices of 180 and 227 respectively, both indicated a significantly higher number of bacteria that travelled to the 2mM theophylline solution in the capillary tube compared to that of the control. The chemotaxis index of the thRS2-Ch-V construct is significantly higher (p=0.005) than that of thRS1-Ch-V, indicating that cells transformed with thRS2-Ch-V is more attracted to theophylline than thRS1-Ch-V. Should maximum chemotaxis towards theophylline be desired, thRS2-Ch-V would be the more suitable construct.
 "
"

