Team:Harvard/Results/Chip Synthesis
From 2011.igem.org
(→Error rates) |
(→Error rates) |
||
| Line 20: | Line 20: | ||
==Error rates== | ==Error rates== | ||
| - | * | + | *Perfect sequence matches a designed ZF: 57.1% (44/77) |
| - | *Single SNP: | + | *Single SNP: 2.6% (2/77) |
| - | * | + | *Two or more SNPs: 18.2% (14/77) |
*Frame shift: 22.1% (17/77) | *Frame shift: 22.1% (17/77) | ||
| + | |||
| + | We determined the overall per base pair error rate for this set sequenced to be around 1/200, which includes errors generated by the chip, or generated during PCR and assembly. These are a bit higher than those found by Kosuri, et al., but within a reasonable margin. | ||
==Distributions== | ==Distributions== | ||
Of the 77 samples with good sequencing results, 2 sequences were repeated once. Discounting these, 73 of the 77 sequences, or 94.8%, were unique, showing substantial variability within the library. | Of the 77 samples with good sequencing results, 2 sequences were repeated once. Discounting these, 73 of the 77 sequences, or 94.8%, were unique, showing substantial variability within the library. | ||
</div> | </div> | ||
Revision as of 03:56, 29 September 2011
qPCR curves
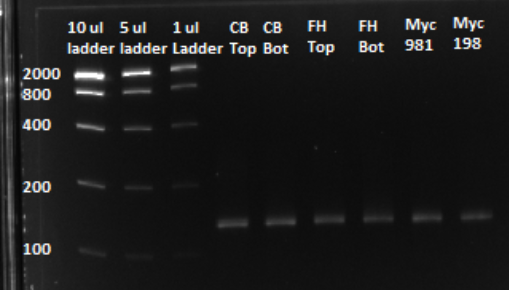
Each line on the graph below represents a qPCR for one of our sub-pools (each sequence we are targeting represents a sub-pool: CB top, CB bottom, FH top, FH bottom, Myc 198, Myc 981). By plotting the relative flouresence present in each cycle, we can visualize the pogress of the reaction. When performing a qPCR, one wants to run the reaction while the growth is still exponential. During this phase, all the oligos are replicated at equal rates. Once growth begins leveling off, as it does at the end of the graph below, the reaction should be stopped as the oligos are now being replicated unequally.
Based on the graph and gel below, we knew we successfully amplified each of our target sub-pools.
Sequencing results of Library transformation
Error rates
- Perfect sequence matches a designed ZF: 57.1% (44/77)
- Single SNP: 2.6% (2/77)
- Two or more SNPs: 18.2% (14/77)
- Frame shift: 22.1% (17/77)
We determined the overall per base pair error rate for this set sequenced to be around 1/200, which includes errors generated by the chip, or generated during PCR and assembly. These are a bit higher than those found by Kosuri, et al., but within a reasonable margin.
Distributions
Of the 77 samples with good sequencing results, 2 sequences were repeated once. Discounting these, 73 of the 77 sequences, or 94.8%, were unique, showing substantial variability within the library.
 "
"


