Team:Groningen/project characterisation mu
From 2011.igem.org
(Difference between revisions)
| Line 7: | Line 7: | ||
{| class="wikitable" | {| class="wikitable" | ||
| - | ! colspan="2" | cI autoinducing loop (BBa_K00) after 4 hours of incubation | + | ! colspan="2" | cI autoinducing loop 1 (BBa_K00) after 4 hours of incubation |
|- | |- | ||
| [[File:ci1ui.png]] | | [[File:ci1ui.png]] | ||
| Line 29: | Line 29: | ||
| colspan=2 | Two populations are visible blabla | | colspan=2 | Two populations are visible blabla | ||
|} | |} | ||
| + | |||
{| class="wikitable" | {| class="wikitable" | ||
| - | ! colspan="2" | cI autoinducing loop (BBa_K00) after 4 hours of incubation | + | ! colspan="2" | cI autoinducing loop 6 (BBa_K00) after 4 hours of incubation |
|- | |- | ||
| - | | [[File: | + | | [[File:ci6ui.png]] |
| | | | ||
{| class="wikitable" | {| class="wikitable" | ||
| Line 50: | Line 51: | ||
|} | |} | ||
|- | |- | ||
| - | | colspan=2 | | + | | colspan=2 | Only one population is visible blabla |
|} | |} | ||
{{FooterGroningen2011}} | {{FooterGroningen2011}} | ||
Revision as of 22:48, 20 September 2011
Memory Units
cI Autoinducing Loops
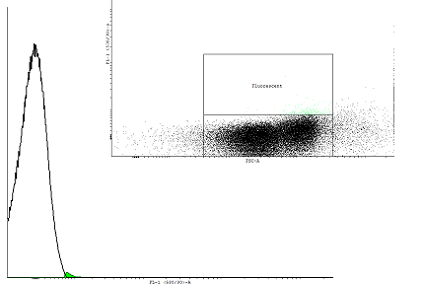
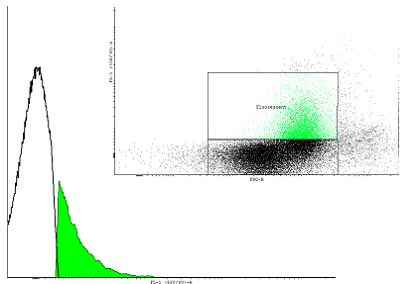
The autoinducing loop driven by cI will function as our first memory unit. We aimed to find a combination of RBS, transcription factor and degradation tag that enables us to toggle between the two steady states in a robust way. To estimate the rate in which single cells are activated by too much leakage of cI protein we measured the fluorescence in uninduced cells with a flow cytometer. To measure the activation we used a construct with the PRM promoter producing GFP.
| cI autoinducing loop 6 (BBa_K00) after 4 hours of incubation | |||||||||||||||||
|---|---|---|---|---|---|---|---|---|---|---|---|---|---|---|---|---|---|

|
| ||||||||||||||||
| Only one population is visible blabla | |||||||||||||||||
 "
"


