Team:EPF-Lausanne/Our Project/Data
From 2011.igem.org
(→pSB3K1 Pconst-TetR) |
(→pSB3K1 Pconst-TetR) |
||
| Line 70: | Line 70: | ||
On the left you can see the curve for each ATC concentration whereas on the right there is a comparison for the negative control and 800 ng/ul ATC. | On the left you can see the curve for each ATC concentration whereas on the right there is a comparison for the negative control and 800 ng/ul ATC. | ||
| + | |||
[[File:EPFL_TimevsRFP_comp.jpg]] | [[File:EPFL_TimevsRFP_comp.jpg]] | ||
Revision as of 12:35, 6 September 2011
Data
Contents |
TetR Mutants
- V36F
- P39K
- Y42F
- P39Q-Y42M
T7 Promoter Plasmids
- pSB3K1-T7-const-RFP
Description: The T7 promoter upstream of the RFP gene, set in the pSB3K1 backbone
Sequence:
Plasmid Map:
Saturation Curves:
Dose-Response Curves:
- pSB3K1-T7-lac-RFP
- pSB3K1-T7-lac2-RFP
- pSB3K1-T7-const-Lysis
- pSB3K1-T7-lac-Lysis
T7 Promoter Variants
Reporter Plasmids
J61002 Ptet-RFP
TetR plasmids
pSB3K1 Pconst-TetR
Description
Parts assembled:
- Plasmid backbone: pSB3K1 from ETHZ 2007 [http://partsregistry.org/wiki/index.php?title=Part:pSB3K1 "pSB3K1"] (taken from the delivery plate)
- Pconst: J23116 from Berkeley 2006 [http://partsregistry.org/Part:BBa_J23116 "j23116"] (sequence copied into our primers)
- RBS (B0034?) and spacer: (sequence copied into our primers)
- TetR: "TetR sequence" (623 bp) The sequence lacks a stop codon, we added TAA with our primers
Sequence
Sequenced data compared to the sequence of Pconst,RBS+spacer and TetR gene:"pSb3K1_TetR_seq" All these parts are correct.
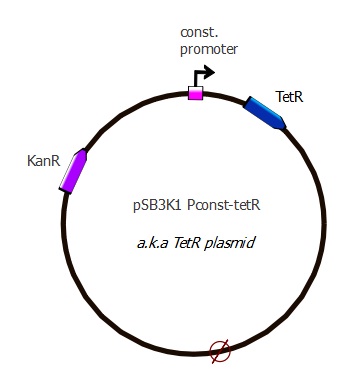
Plasmid map
This plasmid contains a p15A replication origin as well as a Kanamycin resistance marker.

ATC induction
The platereader experiment was run for 12h, using 0-0.1-5-25-200-300-800-1000-1200-1500 nM/ul final concentrations of ATC. The cells were cotransformed with pSB3K1 Pconst-TetR and J61002 Ptet-RFP, to use the fluorescent protein as a readout. All the concentrations were tested on 4 different cultures and the results were averaged.
On the left you can see the curve for each ATC concentration whereas on the right there is a comparison for the negative control and 800 ng/ul ATC.
Dose-response These data are coming from the same experiment; they show the saturation value of RFP expression for each ATC concentration. Here again, the values were averaged over the 4 different cell cultures.
pSB3K1 Pconst-TetR Ptet-LacI
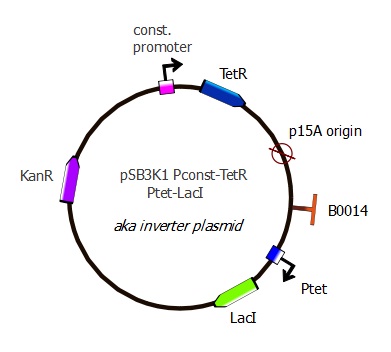
Parts assembled
- Plasmid backbone containing Pconst and TetR: see precedent section
- Terminator: B0014 from the Registry [http://partsregistry.org/Part:BBa_B0014 "B0014"] (sequence copied into our primers)
- Ptet: R0040 from Registry [http://partsregistry.org/Part:BBa_R0040 "R0040"] (sequence copied into our primers)
- LacI: amplified from Repressilator plasmid "LacI sequence" The sequence lacks a stop codon, we added TAA with our primers.
Sequencing results:
 "
"

