Team:Imperial College London/Project/Chemotaxis/Results
From 2011.igem.org
| Line 115: | Line 115: | ||
-gibson assembly of 22&23 fragments. | -gibson assembly of 22&23 fragments. | ||
-Due to this we have transformed 5a strain with a high copy plasmid containing ampicillin and kanamycin resistance (AK3 backbone)and sfGFP. These cells have been numbered 17.</p> | -Due to this we have transformed 5a strain with a high copy plasmid containing ampicillin and kanamycin resistance (AK3 backbone)and sfGFP. These cells have been numbered 17.</p> | ||
| - | < | + | <h1>Testing</h1> |
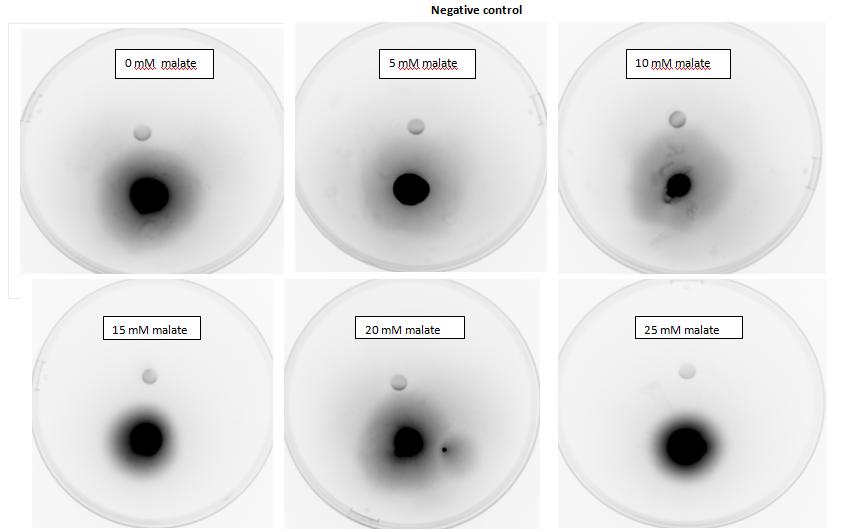
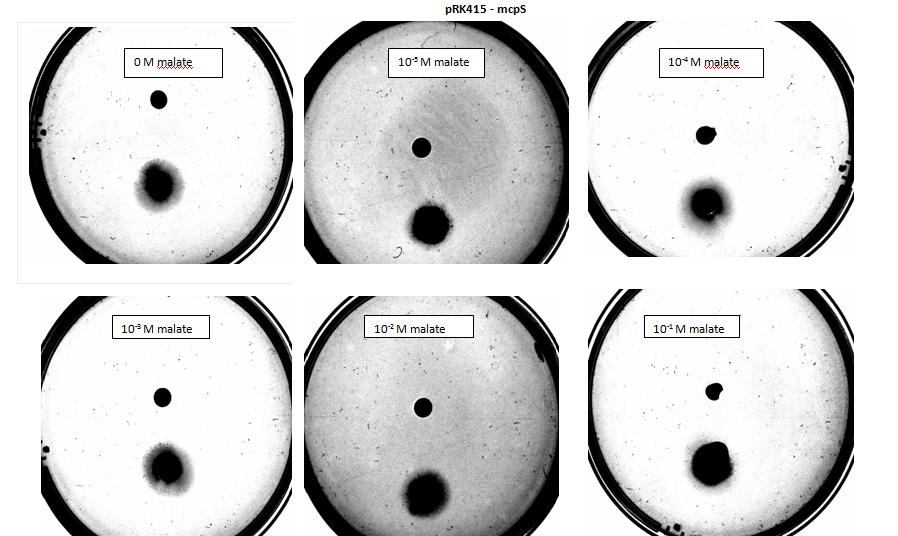
<p>Testing for chemotaxis can be split into qualitative and quantitative assays. Qualitative assays involve putting engineered <i>E. coli</i> and an attractant onto semi-solid agar plates and observe the movement of the microbes. If they can be observed to move towards the attractant source, they are likely to be attracted to the ligand. In quantitative assays, capillaries are filled with different concentrations of the attractant malate. Positive controls are provided by filling identical capillaries with different concentrations of serine, which <i>E. coli</i> naturally move towards. Negative controls are provided by filling capillaries with media that does not contain a source of attractant. The amount of bacteria that swim into each capillary is evaluated by FACS.</p> | <p>Testing for chemotaxis can be split into qualitative and quantitative assays. Qualitative assays involve putting engineered <i>E. coli</i> and an attractant onto semi-solid agar plates and observe the movement of the microbes. If they can be observed to move towards the attractant source, they are likely to be attracted to the ligand. In quantitative assays, capillaries are filled with different concentrations of the attractant malate. Positive controls are provided by filling identical capillaries with different concentrations of serine, which <i>E. coli</i> naturally move towards. Negative controls are provided by filling capillaries with media that does not contain a source of attractant. The amount of bacteria that swim into each capillary is evaluated by FACS.</p> | ||
<p> For simplicity, we will be working with Arabidopsis to observe the uptake of bacteria into plant roots. | <p> For simplicity, we will be working with Arabidopsis to observe the uptake of bacteria into plant roots. | ||
| - | Arabidopsis thaliana is a common plant model organism. It belongs to the mustard family and fulfils many important requirements for model organisms. As such, its genome has been almost completely sequenced and replicates quickly, producing a large number of seeds. It is easily transformed and many different mutant strains have been constructed to study different aspects (National Institute of Health, no date). While Arabidopsis may not represent plant populations naturally occurring in arid areas threatened by desertification, it is a handy model organism we will be using to study the effect of auxin on roots, observe chemotaxis towards them and look at uptake of bacteria into the roots. | + | Arabidopsis thaliana is a common plant model organism. It belongs to the mustard family and fulfils many important requirements for model organisms. As such, its genome has been almost completely sequenced and replicates quickly, producing a large number of seeds. It is easily transformed and many different mutant strains have been constructed to study different aspects (National Institute of Health, no date). While Arabidopsis may not represent plant populations naturally occurring in arid areas threatened by desertification, it is a handy model organism we will be using to study the effect of auxin on roots, observe chemotaxis towards them and look at uptake of bacteria into the roots.</p> |
| - | We will be using Arabidopsis to look at the uptake of our engineered bacteria into the plants. For this, we will be using wild type Arabidopsis and E. coli that constitutively express green fluorescent protein. The natural fluorescence produced by plant roots and green fluorescence produced by the bacteria can be used to image the uptake of bacteria using confocal microscopy. | + | <p>We will be using Arabidopsis to look at the uptake of our engineered bacteria into the plants. For this, we will be using wild type Arabidopsis and E. coli that constitutively express green fluorescent protein. The natural fluorescence produced by plant roots and green fluorescence produced by the bacteria can be used to image the uptake of bacteria using confocal microscopy.</p> |
| - | + | <h2>1. Testing for chemotaxis towards malate</h2> | |
| - | + | ||
| - | + | ||
| - | <h2> | + | |
<p>Experiments involving chemotaxis can be split to two categories, qualitative and quantitative. In the qualitative experiments, we are able to show that bacteria, which we study do or do not move towards a source, however it does not inform us at all about the cell count.</p> | <p>Experiments involving chemotaxis can be split to two categories, qualitative and quantitative. In the qualitative experiments, we are able to show that bacteria, which we study do or do not move towards a source, however it does not inform us at all about the cell count.</p> | ||
<h2>5th of August - Agar plug in assay</h2> | <h2>5th of August - Agar plug in assay</h2> | ||
Revision as of 13:06, 4 September 2011
Chemotaxis Results
Modelling
Two main aspects were modelled for our chemotaxis module: malate distribution in soil and the threshold concentration of malate needed to trigger chemotaxis.
The malate concentration distribution was modelled using the Keller-Segel model.
E.coli is a motile strain of bacteria, which is to say it can swim. It is able to do so by rotating its flagellum, which is a rotating tentacle like structure on the outside of cell. Chemotaxis is the movement up concentration gradient of chemoattractants (i.e. malate in our project) and away from poisons. E.coli is too small to detect any concentration gradient between the two ends of itself, and so they must randomly head in any direction and then compare the new chemoattractant concentration at new point to the previous 3-4s point. Its motion is described by ‘runs’ and ‘tumbles’, runs refer to a smooth, straight line movement for a number of seconds, while tumble referring to reorientation of bacteria [1]. Chemoattractant increases transiently raise the probability of ‘tumble’ (or bias), and then a sensory adaptation process returns the bias to baseline, enabling the cell to detect and respond to further concentration changes. The response to a small step change in chemoattractant concentration in a spatially uniform environment increase the response time occurs over a 2- to 4- s time span [2]. Saturating changes in chemoattractant can increase the response time to several minutes.
Malate concentration distribution
For our project, malate is the chemoattractant that results in the movement of E.coli. In this section, we will first model the concentration distribution of the chemoattractant, malate in the soil. Then, we will model the bacteria concentration pattern as a result of this distribution of malate. Finally, we will infer some useful information by analysing the results of the modelling.
We will model the concentration distributions of malate and bacteria using the Keller-Segel model which is governed by the two equations shown below. Solving the equations will give the concentration distributions of the malate and the bacteria respectively
 ---------------------------------------------------------------------------------------------(1)
 -------------------------------------------------------(2)
s = concentration of chemoattractant
D = diffusion coefficient of chemoattractant
f = degradation of chemoattractant
b = number concentration of bacteria
µ = bacterial diffusion coefficient (how fast bacteria spread)
χ = chemotactic coefficient (how sensitive bacteria are)
g = bacterial cell growth
h = bacterial cell death
The values of the above parameters for E. coli are shown in the following table. These values will be used for the modelling.
Parameter description |
Notation |
Value |
Initial bacterial concentration |
b0 |
108 cells/ml |
Initial attractant concentration |
s0 |
0.1 mM or 0.1 mol/m3 |
Bacterial diffusion coefficient |
µ |
1.5*10-5 cm2/s |
Bacterial chemotactic coefficient |
χ |
1.5-75*10-5 cm2/s |
Attractant diffusion coefficient |
D |
10-5 cm2/s |
Reference: Overview of Mathematical Approaches Used to Model Bacterial Chemotaxis II: Bacterial Populations
The assumptions that we have made are as follow:
- The entire root system is assumed to take the shape of a long cylinder. Hence, a cylindrical coordinate system will be used.
- The system is axisymmetric and there is no variation along the vertical length of the root. Hence,

- The system has reached steady state and is time-independent. Hence,

- Degradation of chemoattractant is first order and is described by f = ks where k is the degradation rate of the chemoattractant.
- Bacterial cell growth and death are neglected. Hence, g(b,s) = h(b,s) = 0
Applying the assumptions above, equation (1) becomes
![]()
Rearranging,
![]() -------------------------------------------------(3)
-------------------------------------------------(3)
Equation (3) is in the form of the modified Bessel equation. Hence, the solution of equation (3) is given by,
![]()
Where K0 is the modified Bessel function.
Since it is unrealistic for the concentration to increase to infinity, A=0. And applying the boundary condition, the solution becomes,
![]() -----------------------------------------------------(4)
-----------------------------------------------------(4)
The modeling result show that the steady-state pattern of malate distribution. The concentration of malate is a variable against the distance


Chemotaxis
1. Signal pathway of a single bacterium
- the signal transfer inside the bacterium
chemoattractant stimulation -> chemoreceptor -> CheA -> CheY-P -> flagellar motor -> changed switching frequency between swimming and tumbling (biasing fraction) - the phosphrylation level of CheY can indicate the signal transferring pathway, the CheY-P concentration increases when the chemoreceptor is triggered
- the modeling result will show the optimal concentration to trigger the chemoreceptors (10-6 mol/L)
high = saturated chemoreceptors
low = cannot be detected


2. Bacterial population dynamics
An animation is made to show the movement of the population:
mainly by diffusion, biased motion with the presence of chemoattractant
based on the malate distribution in steady-state and the Spiro model
 "
"


