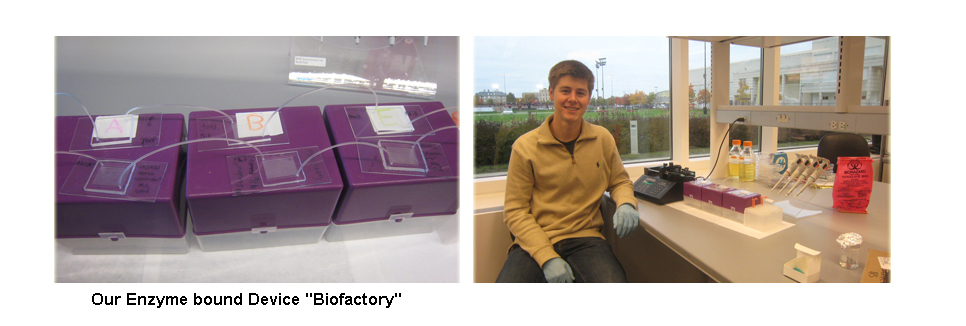
Team:Cornell/Results
From 2011.igem.org
| (81 intermediate revisions not shown) | |||
| Line 2: | Line 2: | ||
{{:Team:Cornell/Templates/hideHeader}} | {{:Team:Cornell/Templates/hideHeader}} | ||
{{:Team:Cornell/Templates/MediaMenu}} | {{:Team:Cornell/Templates/MediaMenu}} | ||
| - | [[file:Results_Cornell2011.jpg| | + | [[file:Results_Cornell2011.jpg|800px|right]] |
__TOC__ | __TOC__ | ||
| + | |||
<font face="Comic Sans MS"> | <font face="Comic Sans MS"> | ||
=Results Summary= | =Results Summary= | ||
| - | |||
:Two of the main components of our project are as follows: | :Two of the main components of our project are as follows: | ||
::* AviTagged enzymes that modify a substrate according to a biosynthetic pathway | ::* AviTagged enzymes that modify a substrate according to a biosynthetic pathway | ||
::* Avidin coated microfluidic channels which bind AviTagged proteins | ::* Avidin coated microfluidic channels which bind AviTagged proteins | ||
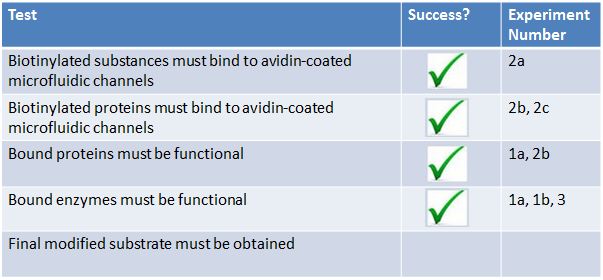
| - | :We decided to test these components separately before we conducted a final biomodification test. Below are the tests we conducted: | + | :We decided to test these 2 components separately before we conducted a final biomodification test. Below are the tests we conducted: |
| - | + | :1. The modified enzymes: | |
| - | + | ::a. Are our modified enzymes synthesized by the bacterial cells? | |
| - | + | ::b. Do our modified enzymes modify our substrate in a non-microfluidic setting? | |
| - | + | :2. The microfluidic device : | |
| - | + | ::a. Will biotinylated fluorescent probes attach to NeutrAvidin coated walls of the microfluidic device? | |
| - | + | ::b. How long will biotinylated substances stay attached to the microfluidic device under continuous flow? | |
| - | + | ::c. Will cell lysate have an effect on the binding efficiency of our biotinylated proteins? | |
| - | + | ::d. Will biotinylated GFP bind to our microfluidic device? | |
| - | + | :3. Final bio-modification test: Will biotinylated enzymes bound to a microfluidic device modify our substrate? | |
:From these experiments we were able to extrapolate various results. | :From these experiments we were able to extrapolate various results. | ||
| - | [[file: | + | [[file:IGEM_Results_Cornell2011.JPG|700px|center]] |
=1) Modified Enzymes= | =1) Modified Enzymes= | ||
| - | |||
| - | + | ==1a) Western Blot of Violacein Enzymes and Fluorescent Proteins== | |
| - | + | '''Goal''' - The purpose of this western blot was to confirm the expression and biotinylation of AviTagged GFP and the three AviTagged enzymes involved in the prodeoxyviolacein synthesis pathway (VioA, VioB, and VioE). Additionally, the negative control in this experiment represents all the non-AviTagged proteins in the lysate of cells transformed with empty pZE12 vector. | |
| + | |||
| + | '''Experiment''' | ||
| + | ::The proteins were chemically extracted using BugBuster lysis buffer on 1mL samples of transformed DH5α bacteria. The cells used in this western blot are from the same 1L culture that was lysed to test BioFactory with the three Vio enzymes immobilized onto and the initial substrate L-tryptophan passing through the microfluidics channels. | ||
| + | |||
| + | ::Polyacrylamide gel electrophoresis and the subsequent transfer were both run for one hour. The proteins-of-interest were selected for with anti-biotin primary antibody linked to a horseradish peroxidase conjugate, since the AviTag peptide gets endogenously biotinylated by E. coli. The western blot image was taken after five minutes of film exposure. | ||
| + | |||
| + | '''Results''' | ||
| + | ::As expected, the negative control lane did not show any bands because the proteins in this lysate are not biotinylated on the AviTag peptide. Robust bands of VioA, VioE, and GFP migrated at distances expected for their molecular weight. This suggests that VioA, VioE, and GFP proteins were all successfully expressed and biotinylated in detectable quantities. In addition, AviTagged GFP was previously shown to bind the microfluidics channels of BioFactory in notable amounts. VioA and VioE displayed bands with sizes comparable to that of GFP, suggesting that the AviTagged VioA and VioE bound NeutrAvidin in detectable quantities if they could be visualized like GFP. On the other hand, no band appeared in the VioB lane. | ||
| + | |||
| + | '''Discussion''' | ||
| + | ::There are various possibilities for the absence of a VioB band. For instance, VioB may not be biotinylated at detectable levels. Evidence for this is shown in the image on the right. '''The orange-red colored pellet on the left is bacterial cells transformed with the AviTagged VioB sequence; the pellet on the right is a control to demonstrate the native color of cells.''' The distinct color change supports the hypothesis that VioB is expressing and active against its substrate found in the culture media. Also, the reaction mediated by VioB is the limiting step in the synthetic pathway of prodeoxyviolacein. Thus, bacteria will naturally produce less amounts of VioB than VioA and VioE. | ||
| + | |||
| + | [[file:Vio Enzymes Western BlotCombined Cornell2011.jpg|900px|center]] | ||
| + | |||
| + | ==1b) Functionality of biotinylated enzymes== | ||
| + | |||
| + | '''Goal'''-Determine Activity of Enzymes when biotinylated within ''E. Coli''. | ||
| + | |||
| + | '''Experiment''' | ||
| - | With the modified enzymes, we performed experiments to show their expression and utilization of tryptophan using a UV/Vis spectrometer at the peak wavelengths at which tryptophan responds to (590,638 | + | With the modified genetic constructs for the enzymes transformed in bacterial cultures, we performed experiments to show their expression and utilization of tryptophan using a UV/Vis spectrometer at the peak wavelengths at which tryptophan responds to (563, 590, and 638). The OD measurements of solutions contain equivolume of VioA, VioB, 40 mM Hydrogen Peroxide (for oxidation of tryptophan) and VioE lysate with varying concentration of tryptophan. The results are shown below. |
| + | '''Results:''' | ||
[[file:Graph-Tryptophan,Vioenzymes Cornell2011.jpg|750px|center]] | [[file:Graph-Tryptophan,Vioenzymes Cornell2011.jpg|750px|center]] | ||
| Line 48: | Line 67: | ||
Chembiochem : a European journal of chemical biology | Chembiochem : a European journal of chemical biology | ||
Vol. 7, 8, 2006, p. 1231 | Vol. 7, 8, 2006, p. 1231 | ||
| - | |||
| - | |||
| - | |||
| - | |||
| - | |||
| - | |||
| - | |||
| - | |||
| - | |||
| - | |||
| - | |||
| - | |||
| - | |||
| - | |||
| - | |||
=2) Microfluidic Device= | =2) Microfluidic Device= | ||
| Line 109: | Line 113: | ||
'''Goal''' - to determine how long the attached enzymes would stay attached under continuous flow. | '''Goal''' - to determine how long the attached enzymes would stay attached under continuous flow. | ||
| + | '''Experiment''' | ||
::*Negative Control - noncoated chip | ::*Negative Control - noncoated chip | ||
::*Test - Flow DI water through a chip with ATTO 520 attached to the NeutrAvidin coated PDMS for 15min. | ::*Test - Flow DI water through a chip with ATTO 520 attached to the NeutrAvidin coated PDMS for 15min. | ||
| Line 128: | Line 133: | ||
'''Experiment''' | '''Experiment''' | ||
| - | ::*Negative Control - A coated chip that is flushed with deionized | + | ::*Negative Control - A coated chip that is flushed with deionized water |
::*Test - A chip coated with NeutrAvidin with filtered GFP lysate flown through | ::*Test - A chip coated with NeutrAvidin with filtered GFP lysate flown through | ||
::*Flow Rate - 5 µL/min | ::*Flow Rate - 5 µL/min | ||
| Line 138: | Line 143: | ||
::The presence of green fluorescence shows that our BioBrick successfully bound to the channel wall. Furthermore, green fluorescence was still present even after the chip was stored for 4 days in the fridge. However, the fluorescence after 4 days was significantly less than the initial fluorescence. | ::The presence of green fluorescence shows that our BioBrick successfully bound to the channel wall. Furthermore, green fluorescence was still present even after the chip was stored for 4 days in the fridge. However, the fluorescence after 4 days was significantly less than the initial fluorescence. | ||
| - | '''Control''' '''Initial Test (in water)''' '''After 4 Days''' | + | '''Control''' '''Initial Test (in water)''' '''After 4 Days''' |
<html><img src="http://i95.photobucket.com/albums/l125/youngpaduan/1st%20GFP%20lysate%20test/th_control.jpg"></img> <img src="http://i95.photobucket.com/albums/l125/youngpaduan/1st%20GFP%20lysate%20test/th_GFPTestGradient.jpg"></img> <img src="http://i95.photobucket.com/albums/l125/youngpaduan/1st%20GFP%20lysate%20test/th_Jimstestbeforeh2owash.jpg"></img> <img src="http://i95.photobucket.com/albums/l125/youngpaduan/1st%20GFP%20lysate%20test/th_Jimstestafterh2owashfirstturn.jpg"></img> <img src="http://i95.photobucket.com/albums/l125/youngpaduan/1st%20GFP%20lysate%20test/th_Jimstestafterh2owashinletwall2.jpg"></img></html> | <html><img src="http://i95.photobucket.com/albums/l125/youngpaduan/1st%20GFP%20lysate%20test/th_control.jpg"></img> <img src="http://i95.photobucket.com/albums/l125/youngpaduan/1st%20GFP%20lysate%20test/th_GFPTestGradient.jpg"></img> <img src="http://i95.photobucket.com/albums/l125/youngpaduan/1st%20GFP%20lysate%20test/th_Jimstestbeforeh2owash.jpg"></img> <img src="http://i95.photobucket.com/albums/l125/youngpaduan/1st%20GFP%20lysate%20test/th_Jimstestafterh2owashfirstturn.jpg"></img> <img src="http://i95.photobucket.com/albums/l125/youngpaduan/1st%20GFP%20lysate%20test/th_Jimstestafterh2owashinletwall2.jpg"></img></html> | ||
| - | =3) Final Invitro | + | =3) Final Invitro Biosynthesis Test= |
'''Goal''' - to determine if prodeoxyviolacein can be produced in our cell free system. | '''Goal''' - to determine if prodeoxyviolacein can be produced in our cell free system. | ||
[[file:GoodViosetup Cornell2011.jpg|400px|right]] | [[file:GoodViosetup Cornell2011.jpg|400px|right]] | ||
| Line 160: | Line 165: | ||
[[file:VioResults Cornell2011.jpg|700px|center]] | [[file:VioResults Cornell2011.jpg|700px|center]] | ||
| + | <center>'''Eureka, color!'''</center> | ||
=Light-Induced Lysis= | =Light-Induced Lysis= | ||
| - | |||
We designed the light-induced apoptosis system using APE and submitted the part to Invitrogen Life Technologies for synthesis. Given our final construct was in excess of 6,000 bp, synthesis is currently being performed into two subsections. The first of which is the light sensitive promoter (Pcpcg2) followed by the lysis cassette and the genes necessary for the biosynthesis of phycobilins. The second component was the CCaS and CCaR. CCaS is the surface 532 nm green light activated protein which phosphorylates, and activates, CCaR to bind to the light sensitive promoter and express the downstream gene. | We designed the light-induced apoptosis system using APE and submitted the part to Invitrogen Life Technologies for synthesis. Given our final construct was in excess of 6,000 bp, synthesis is currently being performed into two subsections. The first of which is the light sensitive promoter (Pcpcg2) followed by the lysis cassette and the genes necessary for the biosynthesis of phycobilins. The second component was the CCaS and CCaR. CCaS is the surface 532 nm green light activated protein which phosphorylates, and activates, CCaR to bind to the light sensitive promoter and express the downstream gene. | ||
So far, we have received the second component of our light system, and we have BioBricked this part for submission and use with the international parts registry. Please see [http://partsregistry.org/wiki/index.php?title=Part:BBa_K597105 this page] for more information. | So far, we have received the second component of our light system, and we have BioBricked this part for submission and use with the international parts registry. Please see [http://partsregistry.org/wiki/index.php?title=Part:BBa_K597105 this page] for more information. | ||
=Mathematical Modeling= | =Mathematical Modeling= | ||
| - | Using | + | Using COMSOL Multiphysics software, we created a velocity profile for our microfluidic device. In creating our model, we assumed a no-slip boundary condition at the wall and a constant flow rate of 5 µl/min at the inlet and outlet ports. Using these conditions, the following velocity profiles were generated by our model. The first graph is a velocity profile for the entire chip, and the proceeding graphs are zoomed-in sections. The axes on the left and bottom of each plot signify position (in micrometers), and the color at every xy point represents the magnitude of the velocity at that point (meters/second). The colored bar on the right correlates a color with a velocity magnitude. Under these conditions, our model shows that the fluid velocity inside the channels is approximately constant throughout the microfluidic chip. |
| - | Velocity Profile of the Entire Chip (m/s) | + | A) Velocity Profile of the Entire Chip (m/s) |
<html><img src="http://i1214.photobucket.com/albums/cc481/mg573/comsol%20models/entirechip.jpg"></img> | <html><img src="http://i1214.photobucket.com/albums/cc481/mg573/comsol%20models/entirechip.jpg"></img> | ||
| - | <p>Velocity Profile of the Inlet (m/s)</p> | + | |
| + | <p>B) Velocity Profile of the Inlet (m/s)</p> | ||
<html><img src="http://i1214.photobucket.com/albums/cc481/mg573/comsol%20models/inlet.jpg"></img> | <html><img src="http://i1214.photobucket.com/albums/cc481/mg573/comsol%20models/inlet.jpg"></img> | ||
| - | <p>Velocity Profile of the Channel (m/s)</p> | + | |
| + | <p>C) Velocity Profile of the Channel (m/s)</p> | ||
<html><img src="http://i1214.photobucket.com/albums/cc481/mg573/comsol%20models/channel.jpg"></img> | <html><img src="http://i1214.photobucket.com/albums/cc481/mg573/comsol%20models/channel.jpg"></img> | ||
| - | <p>Velocity Profile of the Bend (m/s)</p> | + | |
| + | <p> D) Velocity Profile of the Bend (m/s) </p> | ||
<html><img src="http://i1214.photobucket.com/albums/cc481/mg573/comsol%20models/bend.jpg"></img> | <html><img src="http://i1214.photobucket.com/albums/cc481/mg573/comsol%20models/bend.jpg"></img> | ||
| - | <p>Velocity Profile of the Outlet (m/s)</p> | + | |
| + | <p>E) Velocity Profile of the Outlet (m/s)</p> | ||
<html><img src="http://i1214.photobucket.com/albums/cc481/mg573/comsol%20models/outlet.jpg"></img> | <html><img src="http://i1214.photobucket.com/albums/cc481/mg573/comsol%20models/outlet.jpg"></img> | ||
| + | </font> | ||
Latest revision as of 03:07, 29 October 2011
Results |
Protocol |
Notebook |
Parts Submitted
Contents |
Results Summary
- Two of the main components of our project are as follows:
- AviTagged enzymes that modify a substrate according to a biosynthetic pathway
- Avidin coated microfluidic channels which bind AviTagged proteins
- We decided to test these 2 components separately before we conducted a final biomodification test. Below are the tests we conducted:
- 1. The modified enzymes:
- a. Are our modified enzymes synthesized by the bacterial cells?
- b. Do our modified enzymes modify our substrate in a non-microfluidic setting?
- 2. The microfluidic device :
- a. Will biotinylated fluorescent probes attach to NeutrAvidin coated walls of the microfluidic device?
- b. How long will biotinylated substances stay attached to the microfluidic device under continuous flow?
- c. Will cell lysate have an effect on the binding efficiency of our biotinylated proteins?
- d. Will biotinylated GFP bind to our microfluidic device?
- 3. Final bio-modification test: Will biotinylated enzymes bound to a microfluidic device modify our substrate?
- From these experiments we were able to extrapolate various results.
1) Modified Enzymes
1a) Western Blot of Violacein Enzymes and Fluorescent Proteins
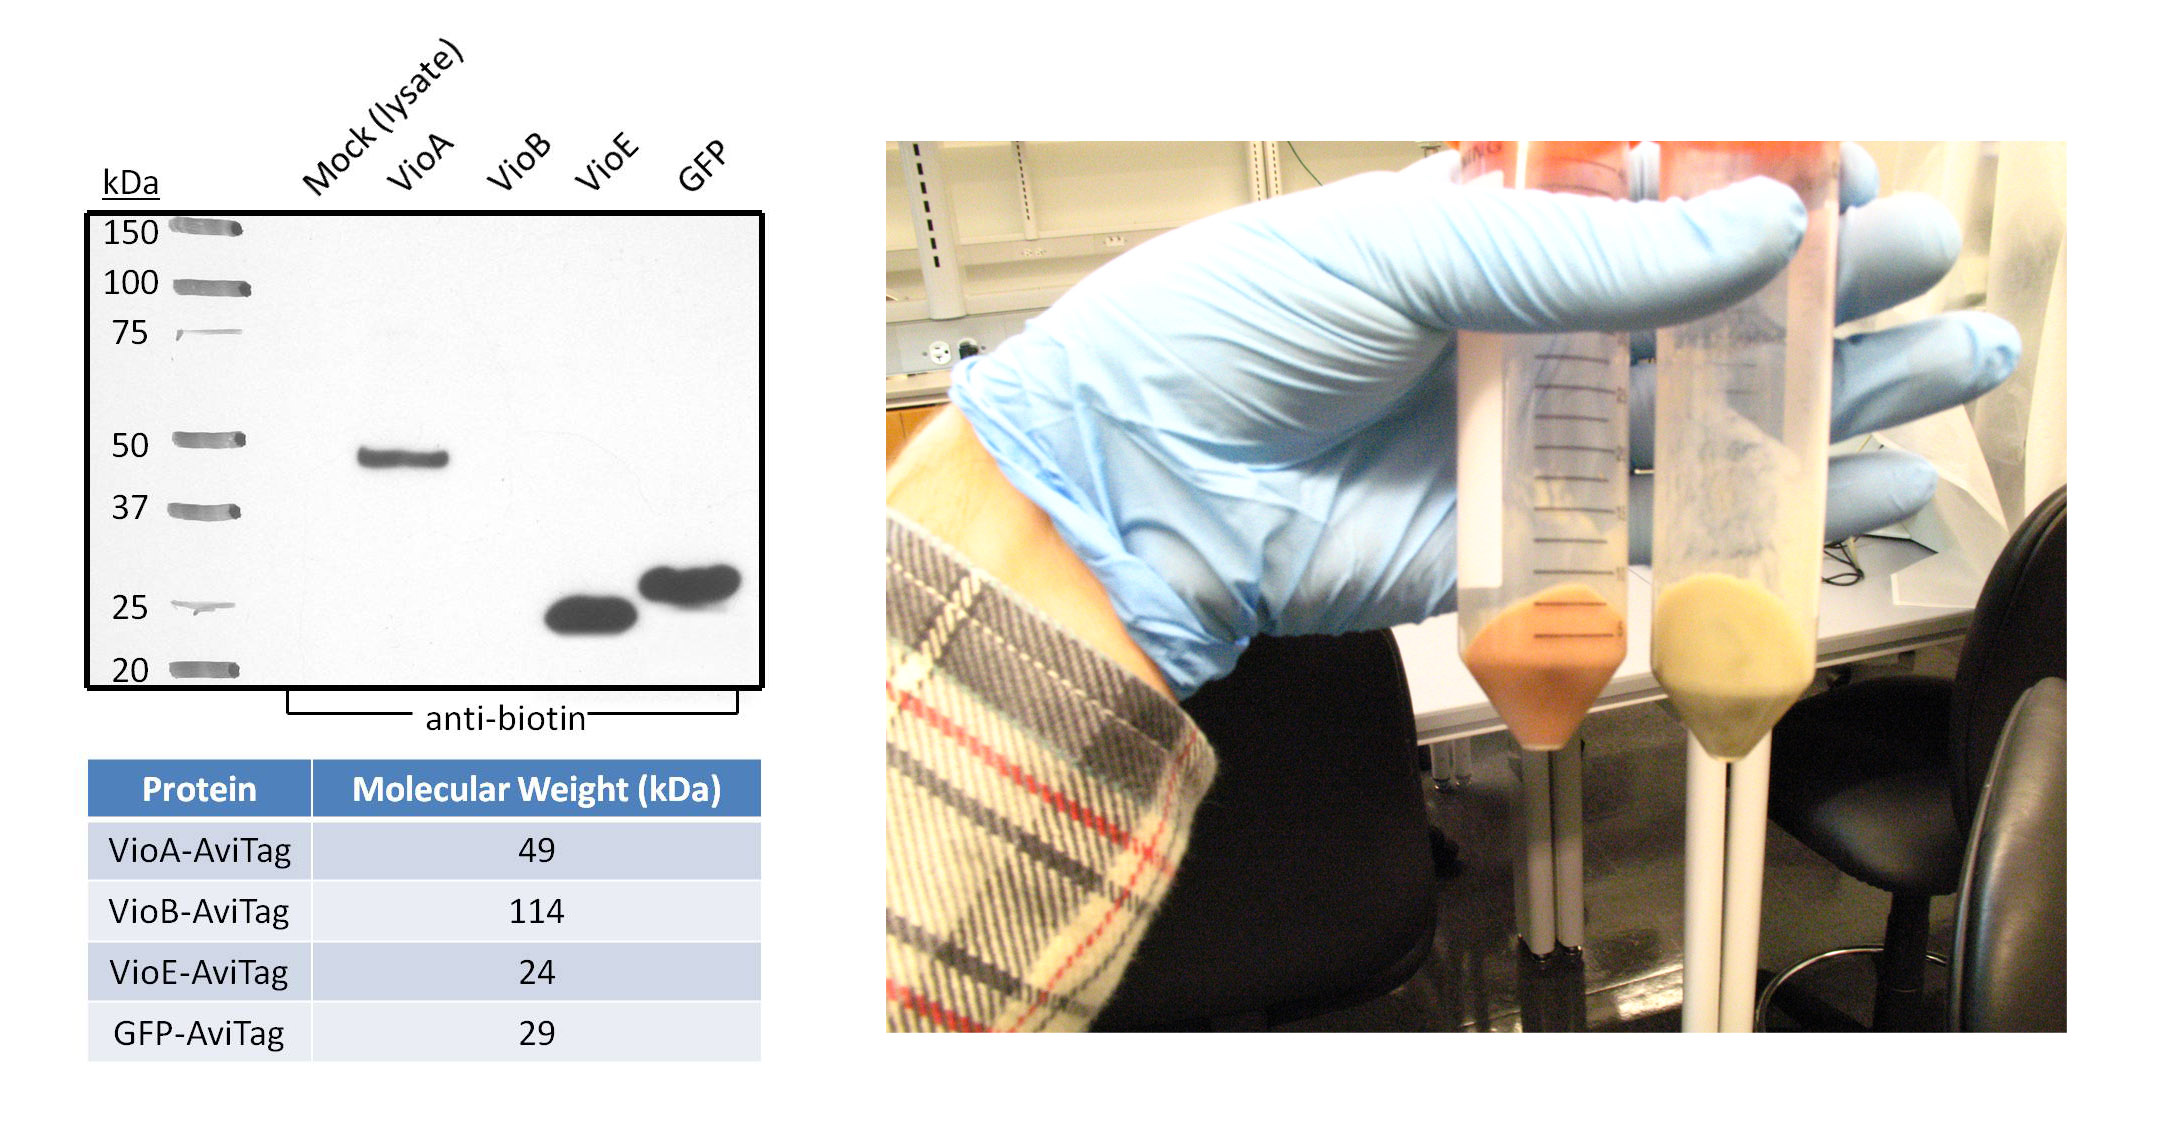
Goal - The purpose of this western blot was to confirm the expression and biotinylation of AviTagged GFP and the three AviTagged enzymes involved in the prodeoxyviolacein synthesis pathway (VioA, VioB, and VioE). Additionally, the negative control in this experiment represents all the non-AviTagged proteins in the lysate of cells transformed with empty pZE12 vector.
Experiment
- The proteins were chemically extracted using BugBuster lysis buffer on 1mL samples of transformed DH5α bacteria. The cells used in this western blot are from the same 1L culture that was lysed to test BioFactory with the three Vio enzymes immobilized onto and the initial substrate L-tryptophan passing through the microfluidics channels.
- Polyacrylamide gel electrophoresis and the subsequent transfer were both run for one hour. The proteins-of-interest were selected for with anti-biotin primary antibody linked to a horseradish peroxidase conjugate, since the AviTag peptide gets endogenously biotinylated by E. coli. The western blot image was taken after five minutes of film exposure.
Results
- As expected, the negative control lane did not show any bands because the proteins in this lysate are not biotinylated on the AviTag peptide. Robust bands of VioA, VioE, and GFP migrated at distances expected for their molecular weight. This suggests that VioA, VioE, and GFP proteins were all successfully expressed and biotinylated in detectable quantities. In addition, AviTagged GFP was previously shown to bind the microfluidics channels of BioFactory in notable amounts. VioA and VioE displayed bands with sizes comparable to that of GFP, suggesting that the AviTagged VioA and VioE bound NeutrAvidin in detectable quantities if they could be visualized like GFP. On the other hand, no band appeared in the VioB lane.
Discussion
- There are various possibilities for the absence of a VioB band. For instance, VioB may not be biotinylated at detectable levels. Evidence for this is shown in the image on the right. The orange-red colored pellet on the left is bacterial cells transformed with the AviTagged VioB sequence; the pellet on the right is a control to demonstrate the native color of cells. The distinct color change supports the hypothesis that VioB is expressing and active against its substrate found in the culture media. Also, the reaction mediated by VioB is the limiting step in the synthetic pathway of prodeoxyviolacein. Thus, bacteria will naturally produce less amounts of VioB than VioA and VioE.
1b) Functionality of biotinylated enzymes
Goal-Determine Activity of Enzymes when biotinylated within E. Coli.
Experiment
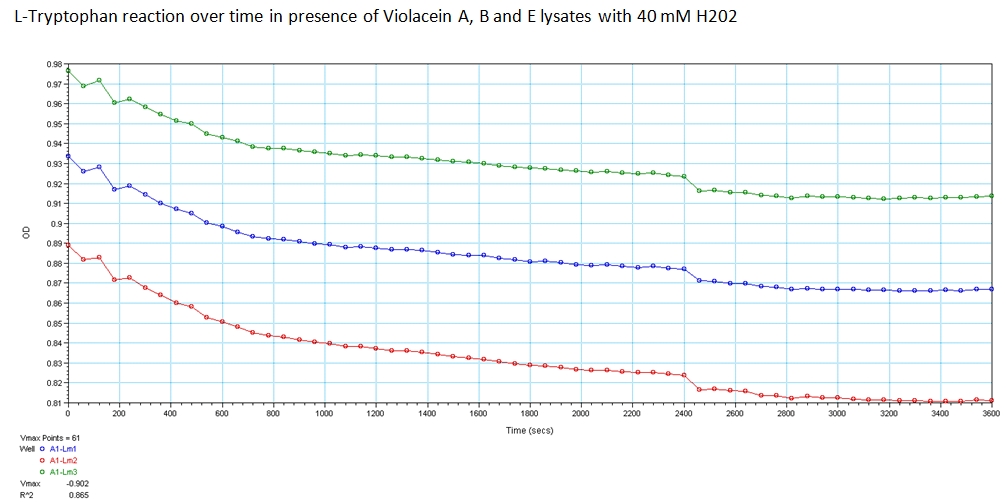
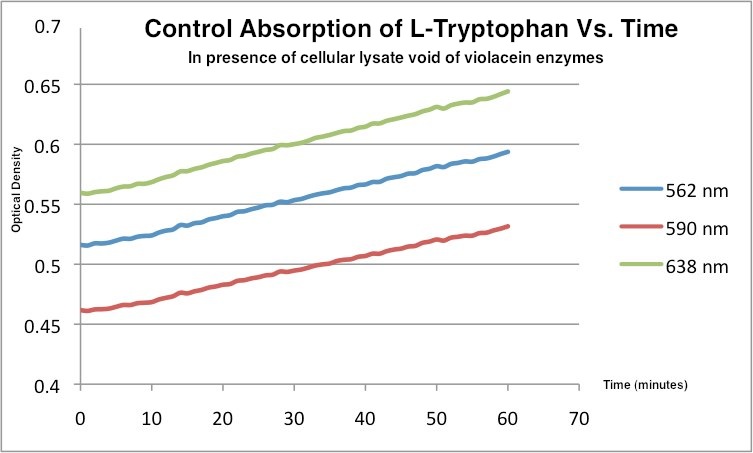
With the modified genetic constructs for the enzymes transformed in bacterial cultures, we performed experiments to show their expression and utilization of tryptophan using a UV/Vis spectrometer at the peak wavelengths at which tryptophan responds to (563, 590, and 638). The OD measurements of solutions contain equivolume of VioA, VioB, 40 mM Hydrogen Peroxide (for oxidation of tryptophan) and VioE lysate with varying concentration of tryptophan. The results are shown below.
Results:
The green points represent readings at 562 nm, blue at 590 nm, and red at 638 nm at 0.008 g/mL concentration of L-Tryptophan and 40 mM H202. As you can see, the absorbance of tryptophan noticeably decreases over a time course of 1 hour. This experiment was recreated varying the ratio of enzymes and concentration of initial tryptophan. The results showed a similar decreasing trend.
This is the control tryptophan readings. In the absence of violacein enzymes, the amount of tryptophan showed the opposite trend.
Peak wavelength values were found with the following reference
Sánchez, C Reevaluation of the violacein biosynthetic pathway and its relationship to indolocarbazole biosynthesis. Chembiochem : a European journal of chemical biology Vol. 7, 8, 2006, p. 1231
2) Microfluidic Device
2a) Binding Experiment
Goal - to determine if the biotinylated enzymes would attach to the NeutrAvidin coated wall.
Experiment
- Negative Control - chip that is not coated with NeutrAvidin through which we flowed ATTO 590.
- Test - NeutrAvidin coated chip through which we flowed ATTO 590.
- Flow Rate - 5 µL/min
- Run Time - 20 min
- After the experiment, air was flown through the chips and pictures were taken.
Results
- The red fluorescence indicates that the enzyme successfully bound to the channel wall.
Control Test


2b) Lysate Experiment
Goal - to determine the effect lysate would have on the binding efficiency between the NeutrAvidin coated walls and the biotinylated enzymes.
Experiment
- Positive Control - NeutrAvidin coated chip through which we flowed ATTO 520
- Negative Control - uncoated chip through which we flowed ATTO 520
- Test - NeutrAvidin coated chip through which we flowed a 5:1 ratio of lysate to ATTO 520.
- Flow Rate = 5 µL/min
- Total Run Time = 30 min
- Entire setup was covered in aluminum foil and the lights were dimmed.
After the experiment, air was flown through the chips and pictures were taken. Channels were filled with deionized water and stored in the 4 degree fridge wrapped in aluminum foil.
Results
- The test chip showed a lower level of fluorescence compared to the positive control chip. This indicates that lysate has a small inhibitory effect on the binding between NeutrAvidin and biotin.
Negative Control Positive Control Test


2c) Continuous Flow Experiment
Goal - to determine how long the attached enzymes would stay attached under continuous flow.
Experiment
- Negative Control - noncoated chip
- Test - Flow DI water through a chip with ATTO 520 attached to the NeutrAvidin coated PDMS for 15min.
- Flow Rate = 200 µL/min
- Total Run Time = 45 min (three 15 min intervals)
- After each interval, the chip was washed with air and a picture was taken in air.
Results
- The pictures indicate that the fluorescence gradually decreases under continuous flow. This suggests that the chips might have to be recoated after extended wear.
Control After 15 min After 30 min After 45 min



2d) GFP BioBrick
Goal - to determine if our AviTagged GFP will bind to our NeutrAvidin-coated chip.
Experiment
- Negative Control - A coated chip that is flushed with deionized water
- Test - A chip coated with NeutrAvidin with filtered GFP lysate flown through
- Flow Rate - 5 µL/min
- Total Run Time - 20 min
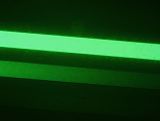
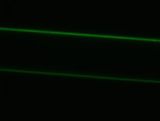
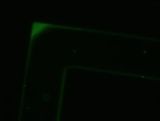
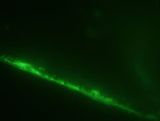
- The GFP containing cells were lysed with BugBuster and filtered through a PD-10 Desalting Columns to remove excess biotin. Afterwards the chip was stored in deionized water in the fridge in aluminum foil. 4 days later we took the chip out and imaged it again. Then deionized water was flushed through and the chip was reimaged. It was seen that most of the binding occurred at the inlet port and the first channel. By the second channel, no fluorescence was detected.
Results
- The presence of green fluorescence shows that our BioBrick successfully bound to the channel wall. Furthermore, green fluorescence was still present even after the chip was stored for 4 days in the fridge. However, the fluorescence after 4 days was significantly less than the initial fluorescence.
Control Initial Test (in water) After 4 Days

3) Final Invitro Biosynthesis Test
Goal - to determine if prodeoxyviolacein can be produced in our cell free system.
Experiment
- Negative Control - 3 coated chips (blank chips) with tryptophan flushed through
- Control 1 - VioA chip, VioB chip and a Blank chip
- Control 2 - VioA chip and Blank chip ::*Test - VioA chip, VioB chip and VioE chip
- Flow Rate - 5 µL/min
- Total Run Time - 6 hours
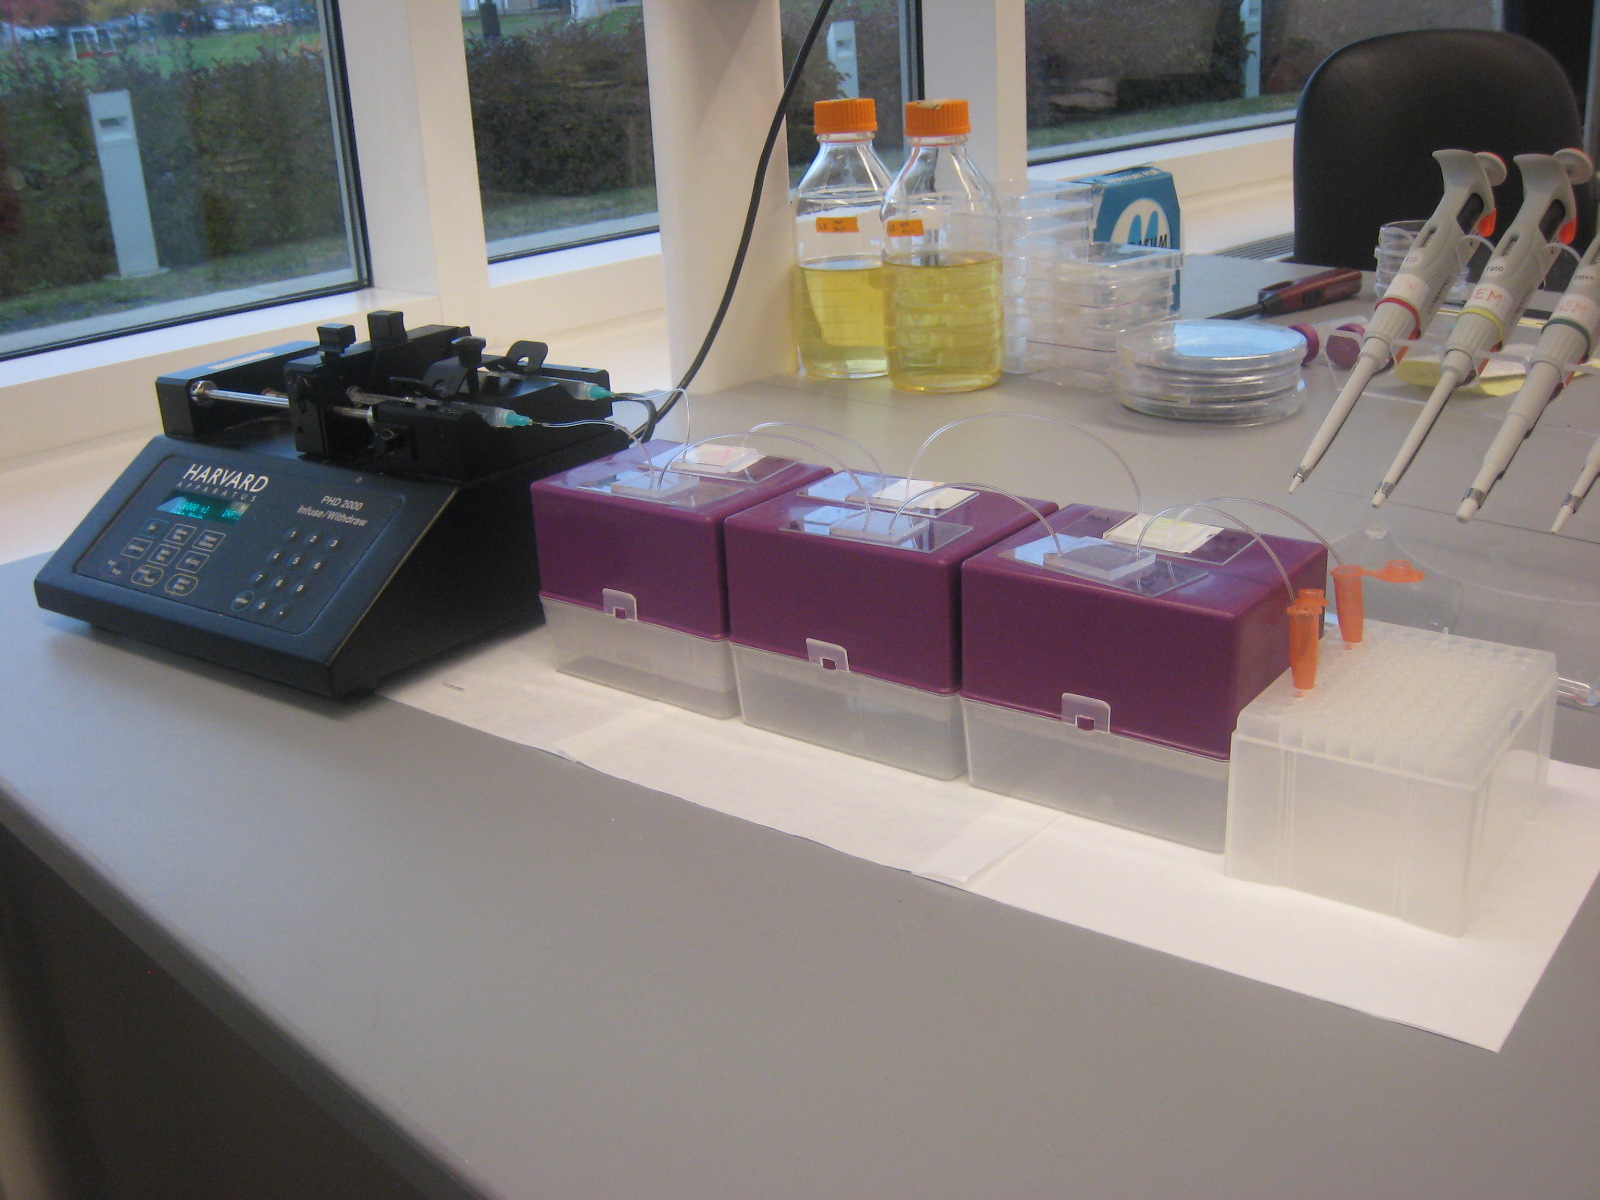
- Enzymes were incubated in the chips for 1 hour with no flow. The enzyme solution was then replace with fresh enzyme solution and incubated again for 1 hr. The constructed enzyme-immobilized chips were then connected in series such that a solution containing tryptophan substrate would flow through each chip in the order of the pathway. Dissolved solution of 0.04 g/ml tryptophan and 0.040 mM H2O2 at a pH of 9.0 was flown in a continuous flow reaction at 5 µl/min. The enzymatic pathway is flow path is VioA VioB VioE into prodeoxyviolacein. 1 ml samples were collected after 6 hours of continuous flow.
Results
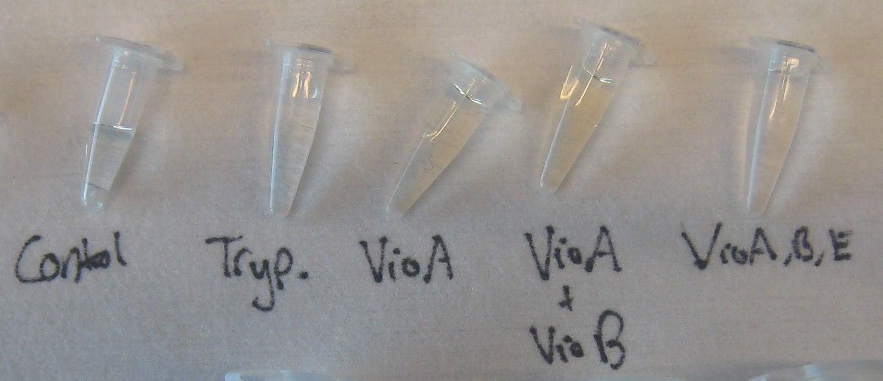
The Results show that the tryptophan solution undergoes at least 2 chemical reactions due to the formation of a colored product after the VioA chip and the removal of that color after the VioE chip. The solution after the VioB chip exhibited the same coloration as the collected samples after VioA. Further chemical testing will be done the week of October 31st to do HPLC confirmation of prodeoxyviolacein formation.
The positive western blots prove the presence of biotinyalted VioA and VioE which should have similar binding efficiency to the GFP binding experiment. Initial western blot did not confirm the presence of VioB, most likely due to its size. However, the 1 Liter VioB culture prepared for this experiment exhibited a deep red color, unique among the prepared cultures which signifies the presence of a non-native chemical reaction which we believe to be active VioB enzyme.
Light-Induced Lysis
We designed the light-induced apoptosis system using APE and submitted the part to Invitrogen Life Technologies for synthesis. Given our final construct was in excess of 6,000 bp, synthesis is currently being performed into two subsections. The first of which is the light sensitive promoter (Pcpcg2) followed by the lysis cassette and the genes necessary for the biosynthesis of phycobilins. The second component was the CCaS and CCaR. CCaS is the surface 532 nm green light activated protein which phosphorylates, and activates, CCaR to bind to the light sensitive promoter and express the downstream gene.
So far, we have received the second component of our light system, and we have BioBricked this part for submission and use with the international parts registry. Please see [http://partsregistry.org/wiki/index.php?title=Part:BBa_K597105 this page] for more information.
Mathematical Modeling
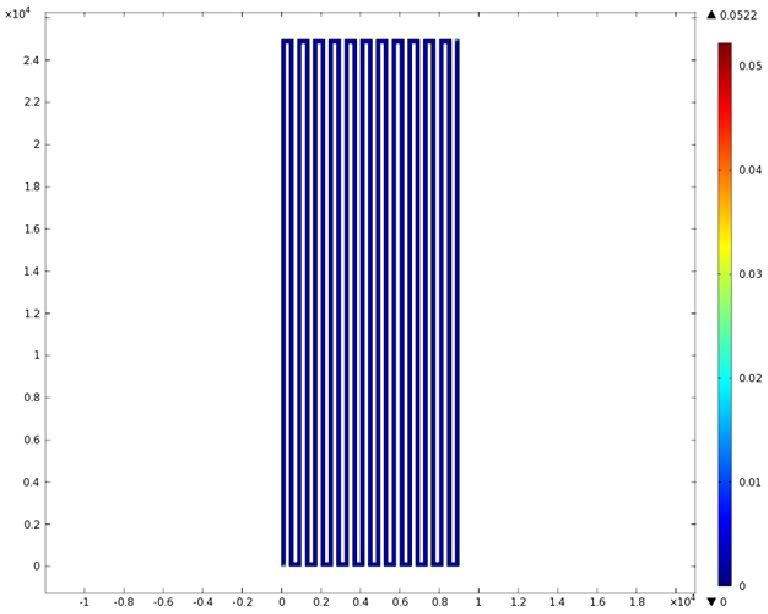
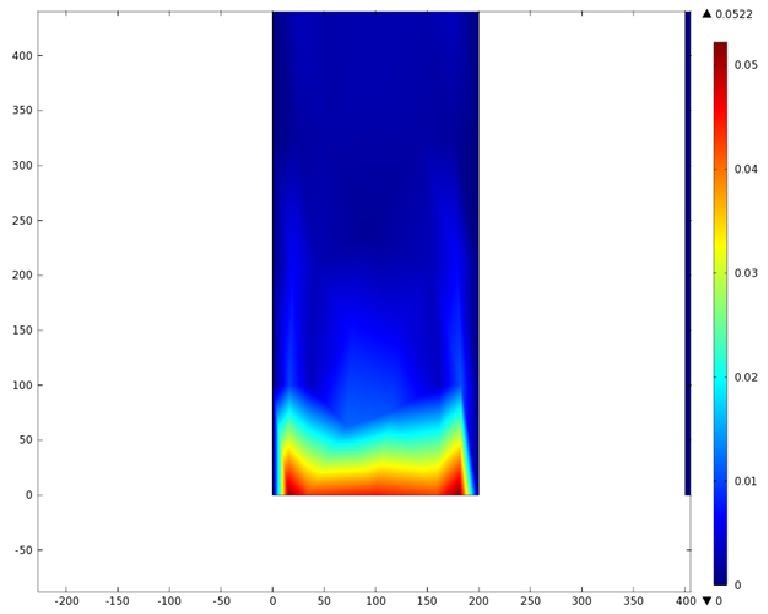
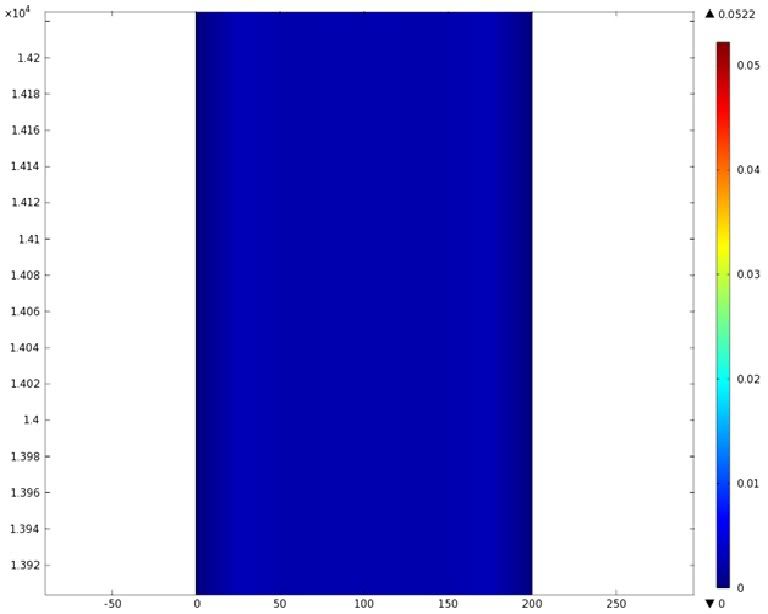
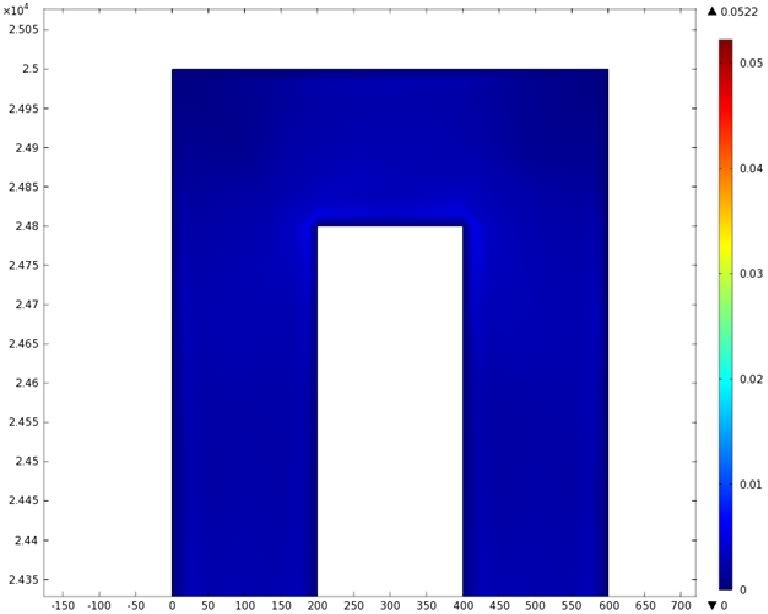
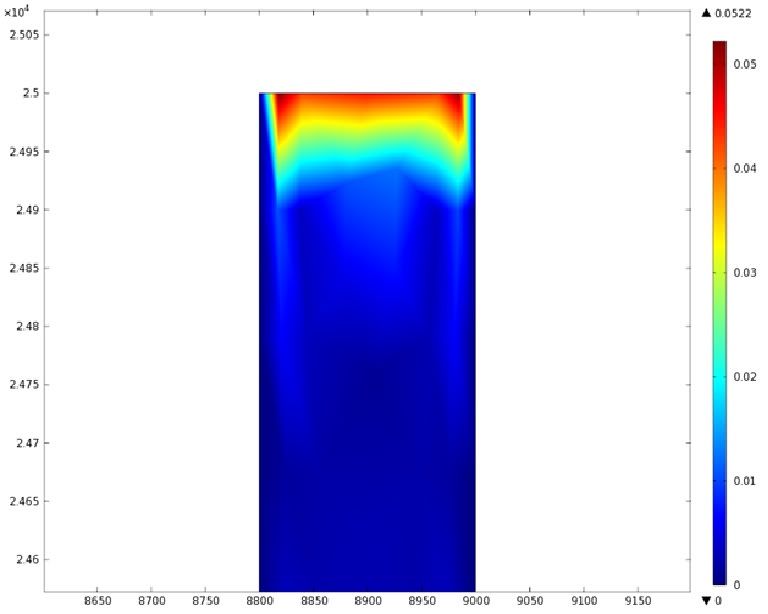
Using COMSOL Multiphysics software, we created a velocity profile for our microfluidic device. In creating our model, we assumed a no-slip boundary condition at the wall and a constant flow rate of 5 µl/min at the inlet and outlet ports. Using these conditions, the following velocity profiles were generated by our model. The first graph is a velocity profile for the entire chip, and the proceeding graphs are zoomed-in sections. The axes on the left and bottom of each plot signify position (in micrometers), and the color at every xy point represents the magnitude of the velocity at that point (meters/second). The colored bar on the right correlates a color with a velocity magnitude. Under these conditions, our model shows that the fluid velocity inside the channels is approximately constant throughout the microfluidic chip.
A) Velocity Profile of the Entire Chip (m/s)
B) Velocity Profile of the Inlet (m/s)
C) Velocity Profile of the Channel (m/s)
D) Velocity Profile of the Bend (m/s)
E) Velocity Profile of the Outlet (m/s)
 "
"


