Team:Imperial College London/Project/Chemotaxis/Results
From 2011.igem.org
| Line 228: | Line 228: | ||
</html> | </html> | ||
[[File:ICL_semisolid_nc_0to0.1M.jpg]] | [[File:ICL_semisolid_nc_0to0.1M.jpg]] | ||
| + | <html> | ||
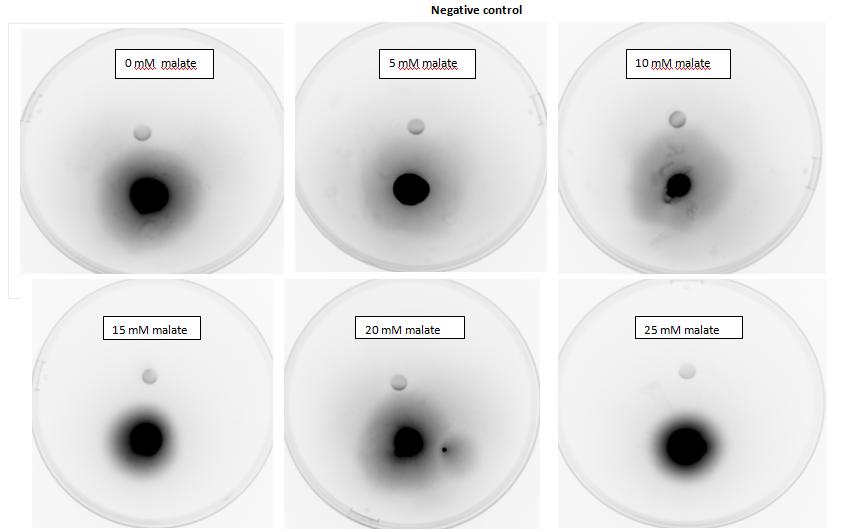
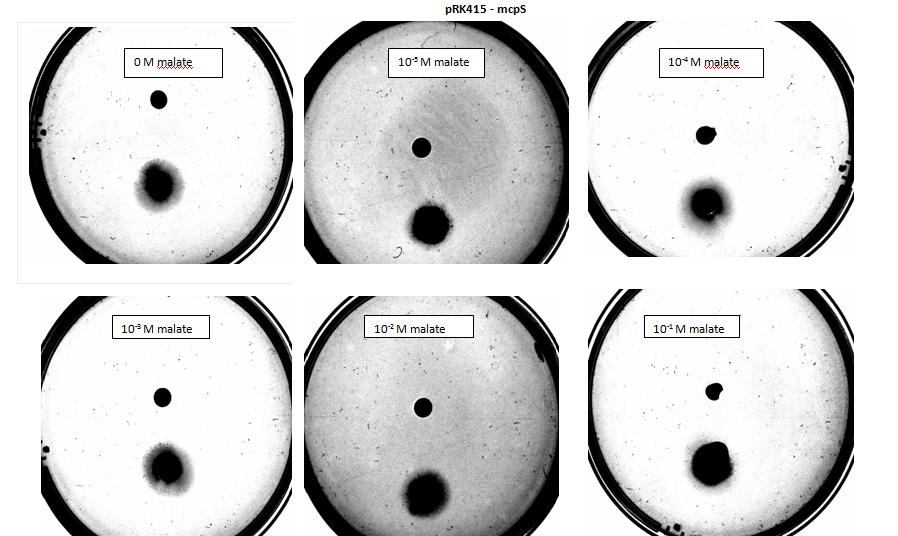
| + | <p><i>Figure 1: Negative control pictured for the attraction E. coli cells, with added attractant malate. Rising consentrations of malate were tested, 0 M, 10<sup>-5</sup> M, 10 <sup>-</sup> M, 10 <sup>-3</sup> M, 10 <sup>-2</sup> M, 10 <sup>-1</sup> M. Circular colonies are observed with rising concentrations.</i></p> | ||
| + | </html> | ||
[[File:ICL_semisolid_nc_0to25mM.jpg]] | [[File:ICL_semisolid_nc_0to25mM.jpg]] | ||
| + | <html> | ||
| + | </html> | ||
[[File:ICL_semisolid_pc_0to0.1M.jpg]] | [[File:ICL_semisolid_pc_0to0.1M.jpg]] | ||
| + | <html> | ||
| + | </html> | ||
[[File:ICL_semisolid_pc_0to25mM.jpg]] | [[File:ICL_semisolid_pc_0to25mM.jpg]] | ||
| + | <html> | ||
| + | </html> | ||
[[File:ICL_semisolid_mcpS_0to0.1M.jpg]] | [[File:ICL_semisolid_mcpS_0to0.1M.jpg]] | ||
| + | <html> | ||
| + | </html> | ||
[[File:ICL_semisolid_mcpS_0to25mM.jpg]] | [[File:ICL_semisolid_mcpS_0to25mM.jpg]] | ||
| + | </html> | ||
<html> | <html> | ||
<h2>18th of August</h2> | <h2>18th of August</h2> | ||
Revision as of 10:37, 31 August 2011
Chemotaxis Results
28th of July
-We have made tryptone broth, which will be used to grow E. coli (K-12 D10b strain) overnight before the chemotaxis
experiments, for them to develop flagella and therefore they will be capable of chemotaxis. To make tryptone broth look
at protocols.
-Cells have been transformed with backbone plasmid pSB1C3 carrying biobrick BBa_K398500, with constitutive promoter J23100,
protocol for transformation can be found here.
Chapter 1 Assembly
3rd of August
-transformation of PA2652 fragments into E coli competent cells. Fragment numbers 22 & 23.
-miniprep of the 22 & 23 cells to obtain DNA.
-gibson assembly of 22&23 fragments.
-Due to this we have transformed 5a strain with a high copy plasmid containing ampicillin and kanamycin resistance (AK3 backbone)and sfGFP. These cells have been numbered 17.
Chapter 2 bacteria uptake into roots
Wednesday, 3 August 2011
One important part of our project is uptake of our bacteria into plant roots. The observation that this occurs (albeit under controlled lab settings) is new and was only published last year. We attempted to replicate these findings.
In preparation, we met with Dr Martin Spitaler who advised us on how to prepare samples for the confocal microscopy. Confocal microscopy is much more precise than conventional light field microscopy as it eliminates background light by focusing the laser through a pinhole (Mark Scott, oral communication). The confocal microscopy will focus on imaging GFP expressing bacteria inside Arabidopsis roots to show that uptake of the bacteria takes place.
Staining of wt roots with DiD, a lipophilic dye that stains the plant membranes and does not interfere with the absorption or emission spectra of GFP and Dendra, was unsuccessful. However, natural fluorescence was measured in a root in a spectrum that does not interfere with measuring GFP. We should therefore not need to dye the roots before imaging.
Stack of wt Arabidopsis root. The root can be imaged at around 488nm. Imaging carried out by Dr Martin Spitaler.
We may also try to stain the roots with propidium iodide, which is also a strong indicator of cell wall break down.
Thursday, 4 August 2011
We prepared the GFP-expressing bacteria for plant infection. They were spun down and media was exchanged prior to incubation at 37°C to reach exponential phase. Bacteria were then spun down and resuspended in wash buffer (5mM MES) to reach OD 30. 8ml, 4ml and 2ml were added to separate flasks, containing 100ml of half-MS media each. 4ml and 6ml of wash buffer were added to the flasks containing 4ml and 2ml bacteria, respectively. 8ml of wash buffer was added to the negative control. Ten Arabidopsis seedlings were distributed into each of the flasks. Incubation was carried out for 15 hours prior to imaging.
Friday, 5 August 2011
Prior to imaging, roots were washed in PBS to wash off bacteria and facilitate imaging. We imaged the plants incubated with 8ml of bacteria and were able to find bacteria inside one of the roots. A 3D picture was taken of uninfected roots and roots containing bacteria by taking a Z stackk image using confocal microscopy.
This video shows a zoom from the top to the bottom of the root. It was put together from successive images taken at different depth levels. The GFP-expressing bacteria are clearly visible within the root.
We also imaged roots that did not contain bacteria via a similar Z-stack scan. This image is shown below.
Chapter 3: Experiments
Experiments involving chemotaxis can be split to two categories, qualitative and quantitative. In the qualitative experiments, we are able to show that bacteria, which we study do or do not move towards a source, however it does not inform us at all about the cell count.
5th of August - Agar plug in assay
The simplest method for studying chemotaxis is to use agar plug in assay, which is a simple experimental method to show bacterial movement towards a localised chemical source.
Experiment is performed as follows, bacteria are added into the plate on one side, and the attractant to the other. Result is then the shape of the formed colony which grows into distorted elipse shape within the agar if the attractant is present, however colony shape remains circular if no attractant was added.
In our experiment we have used 5-α Escherichia coli cells. Cells used as positive control were transformed with pSB1C3 plasmid backbone, which conferred chloramphenicol resistance. These cells have not been modified in any other way and were used to show 5-α E. coli are capable of chemotaxis, using serine as attractant, which acts as a ligand for Tsr, an endogenous chemoreceptor. 5-α Escherichia coli competent cells were also transformed with pRK415 a working plasmid with mcpS gene and tetracycline resistance. These cells express mcpS gene from P. putida KT2440, which is chemoreceptor with malate as its ligand, and therefore malate was used as attractant for these cells during agar plug in assay. As a negative control, no attractant was added into the plate.
Amount of attractant added contributes greatly towards the result, as too little attractant added will not stimulate bacteria to move towards source, however too much attractant will result in the saturation of the medium and the bacteria will not chemotax towards source. Values (concentration of attractant, distance between colony and attractant at start etc.), necessary to perform this experiment have been worked out using modelling.
These are the values of attractant concentration we have used, when 5µl sample was added into the plate:|
|
1 |
2 |
3 |
4 |
5 |
|
Concentration |
1.884x10⁻³ mol/L |
1.884x10⁻² mol/L |
1.884x10⁻¹ mol/L |
0.5 mol/L |
0.75 mol/L |
|
Amount |
9.42x10⁻⁹ mol |
9.42x10⁻⁸ mol |
9.42x10⁻⁷ mol |
2.5x10⁻⁷ mol |
3.75x10⁻⁶ mol |
Note: Concentration values for 4 & 5 were not obtained from models. They were overestimations to show possible saturation of the medium with attractant.
Results:

Figure 1: Negative control pictured for the attraction E. coli cells, with added attractant malate. Rising consentrations of malate were tested, 0 M, 10-5 M, 10 - M, 10 -3 M, 10 -2 M, 10 -1 M. Circular colonies are observed with rising concentrations.


 </html>
18th of August
Capillary assayquantitative, bacterial movement into a syringe/capillary based on attraction, number of bacteria measured in a capillary after 30min using FACS machine. motility medium & high bacterial OD used..
Modeling
Malate concentration distribution
For our project, malate is the chemoattractant that results in the movement of E.coli. In this section, we will first model the concentration distribution of the chemoattractant, malate in the soil. Then, we will model the bacteria concentration pattern as a result of this distribution of malate. Finally, we will infer some useful information by analysing the results of the modelling.
We will model the concentration distributions of malate and bacteria using the Keller-Segel model which is governed by the two equations shown below. Solving the equations will give the concentration distributions of the malate and the bacteria respectively
 ---------------------------------------------------------------------------------------------(1)
 -------------------------------------------------------(2)
s = concentration of chemoattractant
D = diffusion coefficient of chemoattractant
f = degradation of chemoattractant
b = number concentration of bacteria
µ = bacterial diffusion coefficient (how fast bacteria spread)
χ = chemotactic coefficient (how sensitive bacteria are)
g = bacterial cell growth
h = bacterial cell death
The values of the above parameters for E. coli are shown in the following table. These values will be used for the modelling.
Parameter description |
Notation |
Value |
Initial bacterial concentration |
b0 |
108 cells/ml |
Initial attractant concentration |
s0 |
0.1 mM or 0.1 mol/m3 |
Bacterial diffusion coefficient |
µ |
1.5*10-5 cm2/s |
Bacterial chemotactic coefficient |
χ |
1.5-75*10-5 cm2/s |
Attractant diffusion coefficient |
D |
10-5 cm2/s |
Reference: Overview of Mathematical Approaches Used to Model Bacterial Chemotaxis II: Bacterial Populations
The assumptions that we have made are as follow:
- The entire root system is assumed to take the shape of a long cylinder. Hence, a cylindrical coordinate system will be used.
- The system is axisymmetric and there is no variation along the vertical length of the root. Hence,

- The system has reached steady state and is time-independent. Hence,

- Degradation of chemoattractant is first order and is described by f = ks where k is the degradation rate of the chemoattractant.
- Bacterial cell growth and death are neglected. Hence, g(b,s) = h(b,s) = 0
Applying the assumptions above, equation (1) becomes
![]()
Rearranging,
![]() -------------------------------------------------(3)
-------------------------------------------------(3)
Equation (3) is in the form of the modified Bessel equation. Hence, the solution of equation (3) is given by,
![]()
Where K0 is the modified Bessel function.
Since it is unrealistic for the concentration to increase to infinity, A=0. And applying the boundary condition, the solution becomes,
![]() -----------------------------------------------------(4)
-----------------------------------------------------(4)
The modeling result show that the steady-state pattern of malate distribution. The concentration of malate is a variable against the distance


Chemotaxis
1. Signal pathway of a single bacterium
- the signal transfer inside the bacterium
chemoattractant stimulation -> chemoreceptor -> CheA -> CheY-P -> flagellar motor -> changed switching frequency between swimming and tumbling (biasing fraction) - the phosphrylation level of CheY can indicate the signal transferring pathway, the CheY-P concentration increases when the chemoreceptor is triggered
- the modeling result will show the optimal concentration to trigger the chemoreceptors (10-6 mol/L)
high = saturated chemoreceptors
low = cannot be detected


2. Bacterial population dynamics
An animation is made to show the movement of the population:
mainly by diffusion, biased motion with the presence of chemoattractant
based on the malate distribution in steady-state and the Spiro model
 "
"


