Team:Washington/Magnetosomes/GibsonResults
From 2011.igem.org
| (20 intermediate revisions not shown) | |||
| Line 2: | Line 2: | ||
__NOTOC__ | __NOTOC__ | ||
| - | <center><big><big><big><big>'''Gibson Toolkits: | + | <center><big><big><big><big>'''Gibson Toolkits: Assembly Efficiency'''</big></big></big></big></center><br><br> |
==Comparison between pGA and pSB vectors== | ==Comparison between pGA and pSB vectors== | ||
| - | To quantitatively illustrate that | + | To quantitatively illustrate that higher cloning efficiency is achieved with pGA vectors than with standard pSB vectors, we conducted a [https://2011.igem.org/Team:Washington/Protocols/pGA comparative Gibson assembly assay]. For the pGA vector assay, we used a [http://partsregistry.org/wiki/index.php?title=Part:BBa_K173025 pLac-GFP] insert from pGA1C3 with a pGA1A3 backbone. Both of these had already been previously gel extracted, therefore, we proceed straight to the Gibson Reaction. For the pSB vectors, we started with the same pLac-GFP insert from a pSB3K3 with a pSB1A3 Backbone. Both the insert and backbone were amplified using PCR (1 ng template DNA in 20 uL reaction), and gel extracted. From this point, we preformed our Gibson Assay. |
| + | <br/> | ||
| + | [[Image:Washington_GibEff_Equation.png|center|300px]] | ||
| + | <br/> | ||
| + | The Gibson products made using our pGA vectors and the standard pSB vectors were plated separately over 6 plates, and the Gibson assembly efficiency ('''E<sub>G</sub>''') was calculated for each plate by dividing the # of bright colonies ('''C<sub>B</sub>''') by the # of background colonies ('''C<sub>K</sub>''') subtracted from the sum of bright and dim colonies ('''C<sub>B</sub>''' and '''C<sub>C_D</sub>''', respectively).<br/> | ||
| - | + | [[File:Washington_iGEM2011_pSB.png|thumb|left|500px|pSB vector plate]] | |
| - | + | [[File:Washington_iGEM2011_pGA.png|thumb|right|500px|pGA vector plate]] | |
| + | <br/><br/><br/><br/><br/><br/><br/><br/><br/><br/><br/><br/><br/><br/><br/><br/><br/><br/><br/><br/><br/> | ||
| + | Once the Gibson efficiences were calculated for each set of plates, the average Gibson efficiency was calculated. The average Gibson efficiency of using our pGA vectors was '''0.99'' with a standard error of 0.002. This value is significantly higher than that of the pSB vectors with an assembly efficiency of 0.12 with a standard error of 0.01. Visually, one can see that there is a much higher ratio of fluorescent colonies to nonfluorescent colonies on the pGA plate compared to the pSB plate. One additional thing to note is that the pGA transformation required one-tenth less product from the Gibson assembly reaction to produce roughly the same number of colony forming units, suggesting a higher likelihood of getting proper inserts for more difficult assembly reactions such as those with more than two fragments. | ||
| + | [[File:Washington_iGEM2011_VectorComparison.png|thumb|center|500px|Gibson Assembly Efficiency Comparison]] | ||
| - | + | Based on the comparison presented, we can be certain that our Gibson Assembly vectors (pGA vectors) are a great choice for gene assemblies! | |
| - | + | ||
| - | + | ||
| - | + | ||
| - | + | ||
| - | + | ||
| - | + | ||
Latest revision as of 05:49, 19 October 2011
Comparison between pGA and pSB vectors
To quantitatively illustrate that higher cloning efficiency is achieved with pGA vectors than with standard pSB vectors, we conducted a comparative Gibson assembly assay. For the pGA vector assay, we used a [http://partsregistry.org/wiki/index.php?title=Part:BBa_K173025 pLac-GFP] insert from pGA1C3 with a pGA1A3 backbone. Both of these had already been previously gel extracted, therefore, we proceed straight to the Gibson Reaction. For the pSB vectors, we started with the same pLac-GFP insert from a pSB3K3 with a pSB1A3 Backbone. Both the insert and backbone were amplified using PCR (1 ng template DNA in 20 uL reaction), and gel extracted. From this point, we preformed our Gibson Assay.
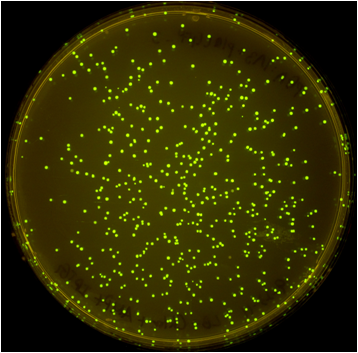
The Gibson products made using our pGA vectors and the standard pSB vectors were plated separately over 6 plates, and the Gibson assembly efficiency (EG) was calculated for each plate by dividing the # of bright colonies (CB) by the # of background colonies (CK) subtracted from the sum of bright and dim colonies (CB and CC_D, respectively).
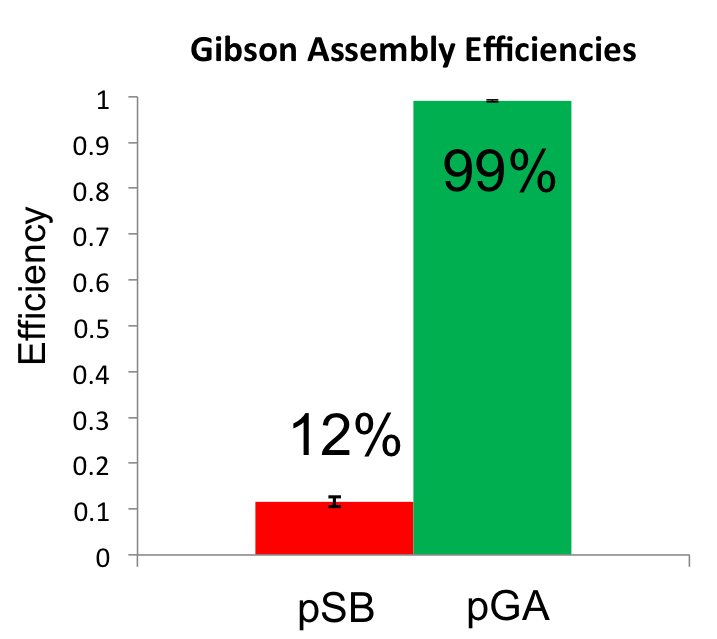
Once the Gibson efficiences were calculated for each set of plates, the average Gibson efficiency was calculated. The average Gibson efficiency of using our pGA vectors was '0.99 with a standard error of 0.002. This value is significantly higher than that of the pSB vectors with an assembly efficiency of 0.12 with a standard error of 0.01. Visually, one can see that there is a much higher ratio of fluorescent colonies to nonfluorescent colonies on the pGA plate compared to the pSB plate. One additional thing to note is that the pGA transformation required one-tenth less product from the Gibson assembly reaction to produce roughly the same number of colony forming units, suggesting a higher likelihood of getting proper inserts for more difficult assembly reactions such as those with more than two fragments.
Based on the comparison presented, we can be certain that our Gibson Assembly vectors (pGA vectors) are a great choice for gene assemblies!
 "
"


