Team:UT-Tokyo/Data/Modeling/Model01
From 2011.igem.org
| (15 intermediate revisions not shown) | |||
| Line 1: | Line 1: | ||
| - | {{:Team:UT-Tokyo/Templates/BeginContent|fullpagename=Team:UT-Tokyo/Data/Modeling/Model01|subpagename=Model1: L-Asp diffusion | + | {{:Team:UT-Tokyo/Templates/BeginContent|fullpagename=Team:UT-Tokyo/Data/Modeling/Model01|subpagename=Model1}} |
| + | =[[Team:UT-Tokyo/Data/Modeling|Modeling]]/Model1: L-Asp diffusion= | ||
| + | |||
| + | =[[Team:UT-Tokyo/Data/Modeling/Model01/applet|Interactive demo]]= | ||
=Aim= | =Aim= | ||
| - | + | It was required to know the behavior of L-Asp diffusion to perform our entire simulation (model3). | |
| - | to | + | We experimentally checked Asp diffusion using TLC method but the results were insufficient for the entire simulation. |
| + | So we decided to investigate the Asp diffusion by numerical simulation. | ||
=Method= | =Method= | ||
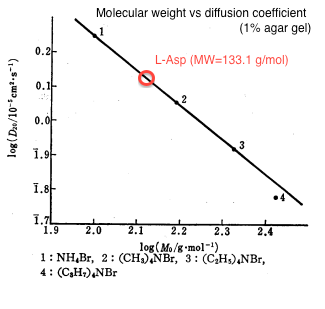
| - | We | + | We estimated the value of diffusion coefficient by interpolating molecular mass of L-Asp (133) from the relationship between molecular weight and diffusion constant as shown in figure 1<html><sup class="ref">[1]</sup></html>. |
| - | + | ||
| + | {{:Team:UT-Tokyo/Templates/Image|file=utt_m1_fig1.png|caption=Figure 1. Molecular Weight v.s. Diffusion Constant (1% agar. gel)}} | ||
| + | |||
The estimated value was D = 0.001 [<html>mm<sup>2</sup>/sec</html>]. | The estimated value was D = 0.001 [<html>mm<sup>2</sup>/sec</html>]. | ||
| + | We used 0.25% agar gel in our experiment and according to the previous study<html><sup class="ref">[2]</sup></html>, there is no practical difference of diffusion coefficient between 1% and 0.25% agar gel. | ||
| - | |||
We simulated the time development of the L-Asp concentration distribution. | We simulated the time development of the L-Asp concentration distribution. | ||
| - | We | + | We simulated the diffusion equation using 1st order finite difference method. |
| - | + | ||
| - | using 1st order finite difference method. | + | [[File:utt_m1_eqn1.png]] |
| + | |||
| + | A indicates the L-Asp concentration and D means the diffusion coefficient. | ||
The shape of system was a circle with radius 5cm. | The shape of system was a circle with radius 5cm. | ||
| - | We dropped <html> | + | We dropped 2×10<html><sup>-7</sup></html> mol Asp at the center of the circle as the initial state. |
=Result= | =Result= | ||
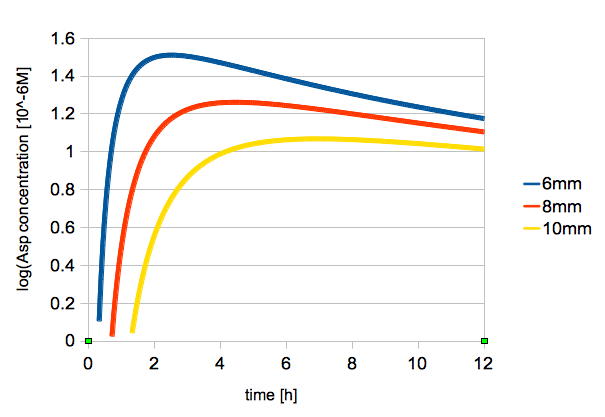
| - | The time change of logarithmic values of L-Asp concentration is shown in figure | + | The time change of logarithmic values of L-Asp concentration at 2, 6, 8 mm from the center is shown in figure 3. |
| - | + | {{:Team:UT-Tokyo/Templates/Image|file=utt_m1_fig2.png|caption=Figure 3. Change in L-Asp Concentration Over Time (2, 6, 8 mm from the center)}} | |
| - | + | ||
| - | = | + | |
| - | + | ||
| - | + | ||
<html> | <html> | ||
| Line 30: | Line 34: | ||
<div id="references"> | <div id="references"> | ||
<ul> | <ul> | ||
| - | <li id="ref_1">[1] Toshiko M, Masayuki N. | + | <li id="ref_1">[1] Toshiko M, Masayuki N "measurement of diffusion coefficient using agar. gel" Chemical Society of Japan, 1978, 26, 5, 377</li> |
| + | <li id="ref_2">[2] W. Derbyshire, I. D. Duff "N.m.r of Agarose Gels" Chem. Soc., 1974, 57, 243-254</li> | ||
</ul> | </ul> | ||
</div> | </div> | ||
</html> | </html> | ||
{{:Team:UT-Tokyo/Templates/EndContent}} | {{:Team:UT-Tokyo/Templates/EndContent}} | ||
Latest revision as of 20:51, 5 October 2011
Model1

iGEM UT-Tokyo
Modeling/Model1: L-Asp diffusion
Interactive demo
Aim
It was required to know the behavior of L-Asp diffusion to perform our entire simulation (model3). We experimentally checked Asp diffusion using TLC method but the results were insufficient for the entire simulation. So we decided to investigate the Asp diffusion by numerical simulation.
Method
We estimated the value of diffusion coefficient by interpolating molecular mass of L-Asp (133) from the relationship between molecular weight and diffusion constant as shown in figure 1[1].
The estimated value was D = 0.001 [mm2/sec]. We used 0.25% agar gel in our experiment and according to the previous study[2], there is no practical difference of diffusion coefficient between 1% and 0.25% agar gel.
We simulated the time development of the L-Asp concentration distribution. We simulated the diffusion equation using 1st order finite difference method.
A indicates the L-Asp concentration and D means the diffusion coefficient. The shape of system was a circle with radius 5cm. We dropped 2×10⁻⁷ mol Asp at the center of the circle as the initial state.
Result
The time change of logarithmic values of L-Asp concentration at 2, 6, 8 mm from the center is shown in figure 3.
References
- [1] Toshiko M, Masayuki N "measurement of diffusion coefficient using agar. gel" Chemical Society of Japan, 1978, 26, 5, 377
- [2] W. Derbyshire, I. D. Duff "N.m.r of Agarose Gels" Chem. Soc., 1974, 57, 243-254
 "
"


