|
|
| (12 intermediate revisions not shown) |
| Line 6: |
Line 6: |
| | <div id="boxcontent"><DL> | | <div id="boxcontent"><DL> |
| | <div class="heading">Vitamin A:</div> | | <div class="heading">Vitamin A:</div> |
| - | <DD><a href="#">Project</a><br/> | + | <DD><a href="https://2011.igem.org/Team:Johns_Hopkins/Project/VitA">Project</a><br/> |
| | <DD><a href="#">Parts</a><br/> | | <DD><a href="#">Parts</a><br/> |
| | <DD><a href="#">Protocols</a><br/></br/></DL> | | <DD><a href="#">Protocols</a><br/></br/></DL> |
| | <div class="heading">Modeling:</div><DL> | | <div class="heading">Modeling:</div><DL> |
| - | <DD><a href="#">Modeling Platforms</a><br/> | + | <DD><a href="https://2011.igem.org/Team:Johns_Hopkins/Modeling/Platforms">Modeling Platforms</a><br/> |
| - | <DD><a href="#">Analytic Methods</a><br/> | + | <DD><a href="https://2011.igem.org/Team:Johns_Hopkins/Modeling/Methods">Analytic Methods</a><br/> |
| - | <DD><a href="#">Gene Expression</a><br/> | + | <DD><a href="https://2011.igem.org/Team:Johns_Hopkins/Modeling/Opt">Optimization</a><br/> |
| - | <DD><a href="#">Vitamin A</a><br/> | + | <DD><a href="https://2011.igem.org/Team:Johns_Hopkins/Modeling/GeneExp">Gene Expression</a><br/> |
| - | <DD><a href="#">Vitamin C</a><br/></br/></DL> | + | <DD><a href="https://2011.igem.org/Team:Johns_Hopkins/Modeling/VitC">Vitamin C</a><br/></br/></DL> |
| | </div> | | </div> |
| | </div> | | </div> |
| Line 24: |
Line 24: |
| | ==== Graphical model ==== | | ==== Graphical model ==== |
| | | | |
| - | [[Image:https://static.igem.org/mediawiki/2011/5/5b/Beta-carotene_graphic.jpg|610px|Image generated using Matlab SimBiology Toolbox]] | + | [[File:Beta-carotene_graphic.jpg|610px|Image generated using Matlab SimBiology Toolbox]] |
| | | | |
| | Note that lycopene and beta-carotene are representing by their characteristic colors. "hh" stands for "dihydro" and "pp" stands for "pyrophosphate". | | Note that lycopene and beta-carotene are representing by their characteristic colors. "hh" stands for "dihydro" and "pp" stands for "pyrophosphate". |
| Line 30: |
Line 30: |
| | Our full LBS model includes both gene expression and the metabolic pathway. | | Our full LBS model includes both gene expression and the metabolic pathway. |
| | | | |
| - | [[modeling:full-vita-lbs|The full pathway+expression beta-carotene model in LBS]] | + | [https://2011.igem.org/Team:Johns_Hopkins/Modeling/FullVitALBS The full pathway+expression beta-carotene model in LBS] |
| | | | |
| | We developed a simplified LBS model to examine the metabolic pathway in isolation from gene expression. | | We developed a simplified LBS model to examine the metabolic pathway in isolation from gene expression. |
| | | | |
| - | [[modeling:vita-lbs|The beta-carotene pathway model in LBS]] | + | [https://2011.igem.org/Team:Johns_Hopkins/Modeling/VitAPathLBS The beta-carotene pathway model in LBS] |
| - | | + | |
| - | [[File:Vita mm.png|610px|beta-carotene lbs}}
| + | |
| | | | |
| | + | [[File:Vita mm.png|610px|beta-carotene lbs]] |
| | | | |
| | ==== Matlab model ==== | | ==== Matlab model ==== |
| | We chose to port our model to Matlab's SimBiology Toolbox in order to facilitate complex analysis. To speed computations, this model has been simplified by taking enzyme concentrations as constant, assuming that the gene expression component of our system has reached a steady state. | | We chose to port our model to Matlab's SimBiology Toolbox in order to facilitate complex analysis. To speed computations, this model has been simplified by taking enzyme concentrations as constant, assuming that the gene expression component of our system has reached a steady state. |
| | | | |
| - | [[modeling:vita-SBML|The full beta-carotene model exported from the Matlab SimBiology Toolbox]] | + | [https://2011.igem.org/Team:Johns_Hopkins/Modeling/VitASimBio The full beta-carotene model exported from the Matlab SimBiology Toolbox] |
| | | | |
| - | Note: all parameters for these models are listed [[modeling:parameters|here]]. | + | Note: all parameters for these models are listed [https://2011.igem.org/Team:Johns_Hopkins/Modeling/Para here]. |
| | | | |
| | ===== Sensitivity Analysis ===== | | ===== Sensitivity Analysis ===== |
| - | Sensitivity analysis attempts to determine how the output changes with respect to small changes in the model parameters. In this case, we can represent this as $d[beta-carotene]/d[input_i]$. We found that for the beta-carotene system. Sensitivity to the Michaelis-Menten binding constant k<sub>m</sub> is nearly zero. We can interpret this as meaning the substrate concentration is high enough to saturate the enzyme at each step of the pathway. V<sub>max</sub>, which is the product of k<sub>cat</sub> and the enzyme concentration, controls the reaction rate. Thus we show the sensitivities with respect to k<sub>cat</sub>. The plot has been normalized so that maximum sensitivity is 1. | + | Sensitivity analysis attempts to determine how the output changes with respect to small changes in the model parameters. In this case, we can represent this as \[d[beta-carotene]/d[input_{i}]\]. We found that for the beta-carotene system. Sensitivity to the Michaelis-Menten binding constant k<sub>m</sub> is nearly zero. We can interpret this as meaning the substrate concentration is high enough to saturate the enzyme at each step of the pathway. V<sub>max</sub>, which is the product of k<sub>cat</sub> and the enzyme concentration, controls the reaction rate. Thus we show the sensitivities with respect to k<sub>cat</sub>. The plot has been normalized so that maximum sensitivity is 1. |
| - | | + | |
| - | {{:modeling:bc_sensitivity.png?800|beta-carotene sensitivities}}
| + | |
| | | | |
| - | Notice that sensitivity to the GGPP synthases is reduced since GGPP can be synthesized by either of two enzymes. As you might expect, the sensitivities for each GGPP synthase sum to 1. Further, notice that beta-carotene production is not sensitive to the maximum turnover rate of neurosporene cyclase, the enzyme which causes leakage from the pathway. This is a result of the leakage being minor to begin with. Also, as mentioned before, all the enzymes are saturated, so a small leakage will not cause the next reaction to slow down. | + | [[File:8bca95afbcb52162eb9cc1b1c266eb85.media.800x470.png|thumb|300px|beta-carotene sensitivities]]Notice that sensitivity to the GGPP synthases is reduced since GGPP can be synthesized by either of two enzymes. As you might expect, the sensitivities for each GGPP synthase sum to 1. Further, notice that beta-carotene production is not sensitive to the maximum turnover rate of neurosporene cyclase, the enzyme which causes leakage from the pathway. This is a result of the leakage being minor to begin with. Also, as mentioned before, all the enzymes are saturated, so a small leakage will not cause the next reaction to slow down. |
| | | | |
| | ===== Optimization ===== | | ===== Optimization ===== |
| - | For a discussion of the optimization techniques used and the nitrogen allocation analysis which follows, see our [[modeling:opto|optimization techniques]]. | + | For a discussion of the optimization techniques used and the nitrogen allocation analysis which follows, see our [https://2011.igem.org/Team:Johns_Hopkins/Modeling/Opt optimization techniques]. |
| | == Pareto frontier == | | == Pareto frontier == |
| - | {{:modeling:beta-carotene_opto_points.png|Pareto front}}
| + | [[Image:Beta-carotene_opto_points.png|610px|β-carotene pathway Pareto front]] |
| | == Nitrogen allocation == | | == Nitrogen allocation == |
| - | {{:modeling:bc_nitro_alloc.png|Nitrogen allocation}}
| + | [[Image:Bc nitro alloc.png|610px|β-Carotene nitrogen allocation]] |
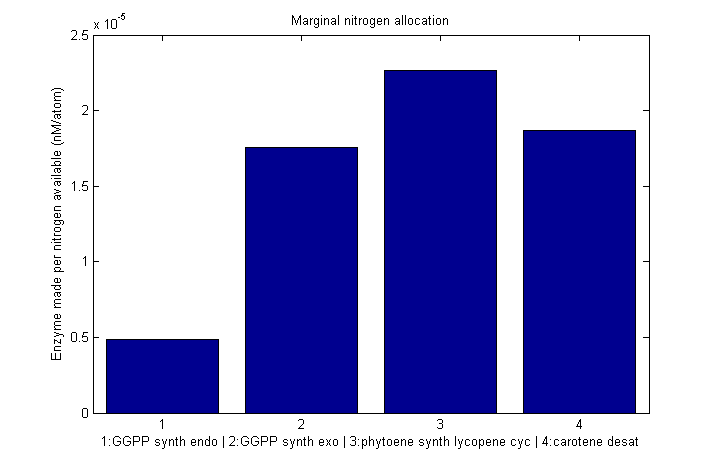
| | == Marginal nitrogen allocation == | | == Marginal nitrogen allocation == |
| - | {{:modeling:bc_nitro_marginal.png|Marginal allocation}}
| + | [[Image:Bc_nitro_marginal.png|610px|Marginal nitrogen allocation]] |
| | == Fractional marginal nitrogen allocation == | | == Fractional marginal nitrogen allocation == |
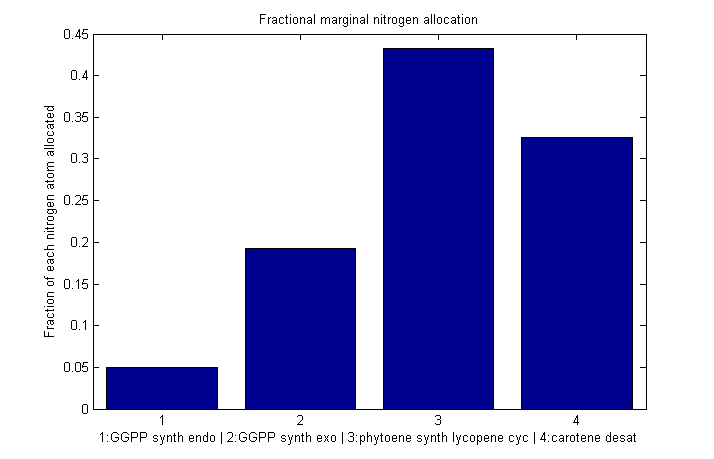
| - | {{:modeling:bc_nitro_marginal_frac.png|Fractional marginal allocation}}
| + | [[Image:Bc nitro marginal frac.png|610px|Fraction of each nitrogen atom allocated to each enzyme]] |
| | <html> | | <html> |
| | </div> | | </div> |
Vitamin A
Models
Graphical model
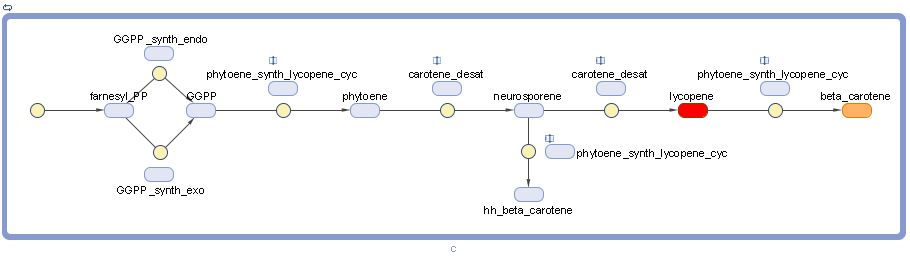
Note that lycopene and beta-carotene are representing by their characteristic colors. "hh" stands for "dihydro" and "pp" stands for "pyrophosphate".
LBS model
Our full LBS model includes both gene expression and the metabolic pathway.
The full pathway+expression beta-carotene model in LBS
We developed a simplified LBS model to examine the metabolic pathway in isolation from gene expression.
The beta-carotene pathway model in LBS
Matlab model
We chose to port our model to Matlab's SimBiology Toolbox in order to facilitate complex analysis. To speed computations, this model has been simplified by taking enzyme concentrations as constant, assuming that the gene expression component of our system has reached a steady state.
The full beta-carotene model exported from the Matlab SimBiology Toolbox
Note: all parameters for these models are listed here.
Sensitivity Analysis
Sensitivity analysis attempts to determine how the output changes with respect to small changes in the model parameters. In this case, we can represent this as \[d[beta-carotene]/d[input_{i}]\]. We found that for the beta-carotene system. Sensitivity to the Michaelis-Menten binding constant km is nearly zero. We can interpret this as meaning the substrate concentration is high enough to saturate the enzyme at each step of the pathway. Vmax, which is the product of kcat and the enzyme concentration, controls the reaction rate. Thus we show the sensitivities with respect to kcat. The plot has been normalized so that maximum sensitivity is 1.

beta-carotene sensitivities
Notice that sensitivity to the GGPP synthases is reduced since GGPP can be synthesized by either of two enzymes. As you might expect, the sensitivities for each GGPP synthase sum to 1. Further, notice that beta-carotene production is not sensitive to the maximum turnover rate of neurosporene cyclase, the enzyme which causes leakage from the pathway. This is a result of the leakage being minor to begin with. Also, as mentioned before, all the enzymes are saturated, so a small leakage will not cause the next reaction to slow down.
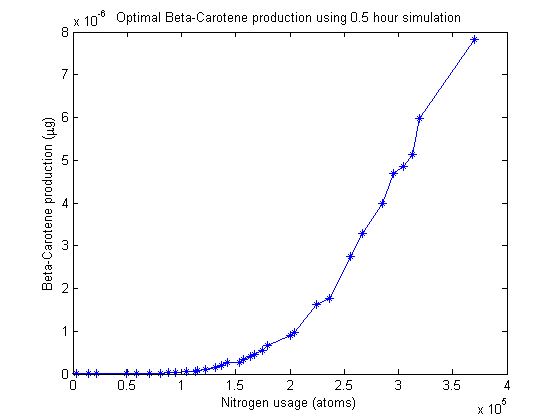
Optimization
For a discussion of the optimization techniques used and the nitrogen allocation analysis which follows, see our optimization techniques.
Pareto frontier
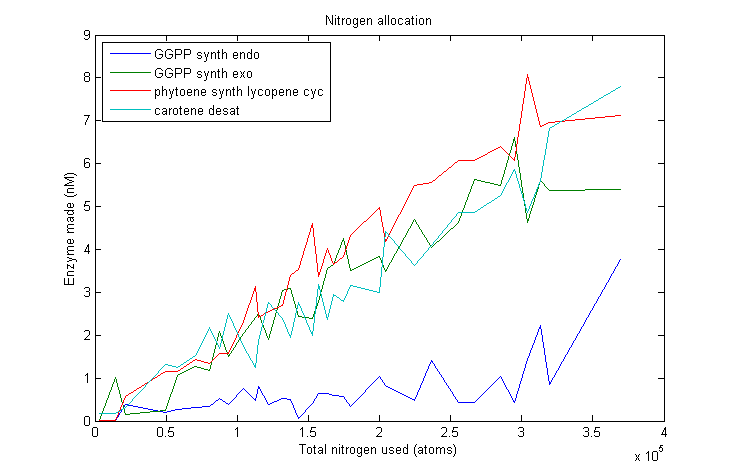
Nitrogen allocation
Marginal nitrogen allocation
Fractional marginal nitrogen allocation
 "
"


