Team:EPF-Lausanne/Our Project/T7 promoter variants/recovery
From 2011.igem.org
(→Experimental Setup) |
(→Experimental Setup) |
||
| Line 14: | Line 14: | ||
| - | We grow two large cultures of cells. One contains cells that will lyse and release plasmids into the supernatant while the other has non-lysing cells containing a control (empty) plasmid. Adding IPTG to both flasks induces lysis in one set of cells but not in the others. If you would like to find out more about how IPTG induction experiments work, please click [[Team:EPF-Lausanne/ | + | We grow two large cultures of cells. One contains cells that will lyse and release plasmids into the supernatant while the other has non-lysing cells containing a control (empty) plasmid. Adding IPTG to both flasks induces lysis in one set of cells but not in the others. If you would like to find out more about how IPTG induction experiments work, please click [[Team:EPF-Lausanne/Our_Project/T7_promoter_variants/lysis/iptg|here]]. |
[[File:iptg_platecount_text.png|390px|left]] | [[File:iptg_platecount_text.png|390px|left]] | ||
Revision as of 17:26, 21 September 2011
Lysis Selection System
Lysis selection system Main | Lysis Characterization | DNA Recovery | DNA Selection | T7 Promoter VariantsContents |
DNA Recovery
Introduction
We wanted to find out if cells release their plasmid DNA into the culture supernatant when they lyse and if we can recover this DNA for further analyses.
Experimental Setup
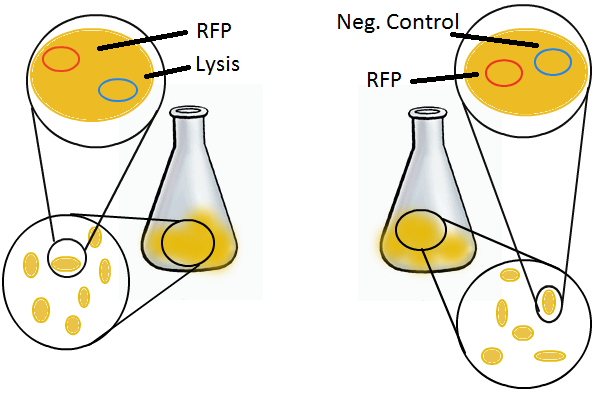
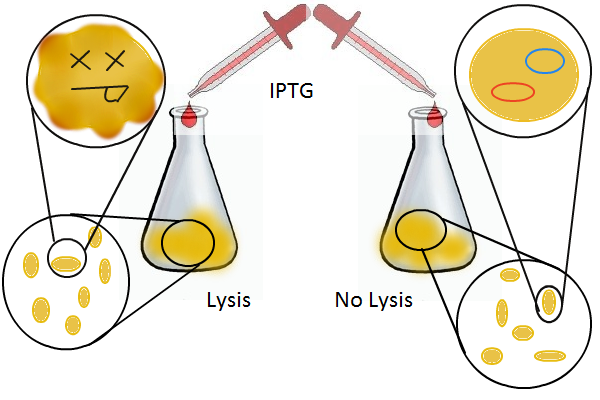
We grow two large cultures of cells. One contains cells that will lyse and release plasmids into the supernatant while the other has non-lysing cells containing a control (empty) plasmid. Adding IPTG to both flasks induces lysis in one set of cells but not in the others. If you would like to find out more about how IPTG induction experiments work, please click here.
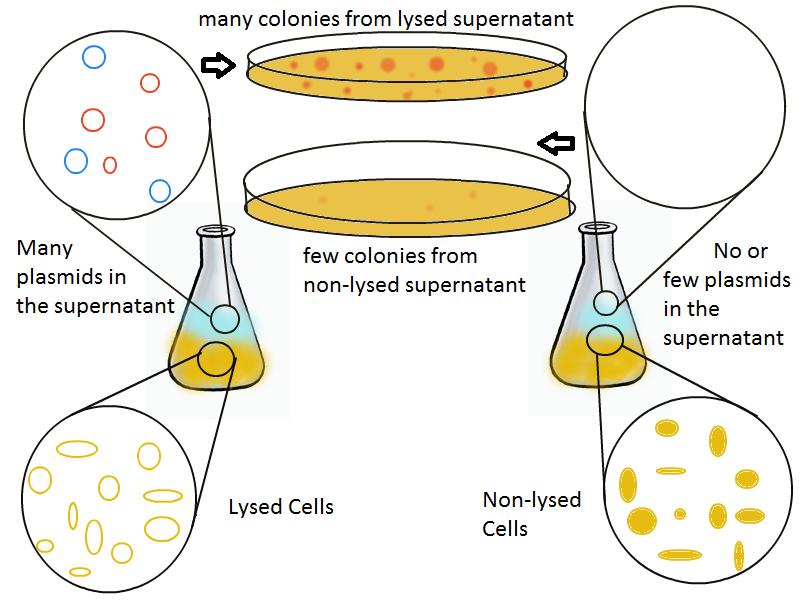
Once lysis has been induced, we harvest the supernatant every hour, centrifuge it, and sterile filter it in order to remove cell debris. With this purified supernatant, we proceed to two different methods for calculating the amount of DNA that was collected. One method uses the qPCR to amplify a particular sequence of DNA in the desired plasmid (in our case an RFP-containing plasmid). Depending on the cycle in which the qPCR first detects a PCR product, we can determine the plasmid concentration in the supernatant. The other method involves transforming the supernatant into competent cells and counting the number of resulting colonies. The colony count alongside the qPCR data gives a good understanding of how much DNA could be recovered from the supernatant.
Results
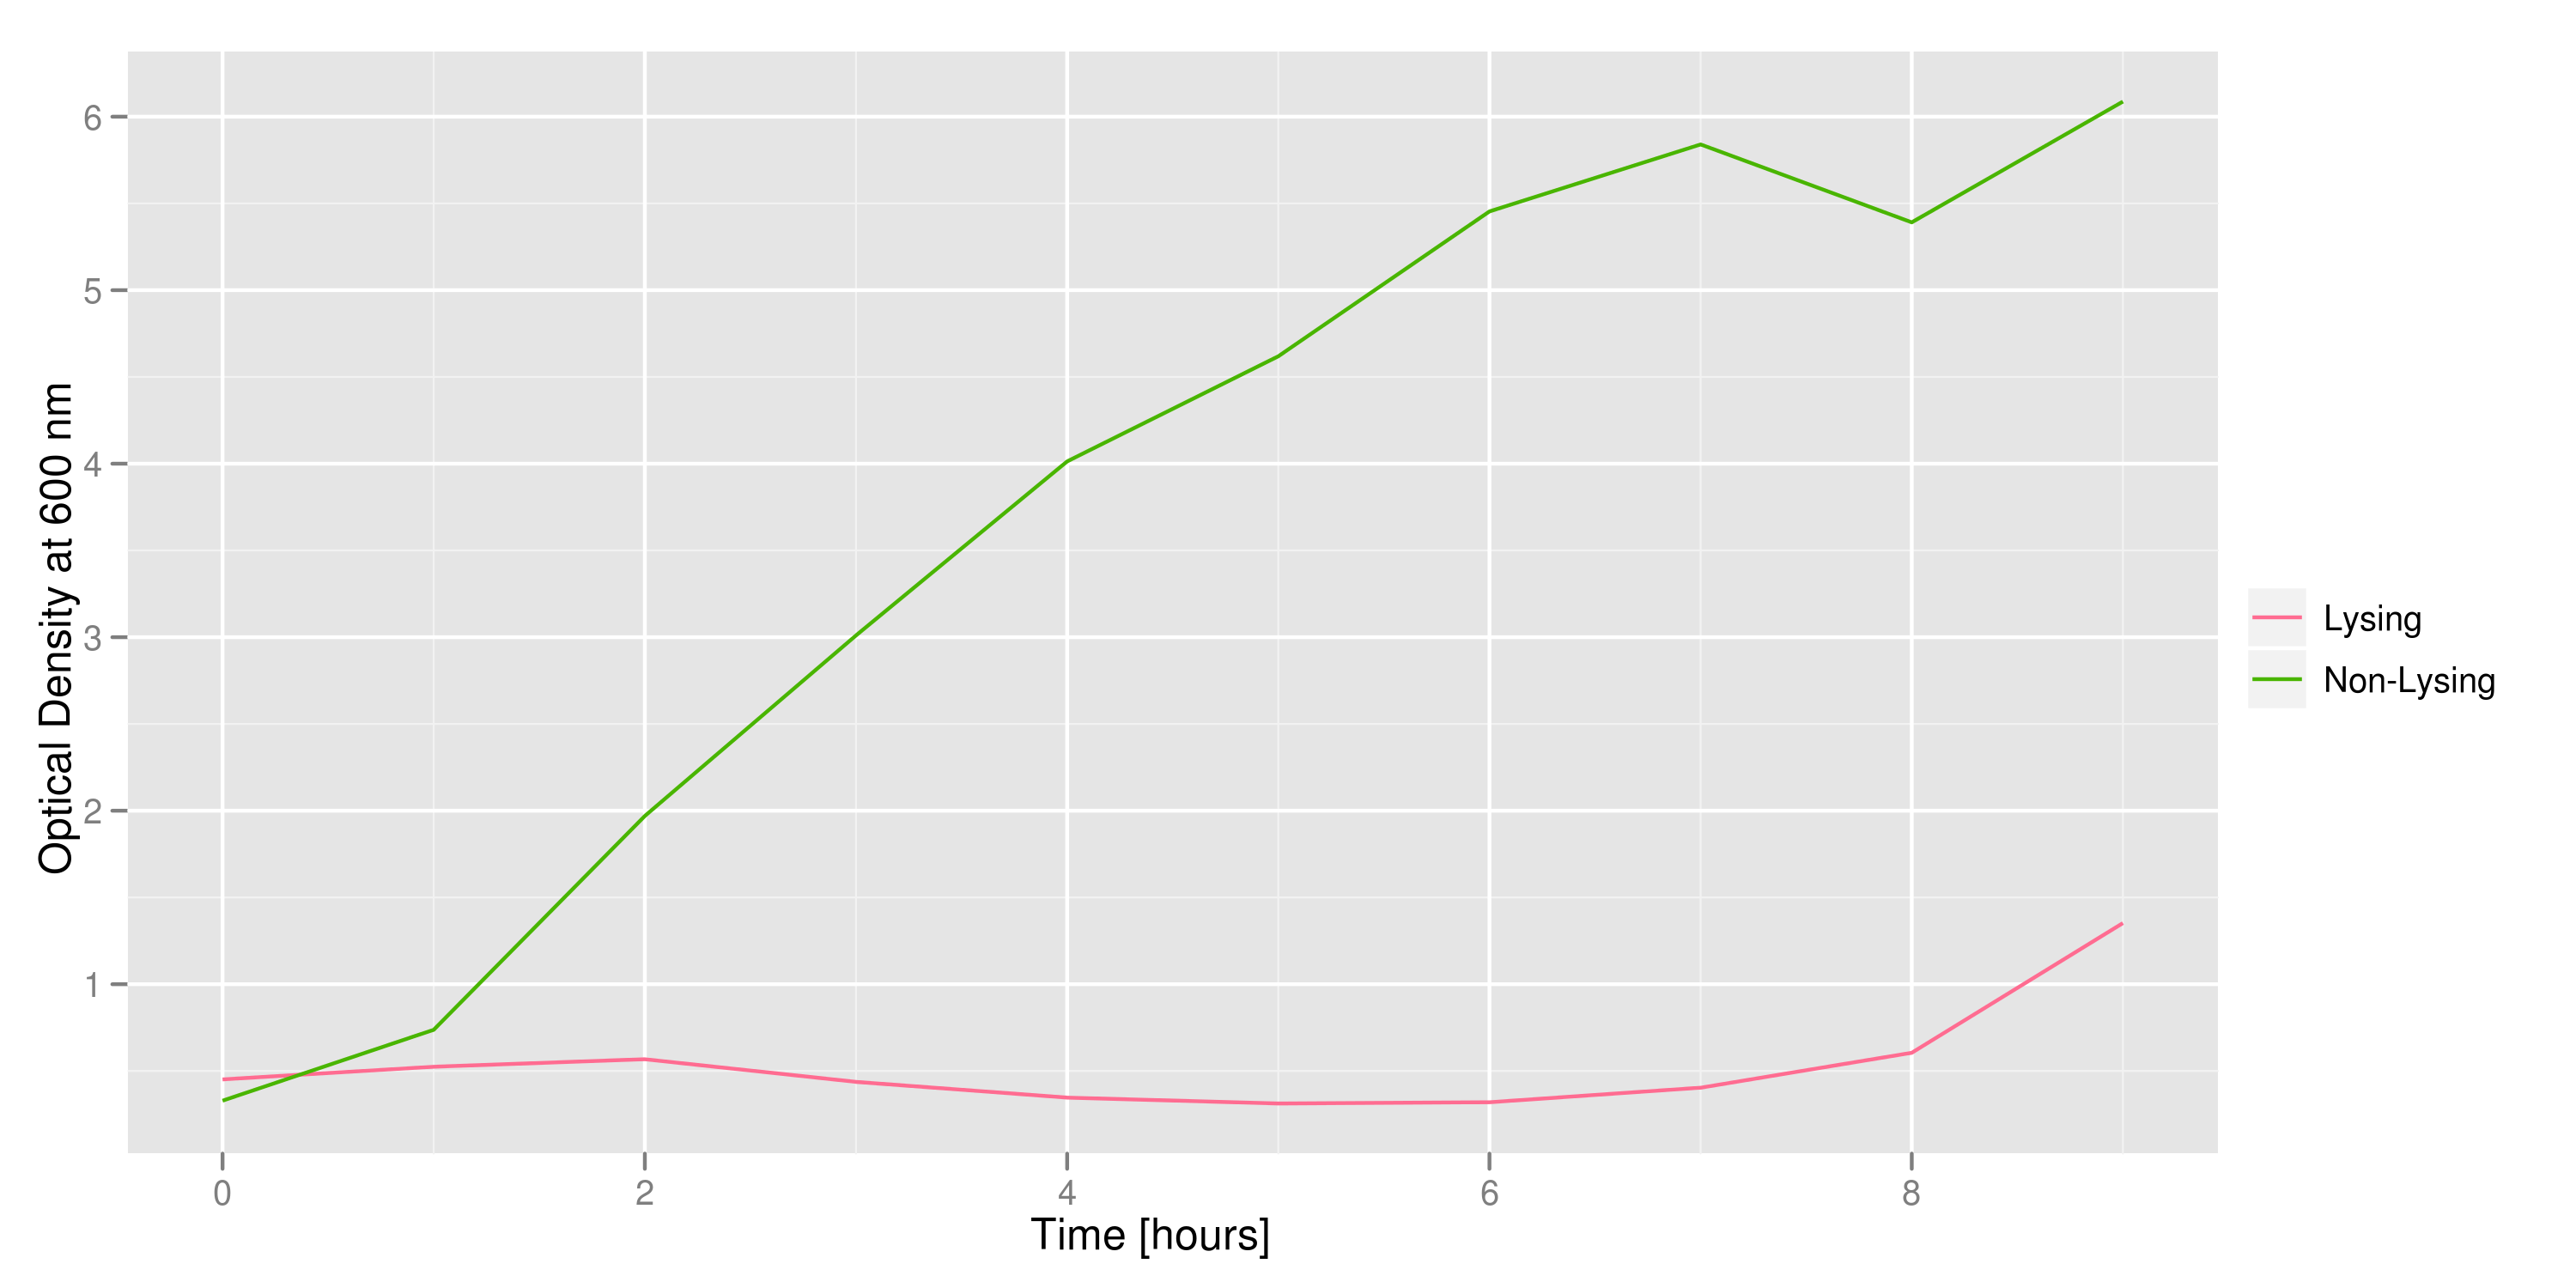
Optical density measurements were made every hour for 12 hours. The non-lysing cell culture grew as expected into a cloudy mix of cells, while the lysing cell culture showed ever-decreasing optical density. This graph confirms that lysis was indeed taking place.
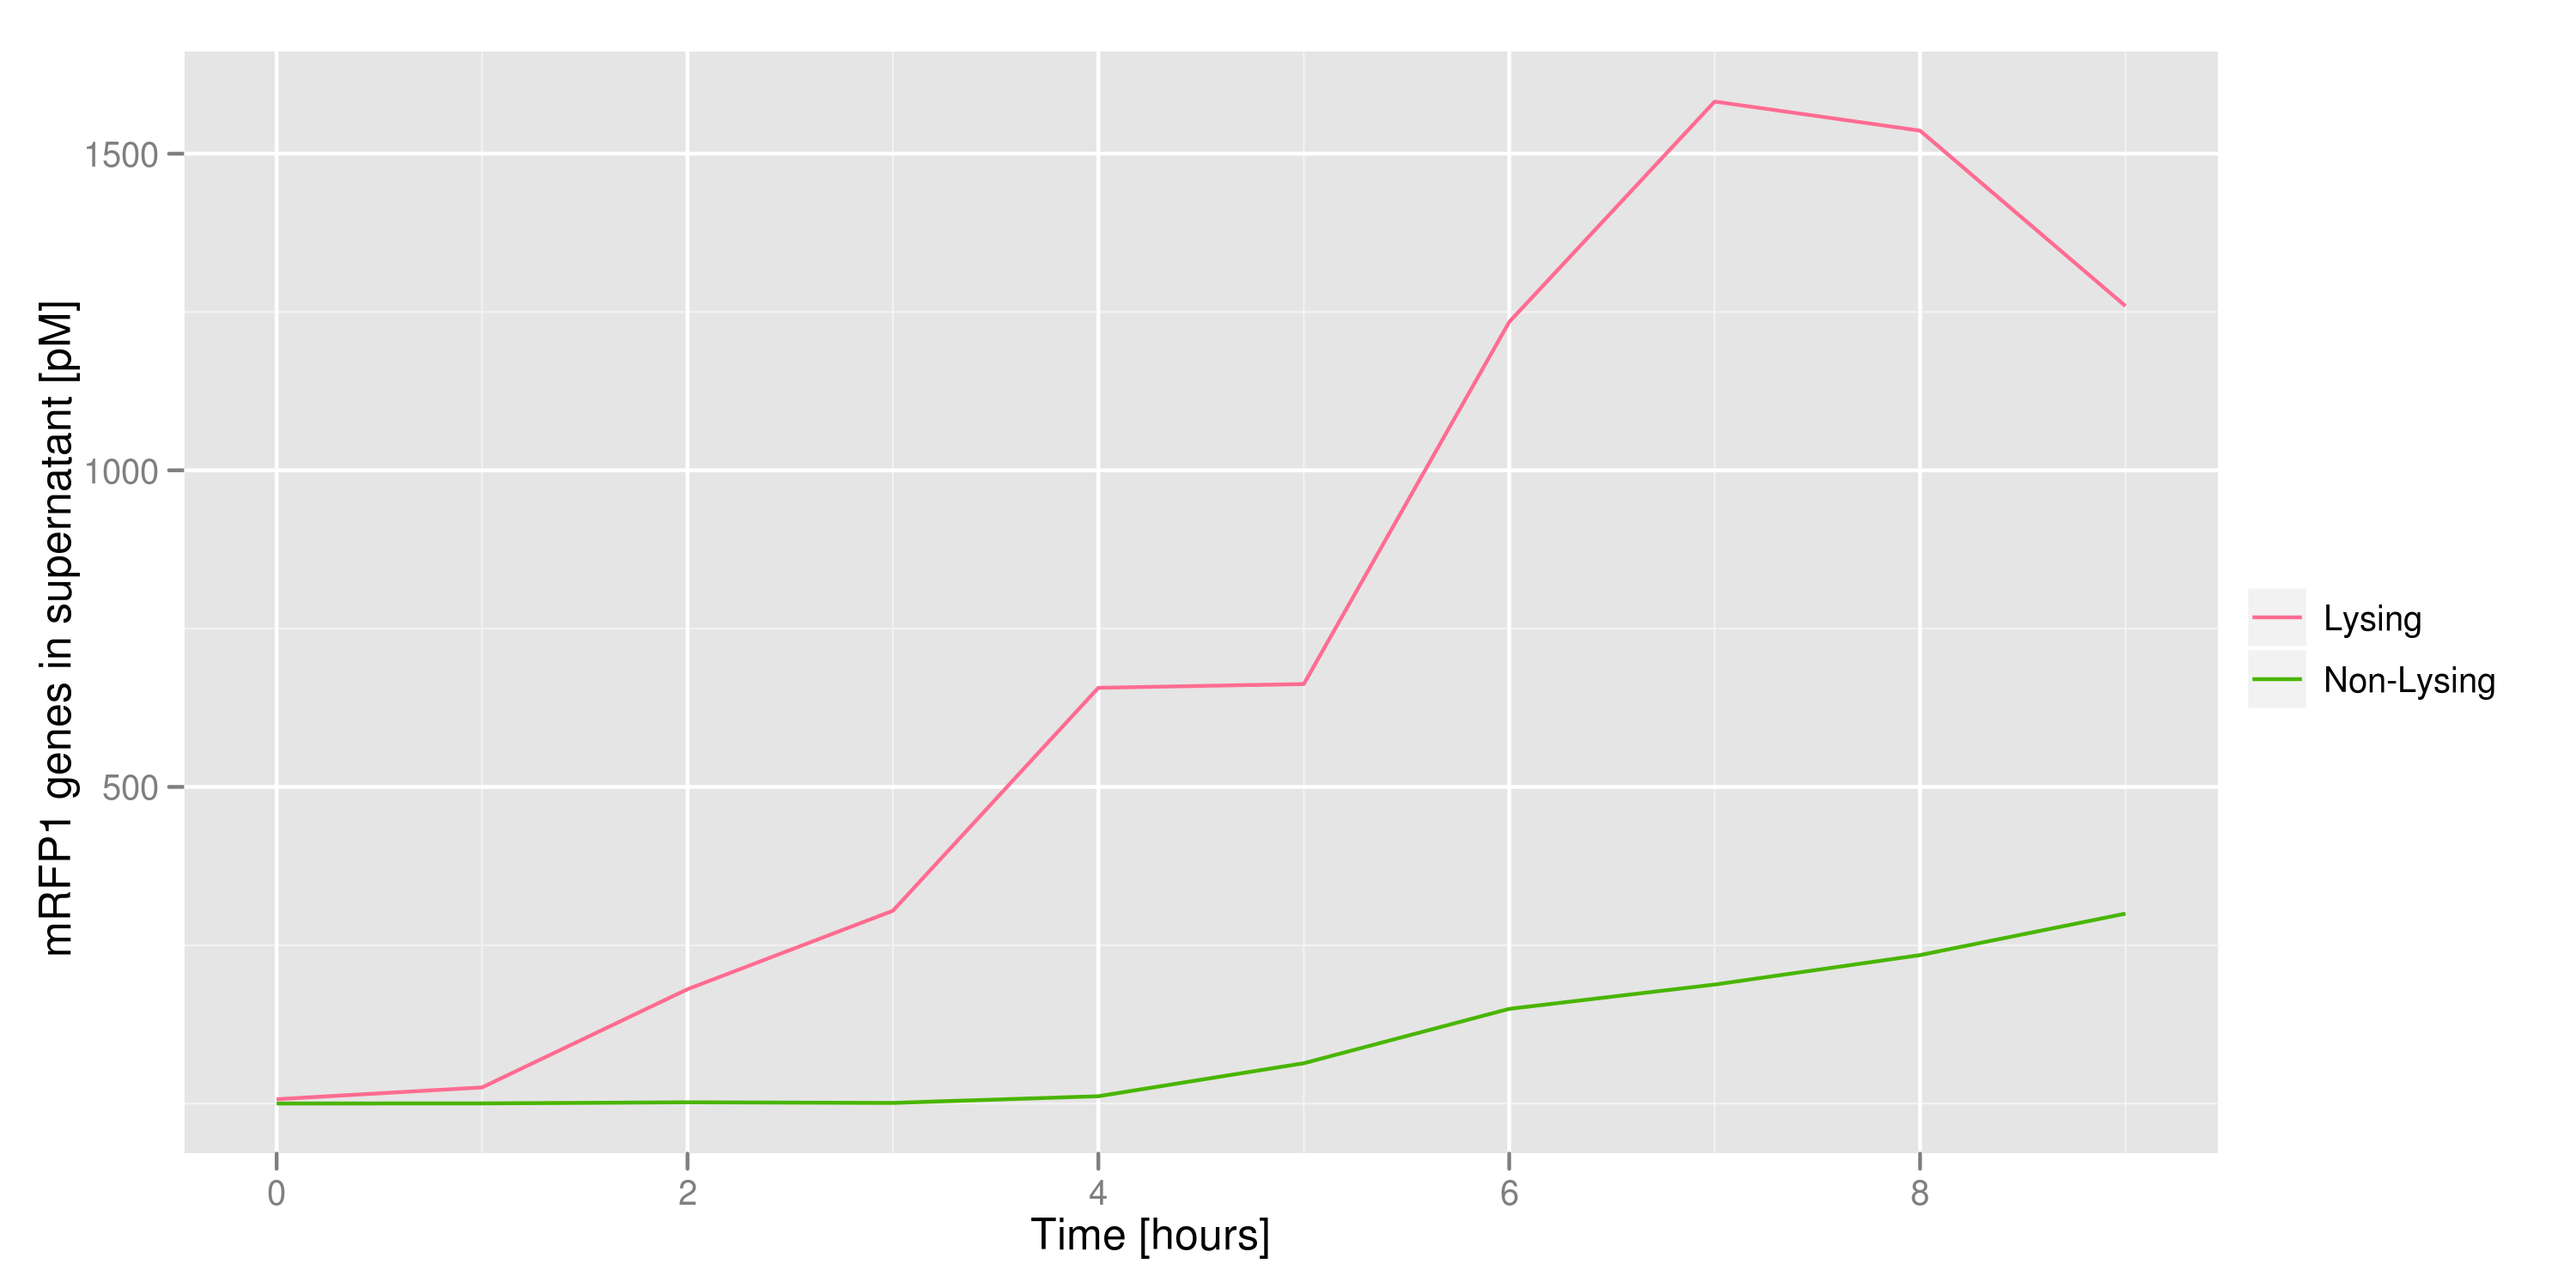
This chart shows the concentration of mRFP genes in the supernatant for each culture as the result of a qPCR. Both cultures contained cells with RFP plasmids. The lysing culture shows a definite increase in the number of mRFP plasmids in the supernatant over the course of the 10 hour experiment. The non-lysing culture shows a quasi-constant number of plasmids available in the supernatant. We can conclude that the DNA from the relevant lysed cells can be recovered from the supernatant.
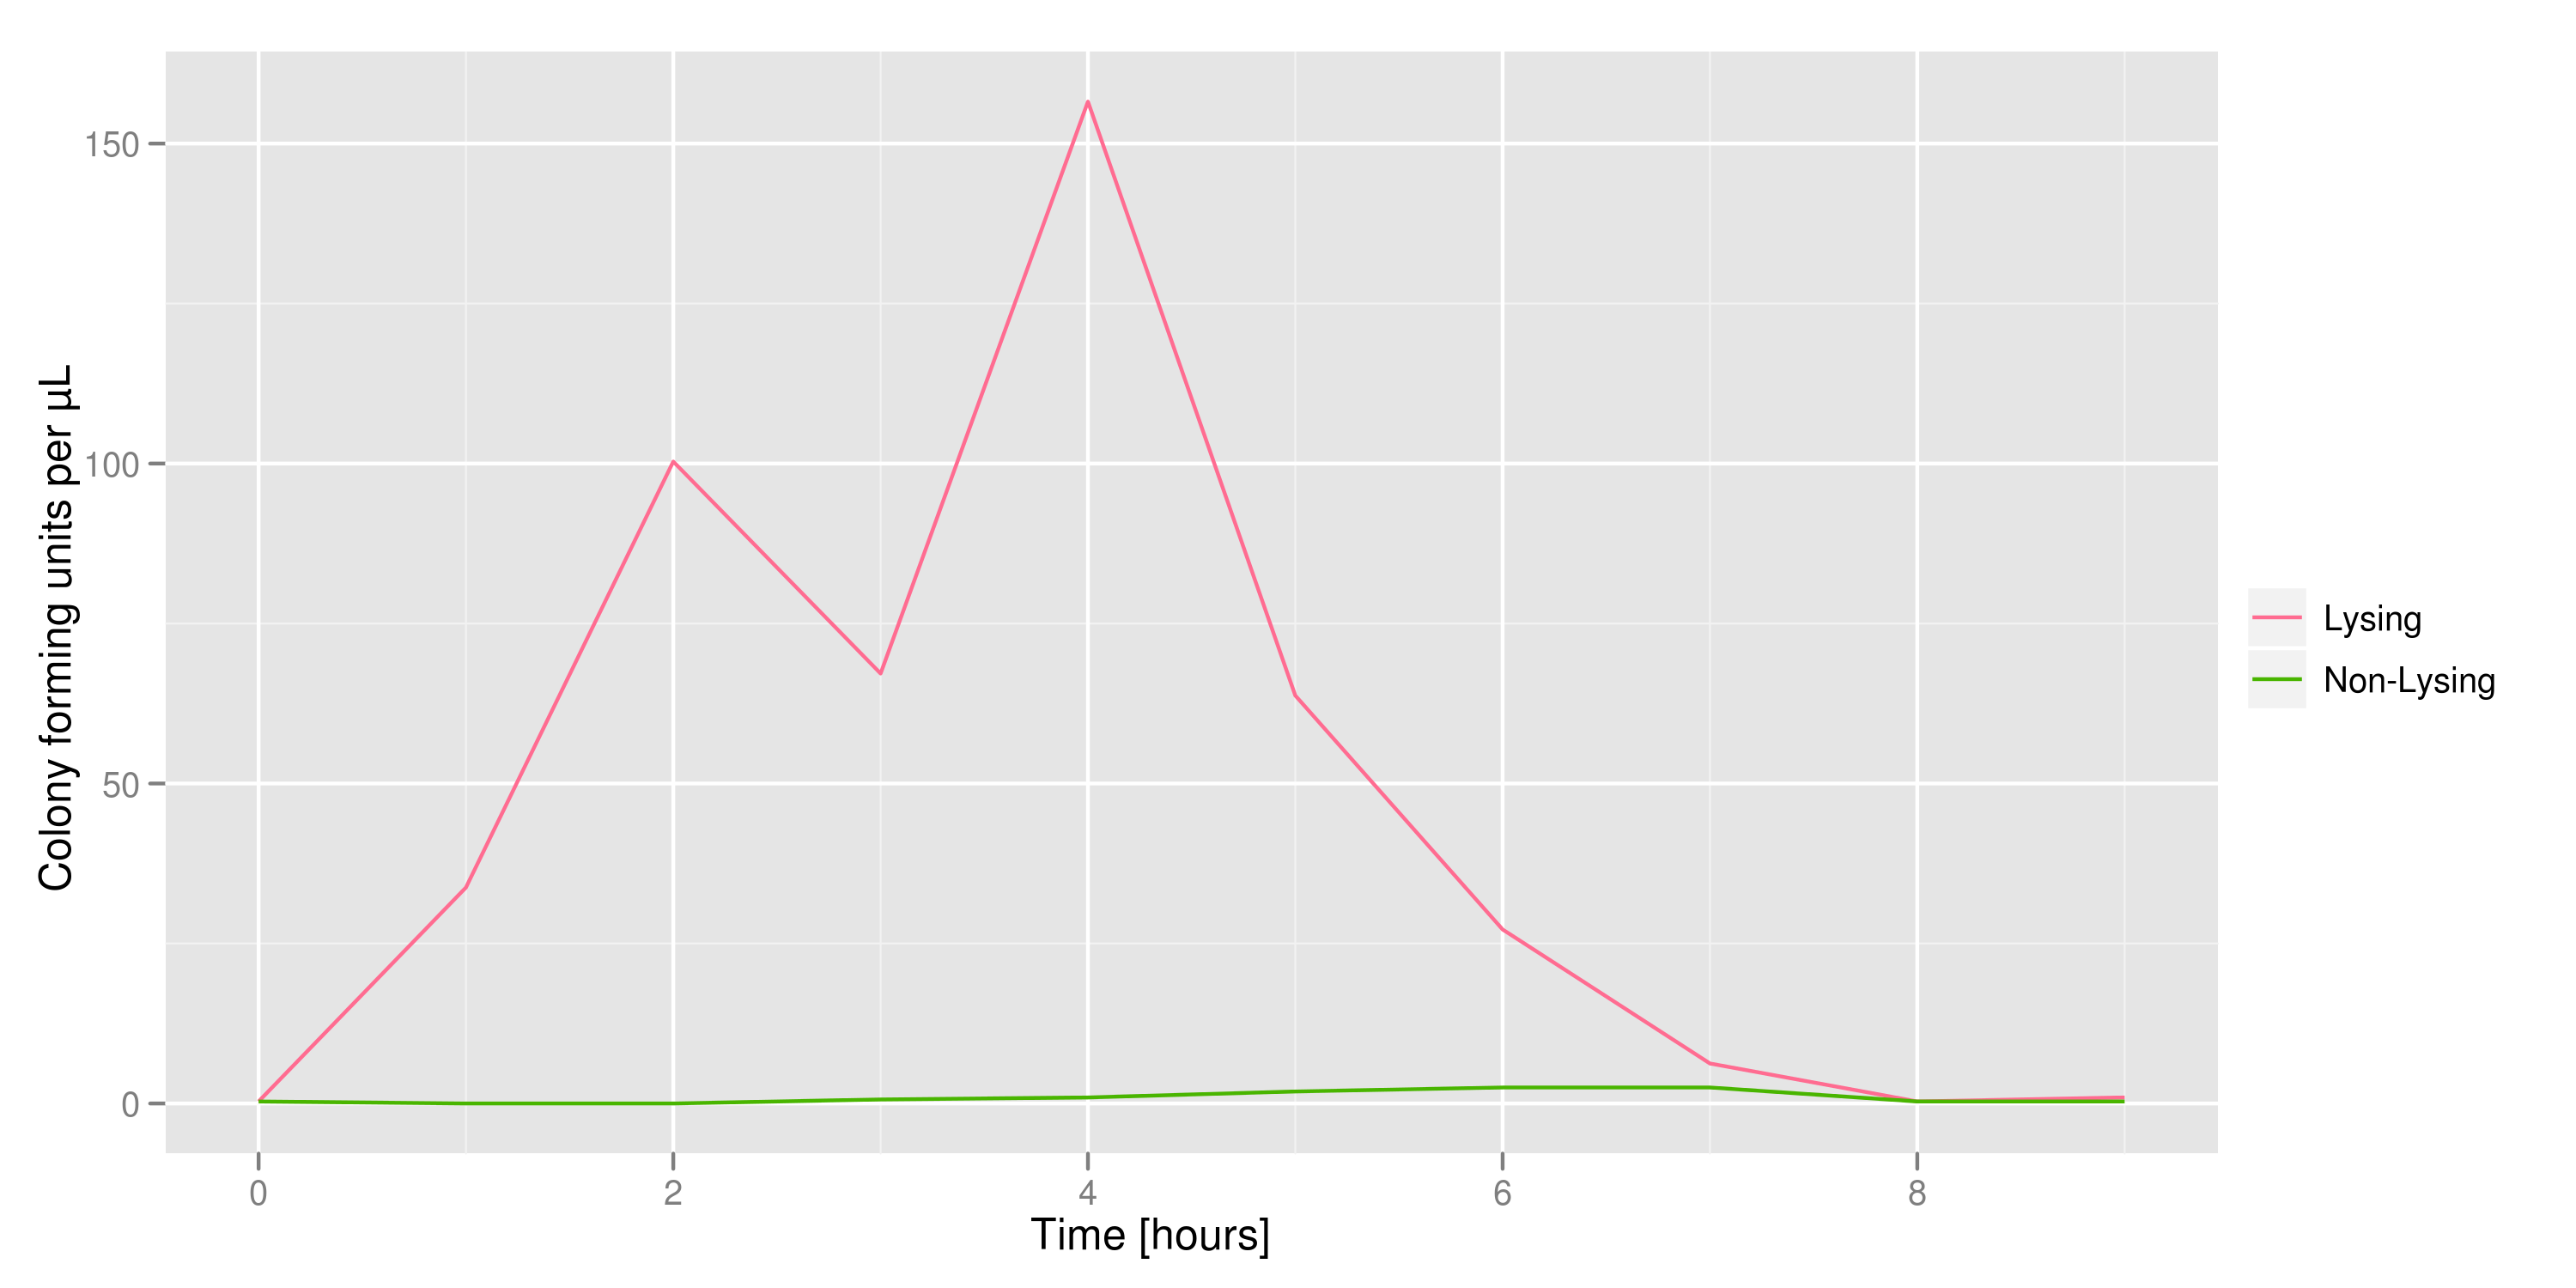
The colony fluorescence, the second method for quantifying the amount of recovered DNA, relates the number of colonies to the amount of transformant (in uL) that was plated. We find that the number of colonies taken from the lysing culture (all pink because of RFP) increases dramatically over time, while the number of colonies from the non-lysing culture is near-zero over the 10 hours of the experiment. This result is an additional confirmation that DNA was recovered.
 "
"
