Team:Groningen/project characterisation mu
From 2011.igem.org
| Line 76: | Line 76: | ||
| || no-tag|| LAA || LVA | | || no-tag|| LAA || LVA | ||
|- | |- | ||
| - | | RBS 0,07 | + | | RBS 0,07 || <gallery>File:ci7ui2.png | </gallery> || <gallery>File:ci12ui2.png | </gallery> || <gallery>File:ci8ui2.png | </gallery> |
| - | | <gallery>File:ci7ui2.png | </gallery> | + | |
| - | | <gallery>File:ci12ui2.png | </gallery> | + | |
| - | | <gallery>File:ci8ui2.png | </gallery> | + | |
|- | |- | ||
| RBS 0,3 || <gallery>File:ci5ui2.png</gallery> || <gallery>File:ci11ui2.png</gallery> || <gallery>File:ci6ui2.png</gallery> | | RBS 0,3 || <gallery>File:ci5ui2.png</gallery> || <gallery>File:ci11ui2.png</gallery> || <gallery>File:ci6ui2.png</gallery> | ||
Revision as of 23:59, 20 September 2011
Memory Units
cI Autoinducing Loops
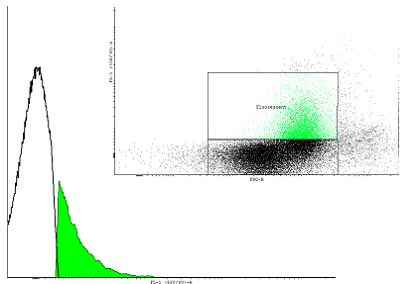
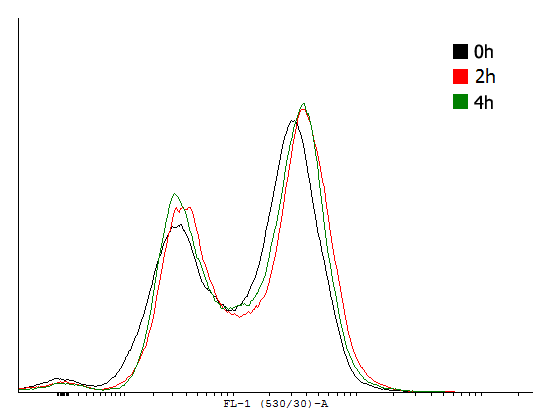
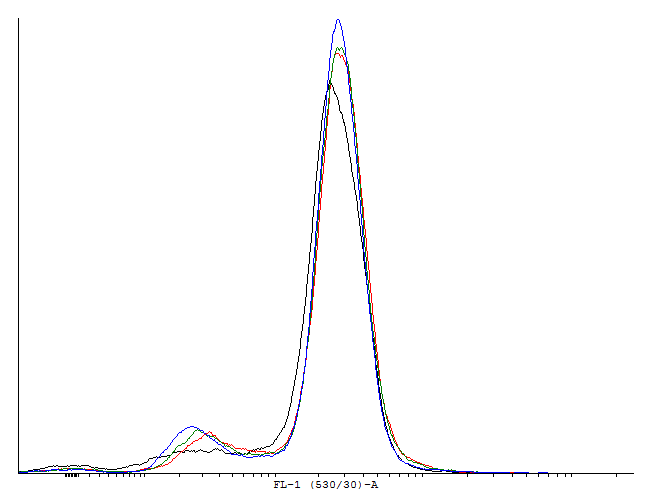
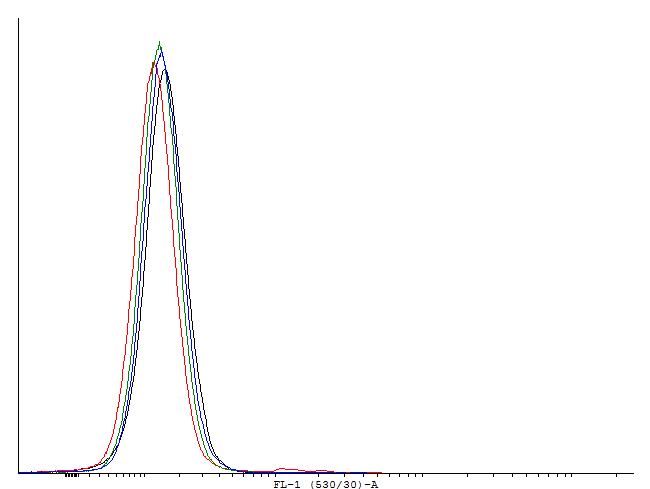
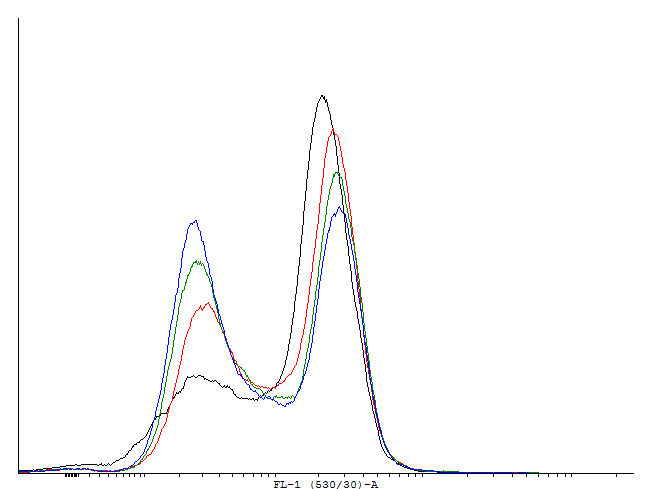
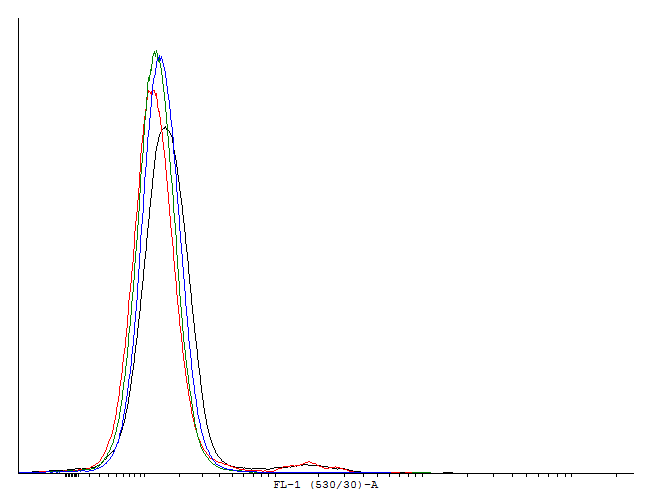
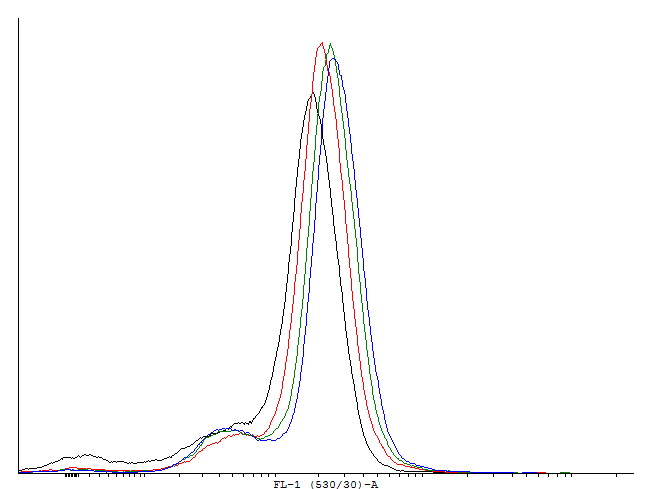
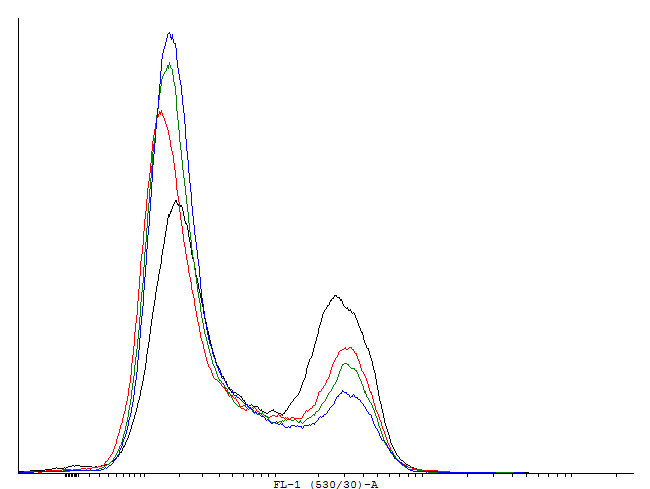
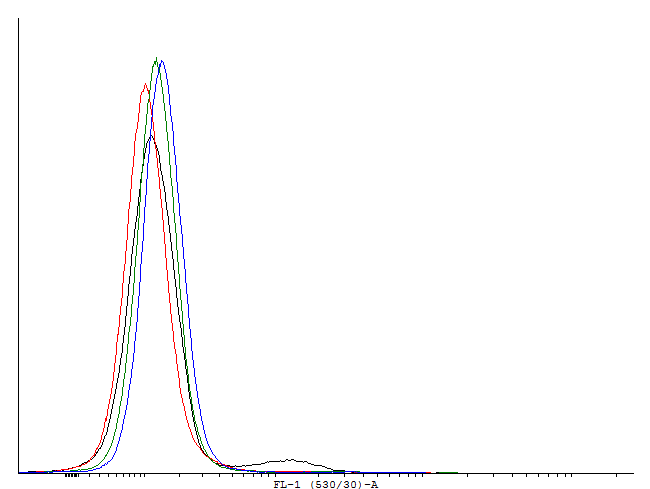
The autoinducing loop driven by cI will function as our first memory unit. We aimed to find a combination of RBS, transcription factor and degradation tag that enables us to toggle between the two steady states in a robust way. To estimate the rate in which single cells are activated by too much leakage of cI protein we measured the fluorescence in uninduced cells with a flow cytometer. To measure the activation we used a construct with the PRM promoter producing GFP with an LVA tag to make dynamic measurement possible.
| cI autoinducing loop 6 (BBa_K00) after 4 hours of incubation | |||||||||||||||||
|---|---|---|---|---|---|---|---|---|---|---|---|---|---|---|---|---|---|
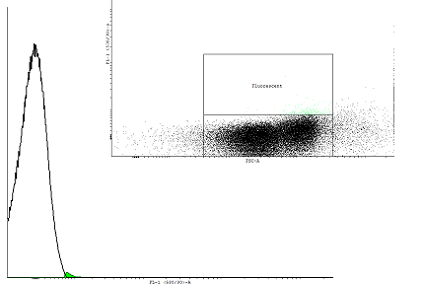
Figure 2. A dotblot of uninduced cells carrying the pSB1K3 plasmid with the biobrick BBa_ and the plasmid pSB1A3 with as well an input(PBAD controlling cI) as well as the output (PRM controlling GFP-LVA). |
| ||||||||||||||||
| Only one population is visible on the dotblot. The histogram was obtained in the same fashion as in figure 1 to show that there are cultures with activated cI loops and cultures without. | |||||||||||||||||
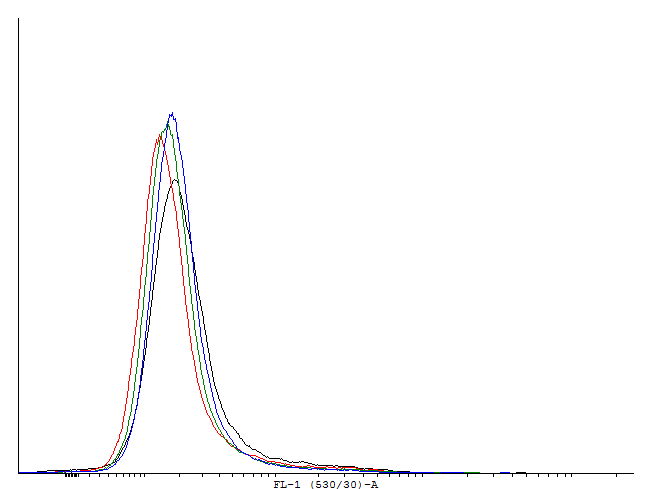
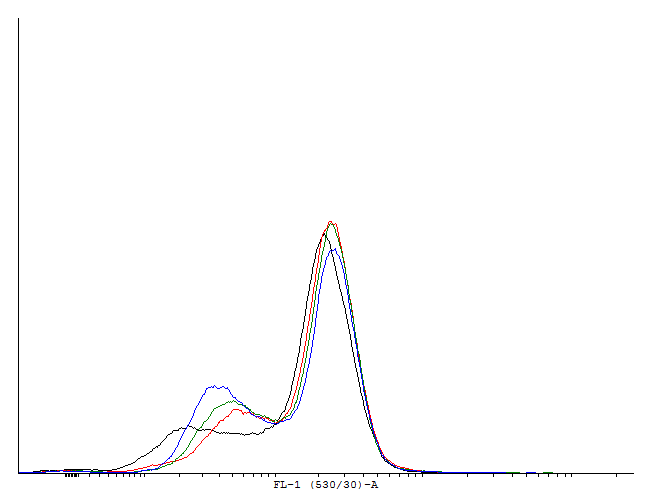
These measurements indicate activation and by this bimodal behaviour of cells containig BBa_. But no activation of BBa_ and several other constructs. In these measurements we used GFP-LVA. The degradation seems to be about as fast as the production so only faint signals are visible. We decided to repeat the measurement with similar constructs but with GFP instead of GFP-LVA as an output.
| no-tag | LAA | LVA | ||||
| RBS 0,07 | |
| | |||
| RBS 0,3 | | | | |||
| RBS 0,6 |
| | | |||
| RBS 1 | | | |
 "
"


