Team:Edinburgh/Cellulases (C model)
From 2011.igem.org
(→Discussion) |
(→Syn: a simple demonstration of synergy) |
||
| Line 29: | Line 29: | ||
* Cellulose is modelled as horizontal chains with alternating sugars and bonds: ''s-b-s-b-s-b-s-b-s-b-s'', etc. | * Cellulose is modelled as horizontal chains with alternating sugars and bonds: ''s-b-s-b-s-b-s-b-s-b-s'', etc. | ||
* There are three enzyme types: '''endoglucanase''', '''exoglucanase''', and '''β-glucosidase'''. | * There are three enzyme types: '''endoglucanase''', '''exoglucanase''', and '''β-glucosidase'''. | ||
| - | ** The enzymes move about randomly | + | ** The enzymes move about randomly in <span class="hardword" id="brownian">brownian motion</span>. |
** If an enzyme is in the same place as a bond, it can destroy it: | ** If an enzyme is in the same place as a bond, it can destroy it: | ||
*** Endoglucanase can only cut bonds away from the ends of a chain. | *** Endoglucanase can only cut bonds away from the ends of a chain. | ||
Revision as of 14:09, 9 September 2011
Cellulases (C model)
As explained in the abstract, the feasibility of our improved biorefineries depends on exploiting synergy between enzymes. Therefore, we attempted to use the C programming language to construct a model which could prove that synergy is, or might be, a real phenomenon affecting cellulase action.
Contents |
Synergy explained
It can seem almost magical that having enzymes closer together can increase their usefulness, but consider the following statements about cellulose degradation, all of which are true ([http://www.annualreviews.org/doi/abs/10.1146/annurev-biochem-091208-085603 Fontes and Gilbert, 2010]):
- Exoglucanase chews away at the end of a cellulose chain, producing cellobiose sugars.
- Endoglucanase cuts cellulose chains in the middle, essentially turning one chain into two.
- Cellobiose inhibits the action of the above enzymes.
- β-glucosidase cuts cellobiose in half, producing two glucose molecules.
Facts 1 and 2 mean that exoglucanase works best with endoglucanase nearby, since every time endoglucanase acts, it produces new chain-ends for exoglucanase to attack. Meanwhile, facts 1, 3, and 4 mean that β-glucosidase helps nearby copies of the other enzymes by preventing the cellobiose from inhibiting them.
Syn: a simple demonstration of synergy
We can demonstrate that there is (potentially) a huge difference between the synergistic and non-synergistic systems with Edinburgh's Syn program, written in C. This is a 2D simulation that works in the following way:
- The world is a 2D grid.
- Each spot in the grid can contain a sugar, a bond between sugars, or nothing.
- The world begins with an array of cellulose.
- Cellulose is modelled as horizontal chains with alternating sugars and bonds: s-b-s-b-s-b-s-b-s-b-s, etc.
- There are three enzyme types: endoglucanase, exoglucanase, and β-glucosidase.
- The enzymes move about randomly in brownian motion.
- If an enzyme is in the same place as a bond, it can destroy it:
- Endoglucanase can only cut bonds away from the ends of a chain.
- Exoglucanase can only cut bonds if this results in a cellobiose molecule (s-b-s) forming.
- β-glucosidase can only cut cellobiose bonds.
- There is inhibition of exoglucanase by cellobiose; it does not cut bonds (or has a reduced chance to do so) if there is a nearby cellobiose molecule.
The actions of the enzymes are as follows:
Simulating non-synergy vs. synergy
We can run two different simulations with the same settings. However, in one simulation the enzymes float about freely, whereas in the other they travel in triplets, each triplet containing one of each type of enzyme, side by side:
So, what happens if we run a large simulation? This:
Animation
You can view an animation of a similar run to the above, here.
Warning: 1.5 MB file, has been known to hang certain browsers...
Discussion
This model is not intended as an accurate reflection of reality, but rather a simple demonstration that synergy works. The actual results seen depend heavily on the parameters passed to the program as command-line arguments. Among the relevant settings are the number of enzymes, the size of the cellulose array, and the strength of cellobiose inhibition.
Baseline results
Some standard settings are used for parameters the user does not otherwise specify. These standard settings are fairly arbitrary, but they provide baseline results; we can then provide other parameters and see what difference they make.
We carried out 100 runs of the program with standard settings (20 of each enzyme per side, width and height 155, full inhibition of exoglucanase by nearby cellobiose, endoglucanase requiring at least 5 sugars on each side of a bond to cut it).
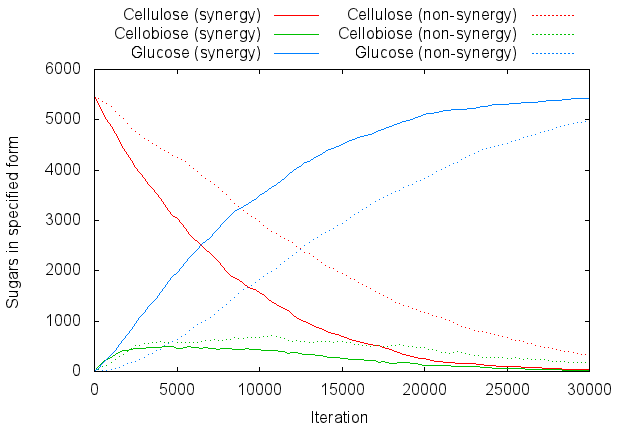
On average, it took the synergistic system 7522 iterations to liberate half the sugar (i.e. turn it into glucose monosaccharides), as opposed to 13878 for the non-synergistic system.
We can graph the progress of a typical run by counting the number of sugars present:
- As free glucose molecules, not bonded to anything.
- As one half of a cellobiose molecule.
- As part of a longer chain (cellulose).
For graphing purposes let us define cellulose as any chain with three or more sugars bonded together (meaning s-b-s-b-s is the smallest chain that counts as "cellulose"). Figure 4 is a graph of the number of sugar molecules present in each form:
Effect of increased enzyme concentration
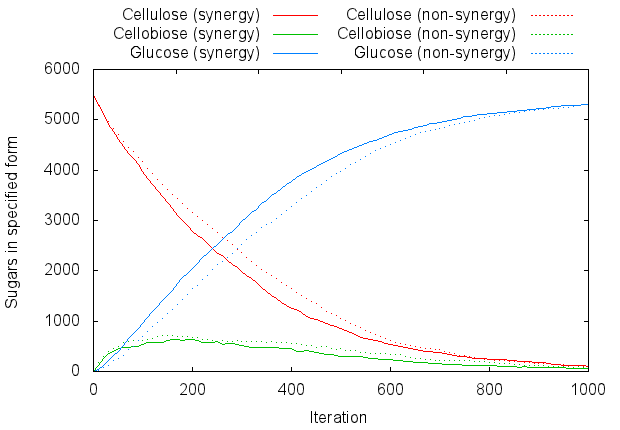
One obvious thing to try is increasing the enzyme concentration. Obviously, this will decrease the time taken to degrade the cellulose. But it also has a more subtle effect: since the enzymes are at higher density, they are automatically close to each other. Therefore the difference between the free-floating enzyme model and the synergistic model is less.
This is illustrated by Figure 5, which uses 500 enzymes of each type, instead of 20:
Effect of (no) cellobiose inhibition
Under standard settings, exoglucanase is completely inhibited if there is a nearby cellobiose model. This reflects the real-world fact that enzymes are generally inhibited by their own products.
We can disregard this assumption and see what happens (Figure 6). Since exoglucanase now works at higher efficiency, the amount of cellobiose that builds up is greater, but the time taken to degrade the cellulose is less. And since exoglucanase is no longer assisted by β-glucosidase, the value of synergy is less:
Conclusion
Synergy - it actually makes sense!
Despite the simplicity of the model, it showed broadly similar results to the more complex Kappa model.
Downloads
- Source code:
- Windows executable:
There are two ways to compile the code. The first is to just compile the C file as it stands, using a command like "gcc syn.c". When compiled in this way, there is no graphical display, except that the program saves .bmp graphics files every so often.
However, if you have the SDL graphics library development files (called libsdl1.2-dev in Ubuntu), you can optionally download the Makefile and compile with "make". This version does not (by default) spit out any files; instead, it gives a graphical display of the action as it occurs.
Note that, to work, the Makefile should be called "Makefile" and the C file should be called "syn.c".
Command-line options
The following command-line options should work. Default values are shown where applicable. (The default endpoint and bmptick depend on whether SDL support is compiled in.)
Simulation settings
- --seed x — use specified random seed (results may still differ across platforms)
- --halfwidth 155 — width of each simulation
- --height 155 — height of the simulations
- --margin 4 — size of the margin (region of no cellulose)
- --enzymes 20 — number of enzymes of each type per simulation
- --endpoint x — how many iterations to run (0 for unlimited)
- --bioseinhibleft 1.0 — strength of cellobiose inhibition of exoglucanase (left simulation), from 0 to 1
- --bioseinhibright 1.0 — strength of cellobiose inhibition of exoglucanase (right simulation), from 0 to 1
- --endoreqleft 5 — how close to the end of a chain endoglucanase can cut (left simulation)
- --endoreqright 5 — how close to the end of a chain endoglucanase can cut (right simulation)
- --nosyn — do not use synergy on either side
- --bothsyn — use synergy on both sides
Display and reporting
- --bmptick x — how often to spit out .bmp graphics files (0 for never)
- --bmpmag 1 — magnification of .bmp files
- --sdltick 1 — how often to draw to the SDL window (1 to draw every frame)
- --sdlmag 2 — magnification of SDL window
- --delay 20 — milliseconds to delay after drawing to SDL window; some machines require this
- --reporttick 250 — how often to print count of glucose and cellobiose to the console (0 for never)
References
- Fontes CMGA, Gilbert HJ (2010) [http://www.annualreviews.org/doi/abs/10.1146/annurev-biochem-091208-085603 Cellulosomes: highly efficient nanomachines designed to deconstruct plant cell wall complex carbohydrates]. Annual Review of Biochemistry 79: 655-81 (doi: 10.1146/annurev-biochem-091208-085603).
 "
"


