Team:Edinburgh/Phage Replication
From 2011.igem.org
(Difference between revisions)
| Line 46: | Line 46: | ||
The [[:File:Matlab_code_phagerep.txt | MATLAB code]] uses a <span class="hardword" id="rk">Runge-Kutta method</span> of order four to solve the system. | The [[:File:Matlab_code_phagerep.txt | MATLAB code]] uses a <span class="hardword" id="rk">Runge-Kutta method</span> of order four to solve the system. | ||
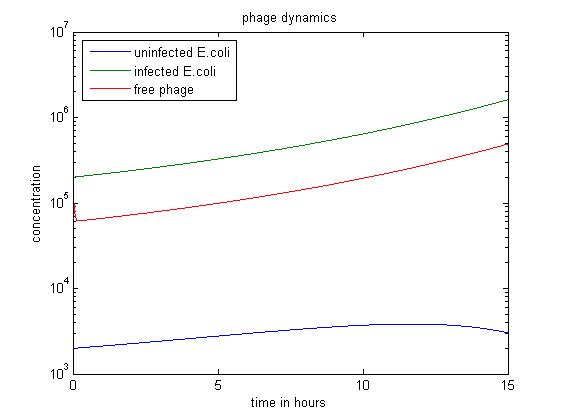
| - | [[File:Phage | + | [[File:Phage dyn.jpg|center|thumb|700px|caption|simulation value:x0=y0=v0=2.00E5]] |
The above figure shows a simulation going over 15 hours. | The above figure shows a simulation going over 15 hours. | ||
Revision as of 15:43, 6 September 2011
Phage Replication
A basic activity in biorefinery consists of the degradation of cellulose, due to the presence of enzymes. We are not only concerned with the activities and the amount of enzymes, but also with metabolism and activities of bacteriophage.
Contents |
M13 Replication
- The M13 phage attacks E. coli (host), multiplies in the host cell cytoplasm, and is released without causing the bacteria’s death (non-lytic).
Basic model
- dx/dt=ax-bvx
- (Rate of change of quantity of uninfected E. coli equals to the uninfected E. coli replicate itself minus the E. coli infected by M13 phage.)
- dy/dt=ay+bvx
- (Rate of change of quantity of infected E. coli equals to the quantity of infected E. coli replicate itself plus the E. coli infected by M13 phage.)
- dv/dt=cy-bvx-mv
- (Rate of change of quantity of free phage equals to the phage released by infected E. coli minus the phage which is to infect an E. coli and the decayed phage.)
- X(t) — uninfected E. coli
- Y(t) — infected E. coli
- V(t) — free phage
- a — replication coefficient of E. coli
- b — transmission coefficient of phage
- c — replication coefficient of phage
- m — decay rate of phage
Assumptions
- infected and uninfected bacteria reproduce at the same rate
Simulations
The MATLAB code uses a Runge-Kutta method of order four to solve the system.
The above figure shows a simulation going over 15 hours. The simulation shows the infected E. coli population dominates. And the phage population decreases at first then increases.
References
- Slonczewski JL, Foster JW (2010) [http://www.wwnorton.com/college/biology/microbiology2/ch/11/etopics.aspx Microbiology: An Evolving Science], 2nd edition. W. W. Norton & Company
- Robert J.H Payne, Vincent A. A. Jansen(2011)[ http://personal.rhul.ac.uk/ujba/115/jtb01.pdf: Understanding Bacteriaphage therapy as a density-dependent kinetic process]
- Cattoen C (2003) [http://msor.victoria.ac.nz/twiki/pub/Groups/GravityGroup/PreviousProjectsInAppliedMathematics/bacteria-phage_REPORT.pdf: Bacteriaphage mathematical model applied to the cheese industry]
 "
"

