Team:NTNU Trondheim/Flow-Cytometry
From 2011.igem.org

Flow Cytometry
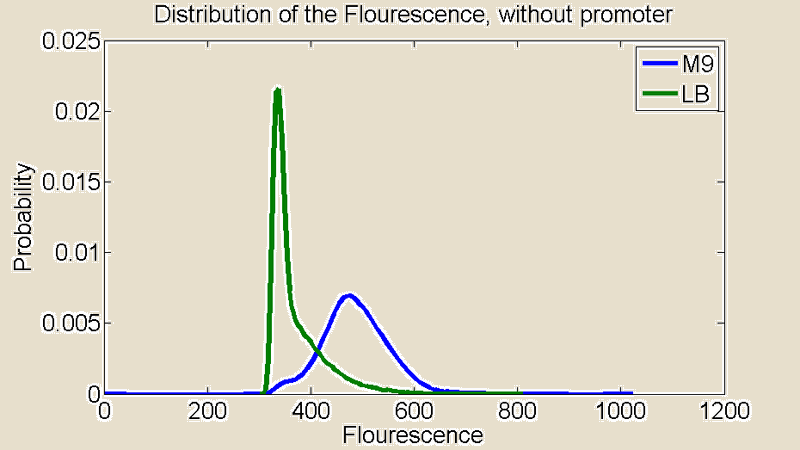
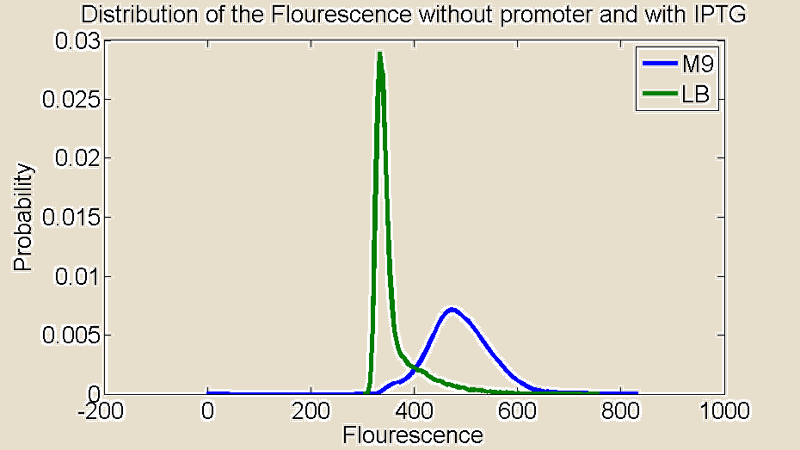
Several measurements were performed using a Flow Cytometer, this allowed us to measure the flouresence from single cells. The resulting plots shows the distributions of the flouresence for the red end of the spectrum (i.e around the wavelength corresponding to mCherry).
First of all there is a remarkable difference between the distributions for M9 and LB. The distribution for M9 is relatively sharp compared to LB which means there is little difference in the level of light a emitted from the individual cells. The distribution for LB is much broader showing a greater variance and it is also shifted to the right.
 "
"


