The production of AiiA and LuxI depend on the internal AHL concentration in the single cell. The steps (transcription, translation, maturation etc.) from the luxI and aiiA genes to the corresponding proteins are not modeled separately, but the delay of the correlation between the internal AHL concentration and the corresponding AiiA and LuxI is simulated by the following Hill function:
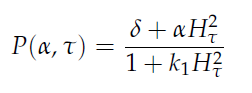
in which tau represents the time step. It can be seen that the function takes the history of the system into account, since the production of the proteins depend on the past concentration of internal AHL as in: 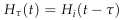 .
.
back to top
Writing a modeling tool in matlab
Fig.2: GUI of the matlab modeling tool created by team Wageningen UR
For the first simulations, the same values for the parameters were used as in the cited paper and can be found in the supplementary information. To get graphs representing optimal oscillations, our team created a script for a matlab modeling tool which uses nested for-loops to vary the flow rate and cell density over a range of values. The resulting tool allows the user to enter the range in which the variables should be varied. The tool then iterates over the values and plots graphs of all combinations possible for that range of values. Figure 2 shows an example output of the tool.
Fig.2: Variation of output graphs depending on the different starting conditions
back to top
Conclusions for our system
The first observation from the model was that, for oscillations to occur, the flow rates may not be too fast, especially at lower cell densities. Since the device used for our system has larger dimensions than the microfluidic device used by Danino et al. the flow rates in the velocities required could not be achieved by varying height differences alone. Further information can be found in the information about the platform used to measure oscillations.
Furthermore, an interesting observation was that applying a flow rate over the cells was not essential to obtain ocillations. Figure 3 shows how, according to the model, oscillations can potentially occur at 0 flow rate. Interesting is that this happens only at high cell densities.
Fig.3: Graphs showing oscillatory behaviour increasing with cell density even when the flow rate is set to 0
Disregarding the strictly mathematical model, some more conclusions were drawn from modeling work as to whether to use a micro-dish or micro-sieve as platform for measuring oscillations. This is described in more detail in the section about the setup of the device.
Expansion of the model for the double tunable oscillatory construct
To accomodate the idea of the double tunable oscillator, the original set of delay differential equations shown above was expanded by two additional differential equations showing the behaviour of the lacI and tetR repressor. The equations for the LuxI and AiiA production were then expanded by a term showing the influence of the corresponding repressor lacI for LuxI and tetR for Aiia respectively. Below the adjusted set of differential equations is shown.
Top: Adjusted set of differential equations for the double tunable oscillator
Since the lacI repressed hybrid promoter used for this system was designed by the Tokyo iGEM 2007 team, the equations were derived according to their model. The tetR repressor was then modeled using the same template.
back to top
 "
"


