Setup
Chosing which platform to use for measuring oscillations
back to top
Controlling the flow rates
The main concern for the setup of the device was to be able to gain control over the flow rate. According to Bernoulli's principle, the velocity of a fluid can be influenced by varying the height of the medium bottle. This approach was also used in the paper cited above. Figure X. shows the corresponding setup and the applying equations.
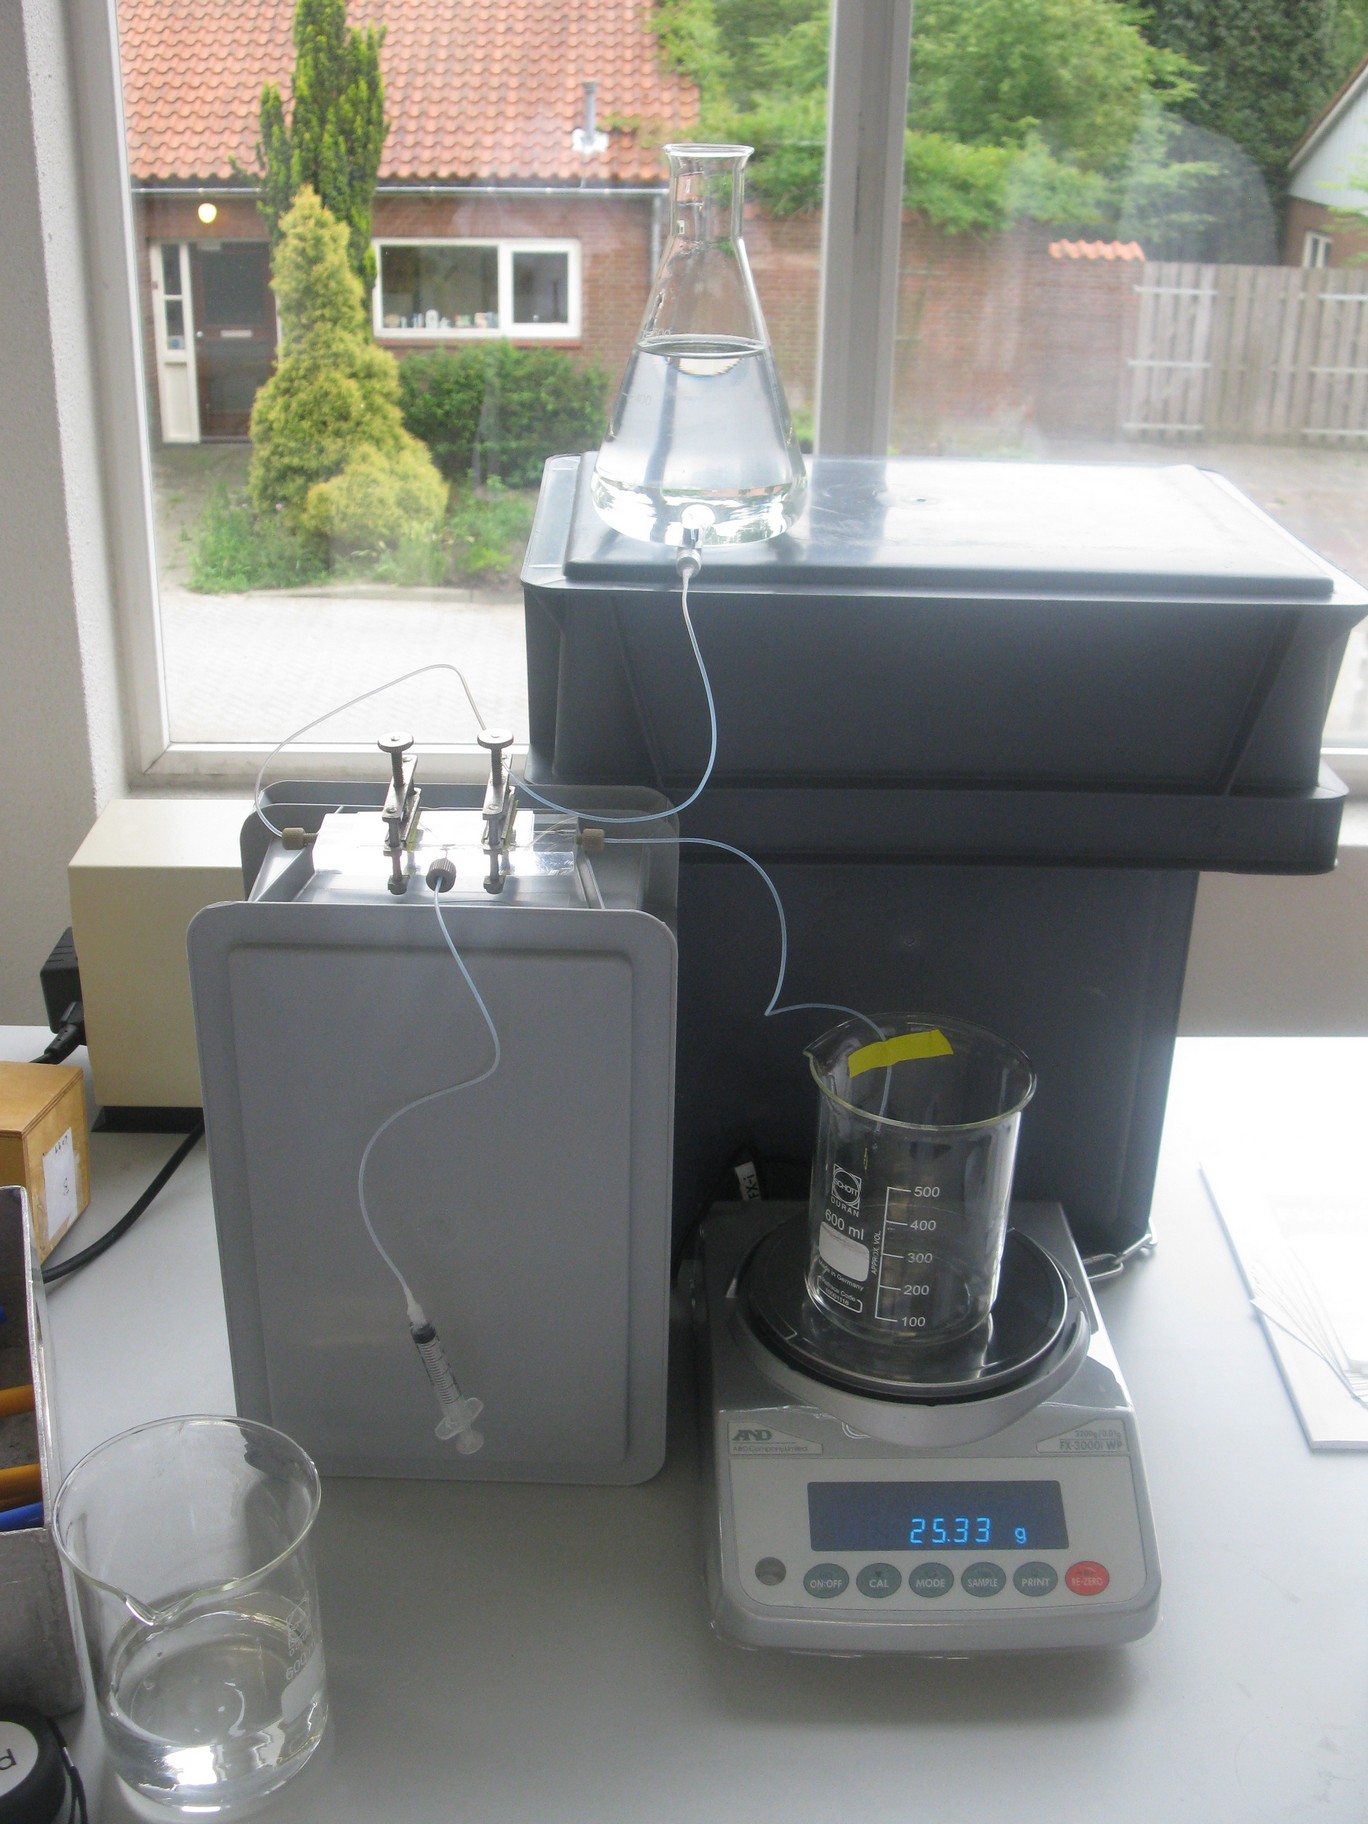
Fig.X: Setup of the device using Bernoulli's principle to control the velocity of the fluid.
However, as mentioned on the modeling page, the dimensions of our fluidic device did not allow the aimed for precise control over the flow rate. This was tested both by calculating some theoretical values applicable for our device and running pilot experiments with water. Furthermore the obtained flow rates were also much faster than the flow rates in which oscillations were to be expected. This was solved by expanding our setup to incorporate the use of a syringe pump which controls the inflow. Figure X+1 shows the new setup.
Fig.X+1: Setup of the device using a pump to control the velocity of the fluid.
As already mentioned in the design section of the device, the chamber was constructed in such a way that it was possible to place it under a fluorescence microscope for measuring GFP.
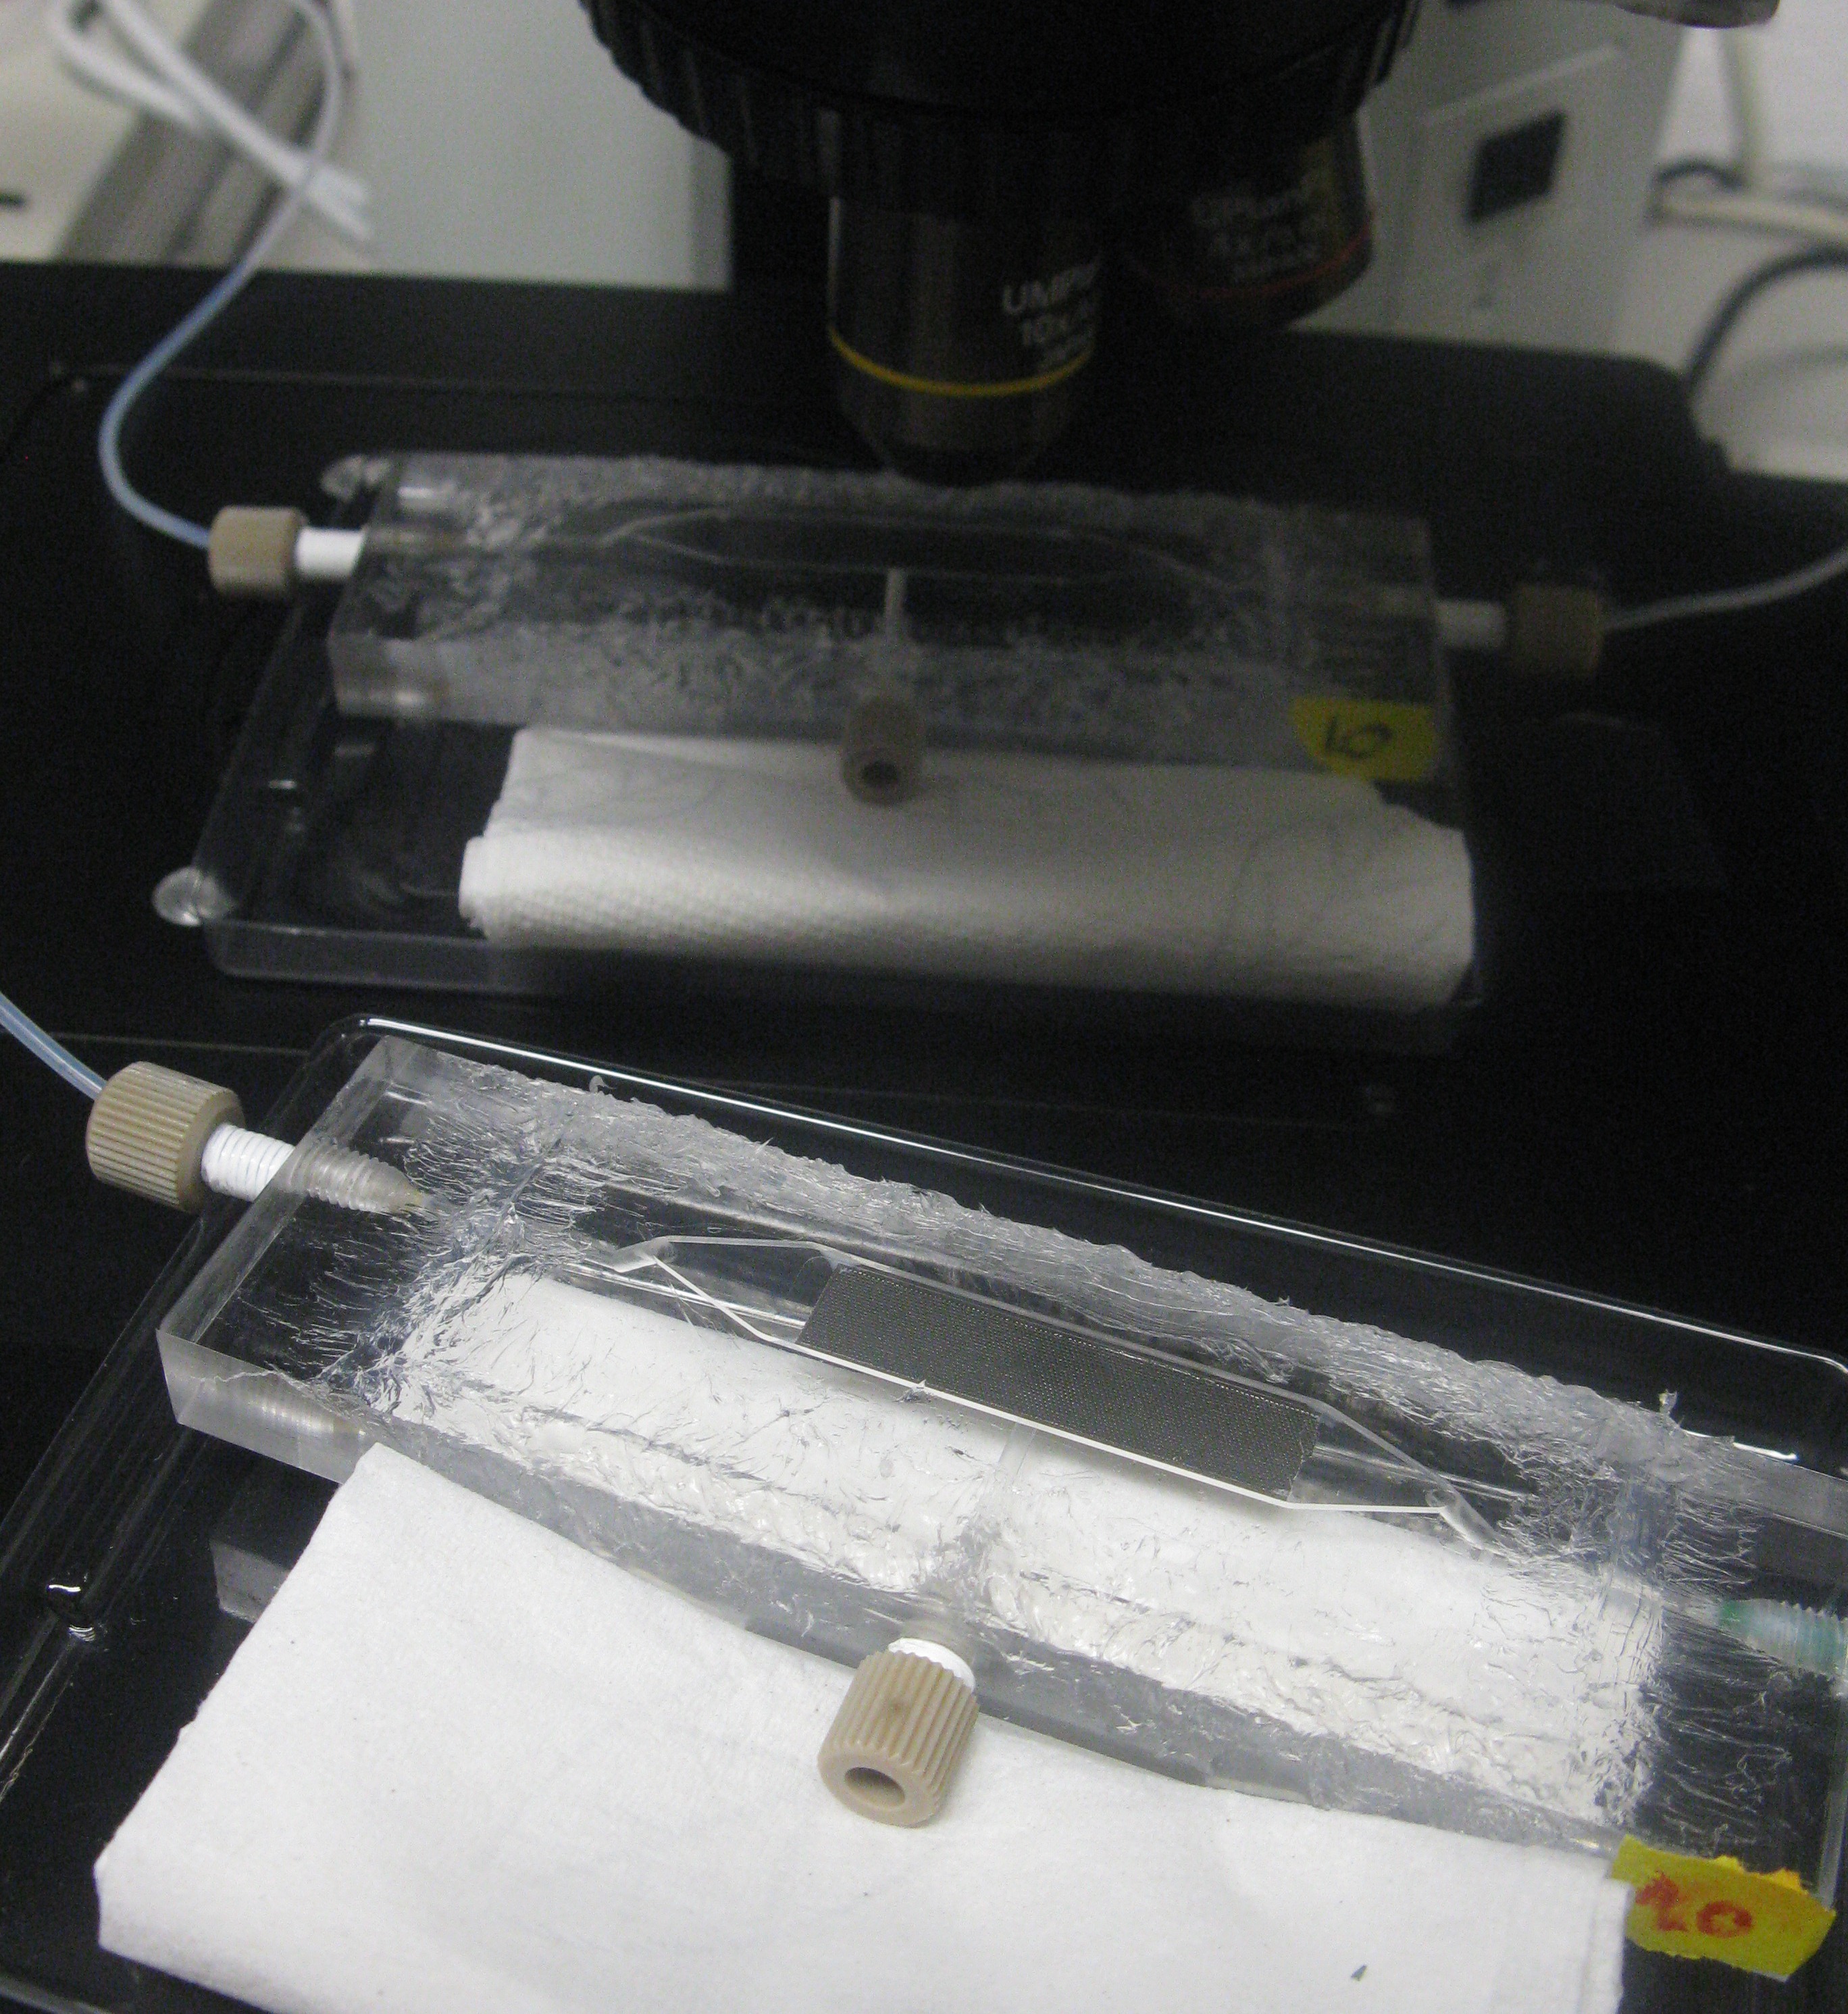
Top: Devices under the microscope
Right: Entire setup of the system around the fluorescence microscope
.
back to top
Controlling cell growth
During the measurements, the bacteria were bottom fed as seen in the scheme in figure X+2. This allowed the measurements to be taken continuously for various hours.
Fig.X+2: Applying bottom feeding to keep the cells in the wells alive
back to top
 "
"


